Cambridge: Fire Incidents, Ohio (OH)
Where are fire incidents reported in Cambridge, OH
Something went wrong! Please refresh the page.
| Fire incidents reported | |
|---|---|
| Sreet name | Count |
| WHEELING AVE | 142 |
| SOUTHGATE PKY | 114 |
| 8TH ST | 98 |
| 9TH ST | 66 |
| GOMBER AVE | 64 |
| 5TH ST | 56 |
| STEUBENVILLE AVE | 52 |
| 7TH ST | 50 |
| SOUTHGATE RD | 50 |
| 10TH ST | 44 |
| GLENN HWY | 44 |
| 12TH ST | 38 |
| 6TH ST | 38 |
| CLARK ST | 38 |
| BLOOMFIELD RD | 36 |
| BYESVILLE RD | 34 |
| BEATTY AVE | 32 |
| ELM ST | 30 |
| WOODLAWN AVE | 30 |
| 4TH ST | 28 |
| CADIZ RD | 28 |
| GASTON AVE | 28 |
| HIGHLAND AVE | 28 |
| I70 | 28 |
| JEFFERSON AVE | 28 |
| CLAYSVILLE RD | 26 |
| MANILA RD | 26 |
| 11TH ST | 24 |
| COSHOCTON AVE | 24 |
| DEWEY AVE | 24 |
| Other | 602 |
2002 - 2018 National Fire Incident Reporting System (NFIRS) incidents
- Incident types reported to NFIRS in Cambridge, OH
- 3,51833.9%Rescue & EMS
- 1,95018.8%Fire
- 1,82717.6%Hazardous Condition
- 1,65916.0%Service Call
- 9669.3%Good Intent Call
- 3703.6%False Alarm
- 490.5%Special Incident
- 340.3%Overpressure Rupture
- Fire incident types reported to NFIRS in Cambridge, OH
- 93648.0%Structure Fires
- 62932.3%Outside Fires
- 36318.6%Mobile Property/Vehicle Fires
- 221.1%Other
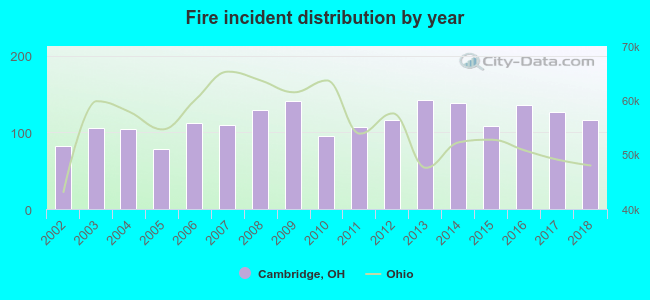 Based on the data from the years 2002 - 2018 the average number of fire incidents per year is 115. The highest number of reported fire incidents - 142 took place in 2013, and the least - 79 in 2005. The data has a growing trend.
The average number of yearly fire incidents per 10k residents in Cambridge, OH compared to nearest cities:
(Note: Based on data for the last 3 years, including only cities with population 5,000 and above)
| Cambridge: | 120.5 |
| Coshocton: | 100.5 |
| Zanesville: | 123.2 |
| Uhrichsville: | 115.4 |
| New Philadelphia: | 37.1 |
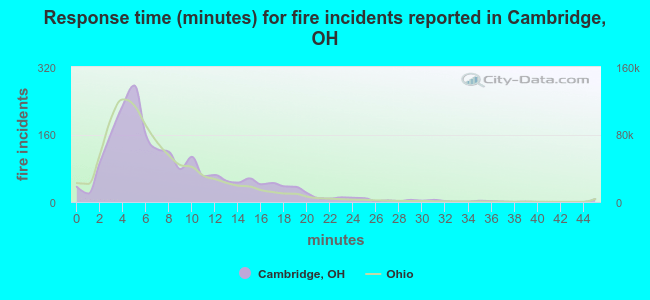 The median response time based on all reported fire incidents is 6 minutes. This is close to the state median value.
The median response time in Cambridge, OH compared to nearest cities:
(Note: Based on data for all years, including only cities with at least 500 fire incidents)
| Cambridge: | 6 minutes |
| Byesville: | 9 minutes |
| Quaker City: | 12 minutes |
| Newcomerstown: | 11 minutes |
| Coshocton: | 5 minutes |
| Zanesville: | 5 minutes |
| Uhrichsville: | 6 minutes |
| Roseville: | 10 minutes |
| Warsaw: | 14 minutes |
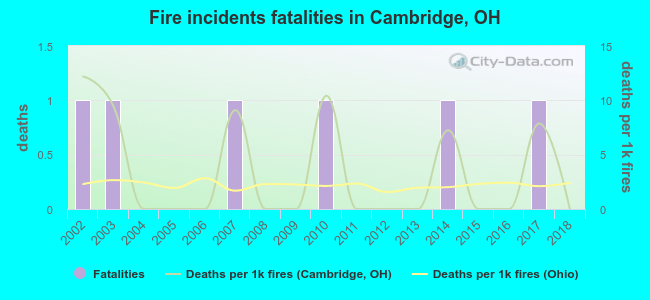 Based on the reports from the years 2002 - 2018 the average number of fire-related fatalities per year is 0. The highest number of reported deaths - 1 took place in 2002, and the lowest - 0 in 2004. The data has a decreasing trend.
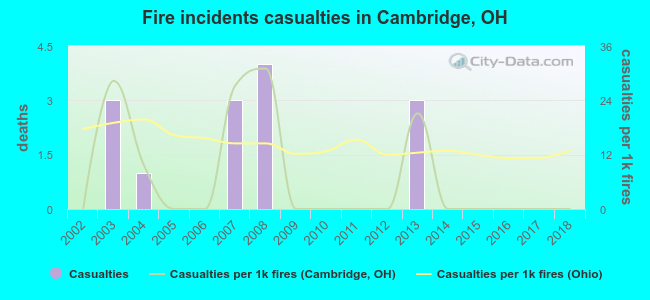 According to the data from the years 2002 - 2018 the average number of fire-related casualties per year is 1. The highest number of injuries - 4 took place in 2008, and the lowest - 0 in 2002. The data has a constant trend.
The average number of casualties per 1,000 fire incidents is 7. This indicator was the highest - 31 in 2008, and the lowest 0 in 2002. The trend for casualties per 1,000 incidents is constant. Compared to the Ohio value the number of casualties per 1,000 incidents is lower.
According to the data from the years 2002 - 2018 the average number of fire-related casualties per year is 1. The highest number of injuries - 4 took place in 2008, and the lowest - 0 in 2002. The data has a constant trend.
The average number of casualties per 1,000 fire incidents is 7. This indicator was the highest - 31 in 2008, and the lowest 0 in 2002. The trend for casualties per 1,000 incidents is constant. Compared to the Ohio value the number of casualties per 1,000 incidents is lower.Casualties per 1,000 incidents in Cambridge, OH compared to nearest cities:
(Note: Based on data for all years, including only cities with at least 500 fire incidents)
| Cambridge: | 7.2 |
| Byesville: | 5.6 |
| Quaker City: | 0.0 |
| Newcomerstown: | 2.4 |
| Coshocton: | 8.8 |
| Zanesville: | 17.1 |
| Uhrichsville: | 11.8 |
| Roseville: | 5.0 |
| Warsaw: | 0.0 |
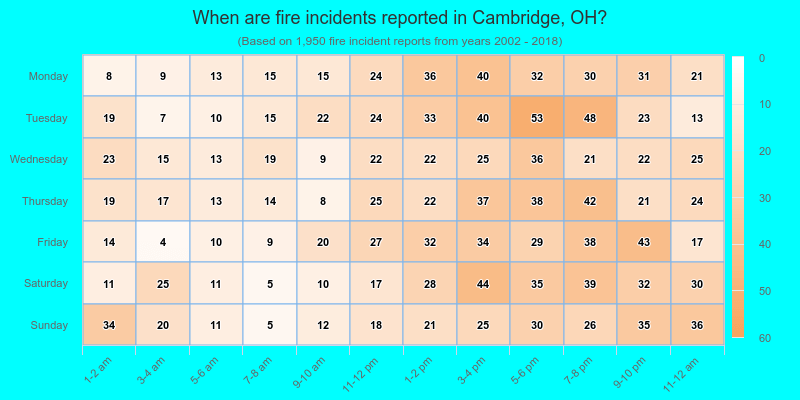
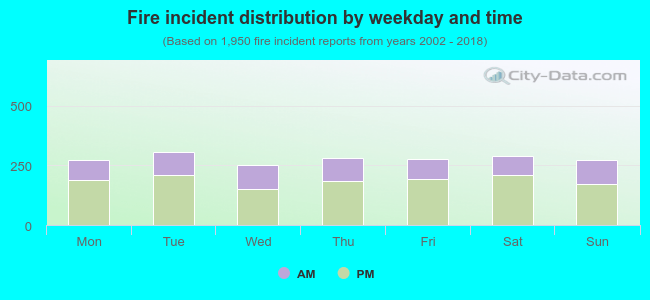 32.9% incidents where reported in the morning and 67.1% in the evening. The most fires (15.7%) took place on Tuesday, and the least (12.9%) on Wednesday.
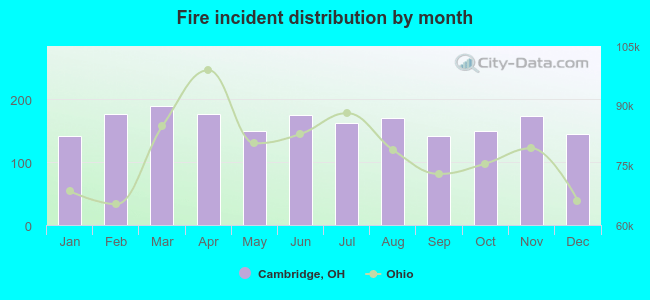 Based on the 1,950 fire incident reports from years 2002 - 2018 most fires (9.7%) took place during March, and the least (7.2%) in January.
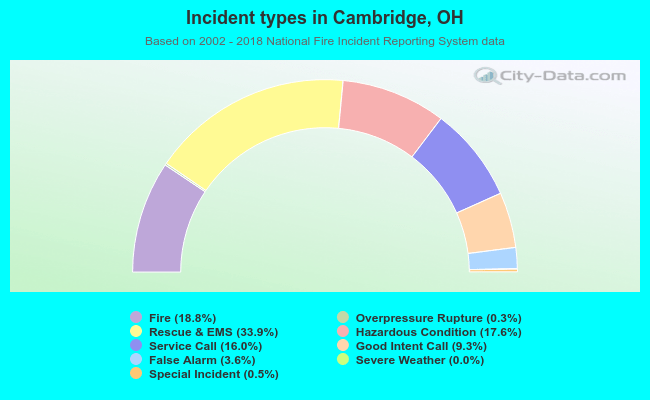 Out of all 10,378 cases reported during the years 2002 - 2018, the most belonged to the categories: Rescue & EMS (33.9%), Fire (18.8%), and Hazardous Condition (17.6%).
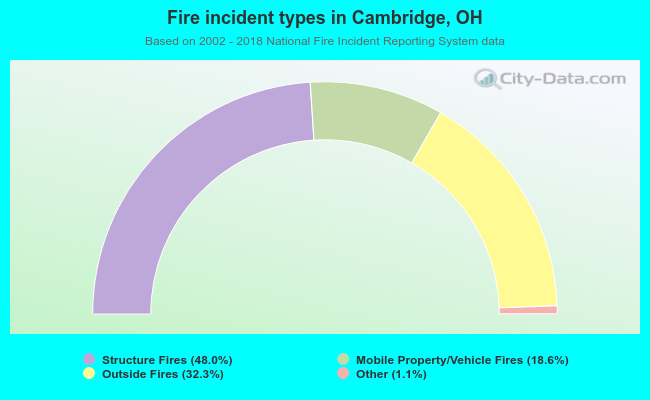 When looking into fire subcategories, the most incidents belonged to: Structure Fires (48.0%), and Outside Fires (32.3%).