Burlington: Fire Incidents, Iowa (IA)
Where are fire incidents reported in Burlington, IA
Something went wrong! Please refresh the page.
| Fire incidents reported | |
|---|---|
| Sreet name | Count |
| CENTRAL AVE | 128 |
| 8TH ST | 114 |
| SUMMER ST | 110 |
| ROOSEVELT AVE | 98 |
| AGENCY ST | 84 |
| MT. PLEASANT ST | 74 |
| 3RD ST | 72 |
| 12TH ST | 68 |
| 9TH ST | 66 |
| 10TH ST | 60 |
| DIVISION ST | 60 |
| JEFFERSON ST | 60 |
| MAIN ST | 58 |
| MADISON AVE | 54 |
| 4TH ST | 52 |
| SUNNYSIDE AVE | 50 |
| VALLEY ST | 50 |
| WEST AVE | 50 |
| ANGULAR ST | 48 |
| MT PLEASANT ST | 48 |
| 6TH ST | 46 |
| 7TH ST | 44 |
| 5TH ST | 40 |
| OAK ST | 38 |
| MAPLE ST | 36 |
| 13TH ST | 34 |
| GARFIELD AVE | 34 |
| WASHINGTON ST | 34 |
| HWY 61 HWY | 32 |
| FRONT ST | 30 |
| Other | 78 |
2002 - 2018 National Fire Incident Reporting System (NFIRS) incidents
- Incident types reported to NFIRS in Burlington, IA
- 7,36554.2%Rescue & EMS
- 1,85013.6%Fire
- 1,65312.2%Service Call
- 1,41410.4%Hazardous Condition
- 8556.3%Good Intent Call
- 4353.2%False Alarm
- 180.1%Overpressure Rupture
- Fire incident types reported to NFIRS in Burlington, IA
- 94551.1%Structure Fires
- 54329.4%Outside Fires
- 29916.2%Mobile Property/Vehicle Fires
- 633.4%Other
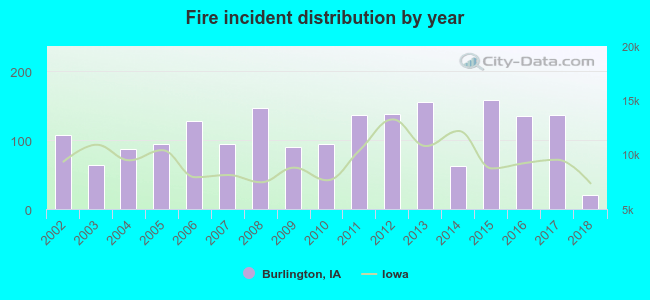 According to the data from the years 2002 - 2018 the average number of fire incidents per year is 109. The highest number of reported fire incidents - 158 took place in 2015, and the least - 20 in 2018. The data has a decreasing trend.
The average number of yearly fire incidents per 10k residents in Burlington, IA compared to nearest cities:
(Note: Based on data for the last 3 years, including only cities with population 5,000 and above)
| Burlington: | 38.0 |
| Fort Madison: | 37.6 |
| Mount Pleasant: | 43.9 |
| Keokuk: | 35.9 |
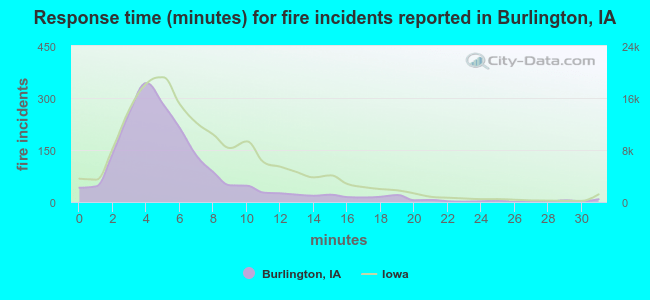 The median response time based on all reported fire incidents is 5 minutes. This is lower than the state median value.
The median response time in Burlington, IA compared to nearest cities:
(Note: Based on data for all years, including only cities with at least 500 fire incidents)
| Burlington: | 5 minutes |
| Fort Madison: | 3 minutes |
| Monmouth: | 6 minutes |
| Keokuk: | 4 minutes |
| Macomb: | 5 minutes |
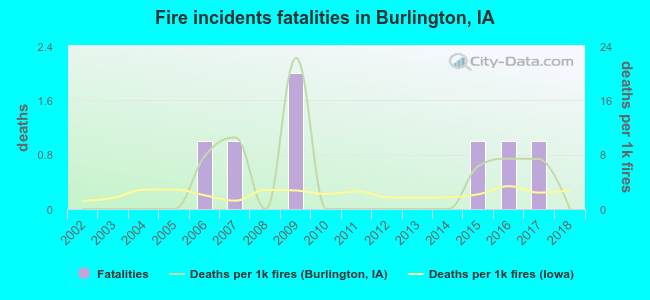 According to the reports from the years 2002 - 2018 the average number of fire-related fatalities per year is 0. The highest number of deaths - 2 took place in 2009, and the lowest - 0 in 2002. The data has a constant trend.
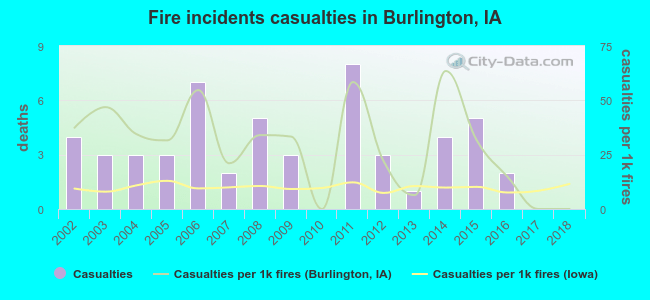 According to the reports from the years 2002 - 2018 the average number of fire-related yearly casualties is 3. The highest number of injuries - 8 took place in 2011, and the lowest - 0 in 2010. The data has a decreasing trend.
The average number of casualties per 1,000 fire incidents is 29. This indicator was the highest - 63 in 2014, and the lowest 0 in 2010. The trend for injuries per 1,000 fires is dropping. Compared to the Iowa value the number of injuries per 1,000 fires is much higher.
According to the reports from the years 2002 - 2018 the average number of fire-related yearly casualties is 3. The highest number of injuries - 8 took place in 2011, and the lowest - 0 in 2010. The data has a decreasing trend.
The average number of casualties per 1,000 fire incidents is 29. This indicator was the highest - 63 in 2014, and the lowest 0 in 2010. The trend for injuries per 1,000 fires is dropping. Compared to the Iowa value the number of injuries per 1,000 fires is much higher.Casualties per 1,000 incidents in Burlington, IA compared to nearest cities:
(Note: Based on data for all years, including only cities with at least 500 fire incidents)
| Burlington: | 28.6 |
| Fort Madison: | 5.8 |
| Monmouth: | 14.4 |
| Keokuk: | 4.5 |
| Macomb: | 3.8 |
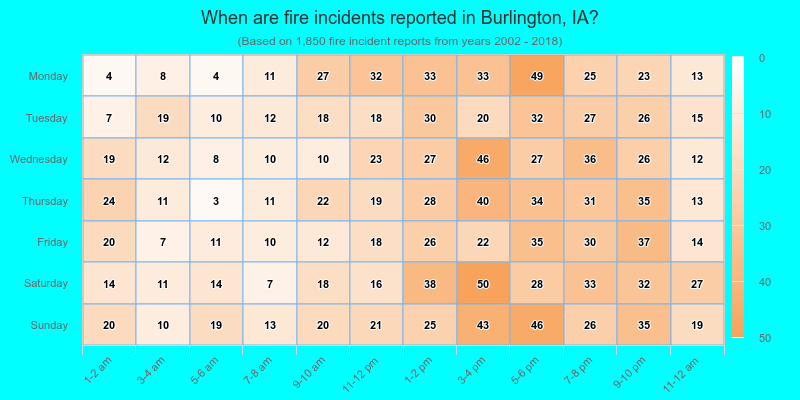
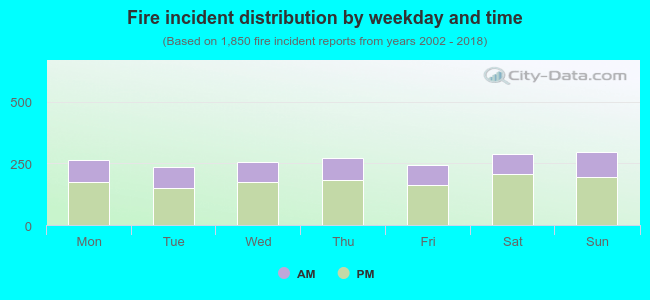 32.6% incidents where reported in the morning and 67.4% in the evening. The most fires (16.1%) took place on Sunday, and the least (12.6%) on Tuesday.
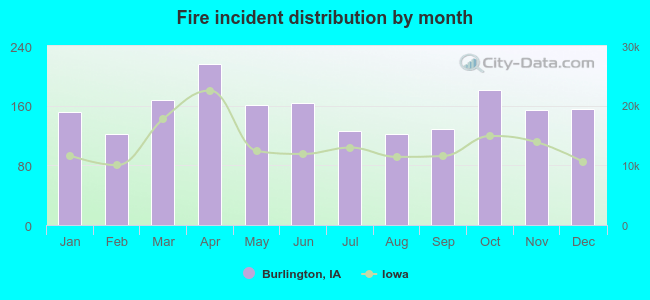 Based on the 1,850 incident reports from years 2002 - 2018 most fires (11.7%) took place during April, and the least (6.6%) in February.
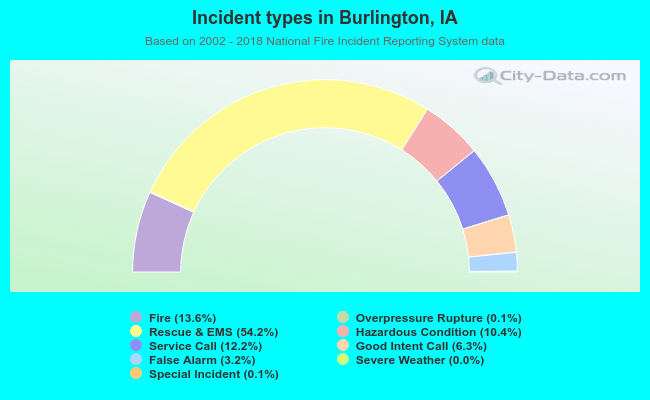 Out of all 13,601 cases reported during the years 2002 - 2018, the most belonged to the categories: Rescue & EMS (54.2%), Fire (13.6%), and Service Call (12.2%).
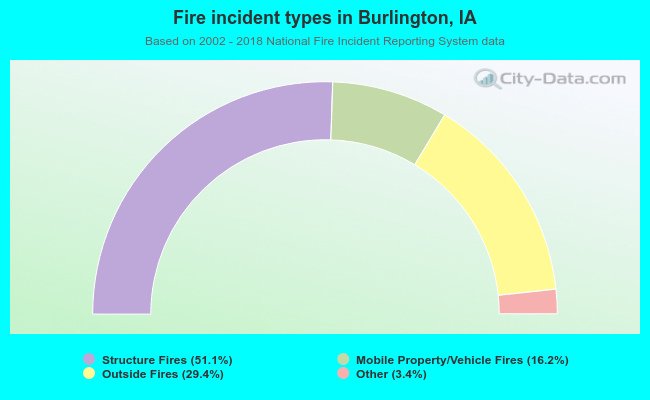 When looking into fire subcategories, the most incidents belonged to: Structure Fires (51.1%), and Outside Fires (29.4%).