Brockport: Fire Incidents, New York (NY)
Where are fire incidents reported in Brockport, NY
Something went wrong! Please refresh the page.
|
| |||||||||||||||||||||||||||||||||||||||||||||||||||||||||||||||||||||||||||||||||||||||||||||||||||||||||||||
2003 - 2018 National Fire Incident Reporting System (NFIRS) incidents
- Incident types reported to NFIRS in Brockport, NY
- 1,21537.3%Hazardous Condition
- 73122.4%Fire
- 32510.0%Rescue & EMS
- 3229.9%False Alarm
- 3109.5%Service Call
- 2939.0%Good Intent Call
- 531.6%Overpressure Rupture
- 50.2%Severe Weather
- Fire incident types reported to NFIRS in Brockport, NY
- 42758.4%Structure Fires
- 22430.6%Outside Fires
- 476.4%Mobile Property/Vehicle Fires
- 334.5%Other
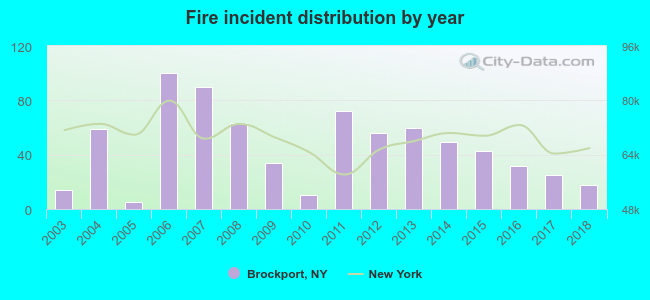 Based on the data from the years 2003 - 2018 the average number of fire incidents per year is 46. The highest number of fire incidents - 100 took place in 2006, and the least - 5 in 2005. The data has an increasing trend.
The average number of yearly fire incidents per 10k residents in Brockport, NY compared to nearest cities:
(Note: Based on data for the last 3 years, including only cities with population 5,000 and above)
| Brockport: | 29.8 |
| Sweden: | 15.0 |
| Clarkson: | 31.2 |
| Ogden: | 0.5 |
| Hamlin: | 28.4 |
| Parma: | 10.2 |
| Riga: | 4.8 |
| Hilton: | 29.1 |
| Greece: | 81.3 |
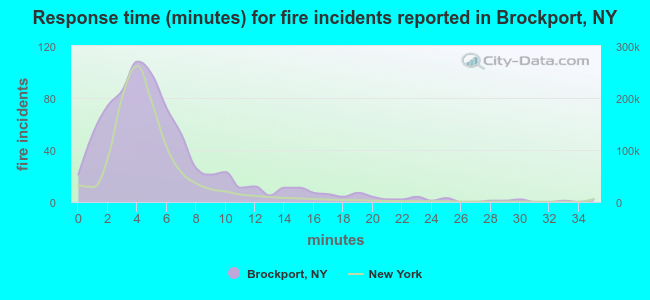 The median response time based on all reported fire incidents is 5 minutes. This is higher compared to the state median value.
The median response time in Brockport, NY compared to nearest cities:
(Note: Based on data for all years, including only cities with at least 500 fire incidents)
| Brockport: | 5 minutes |
| Spencerport: | 8 minutes |
| Hamlin: | 5 minutes |
| Hilton: | 5 minutes |
| Albion: | 7 minutes |
| Rochester: | 4 minutes |
| Batavia: | 4 minutes |
| Medina: | 5 minutes |
| Pittsford: | 6 minutes |
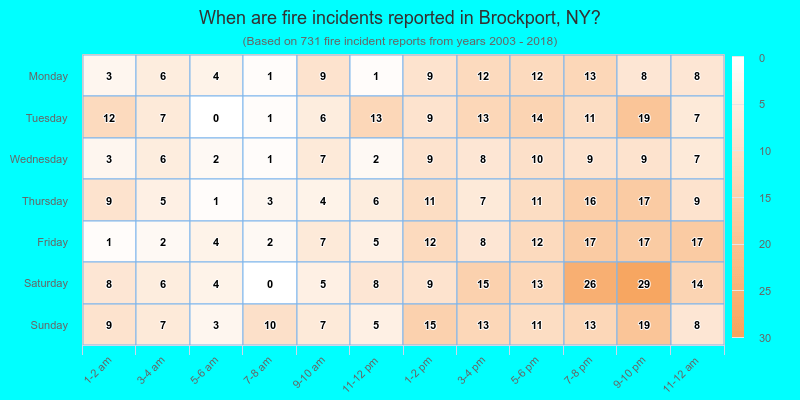
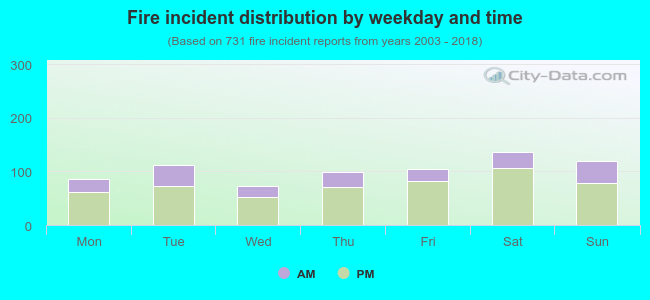 28.0% incidents where reported in the morning and 72.0% in the evening. The most fires (18.7%) took place on Saturday, and the least (10.0%) on Wednesday.
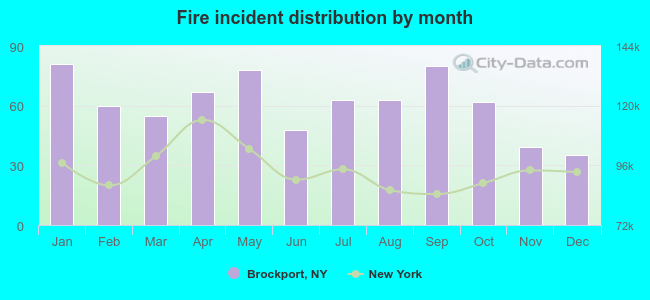 According to the 731 incident reports from years 2003 - 2018 most fires (11.1%) took place during January, and the least (4.8%) in December.
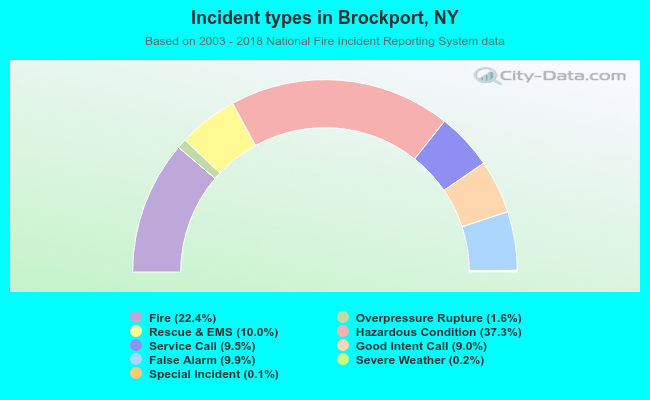 Out of all 3,257 cases reported during the years 2003 - 2018, the most belonged to the categories: Hazardous Condition (37.3%), Fire (22.4%), and Rescue & EMS (10.0%).
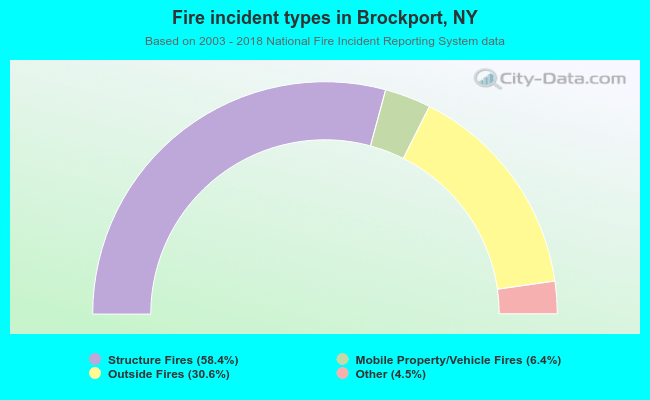 When looking into fire subcategories, the most reports belonged to: Structure Fires (58.4%), and Outside Fires (30.6%).