Bristol: Fire Incidents, Virginia (VA)
Where are fire incidents reported in Bristol, VA
Something went wrong! Please refresh the page.
| Fire incidents reported | |
|---|---|
| Sreet name | Count |
| MOORE ST | 440 |
| MARY ST | 210 |
| LEE HWY | 138 |
| MOORE ST | 134 |
| LEE HWY | 132 |
| EDMOND ST | 92 |
| MARY ST | 84 |
| EUCLID AVE | 82 |
| PORTSMOUTH AVE | 70 |
| LEE HIGHWAY | 68 |
| EUCLID AVE | 62 |
| OLD AIRPORT RD | 62 |
| EDMOND ST | 54 |
| SHELBY ST | 54 |
| STATE ST | 52 |
| INDUSTRIAL PARK RD | 50 |
| ISLAND RD | 44 |
| LINDEN DR | 42 |
| SHELBY ST | 42 |
| GATE CITY HWY | 40 |
| SHAKESVILLE RD | 40 |
| GATE CITY HWY | 34 |
| INTERSTATE 81 | 34 |
| KING MILL PK | 34 |
| 2ND ST | 32 |
| NORFOLK AVE | 32 |
| COMMONWEALTH AVE | 30 |
| COMMONWEALTH AVE | 30 |
| I-81 NORTHBOUND | 30 |
| NEWTON ST | 30 |
| Other | 584 |
2002 - 2018 National Fire Incident Reporting System (NFIRS) incidents
- Incident types reported to NFIRS in Bristol, VA
- 10,62154.1%Rescue & EMS
- 2,86214.6%Fire
- 1,8999.7%Good Intent Call
- 1,6178.2%False Alarm
- 1,3857.1%Hazardous Condition
- 1,1215.7%Service Call
- 680.3%Special Incident
- 290.1%Severe Weather
- 260.1%Overpressure Rupture
- Fire incident types reported to NFIRS in Bristol, VA
- 1,52653.3%Structure Fires
- 87430.5%Outside Fires
- 37913.2%Mobile Property/Vehicle Fires
- 832.9%Other
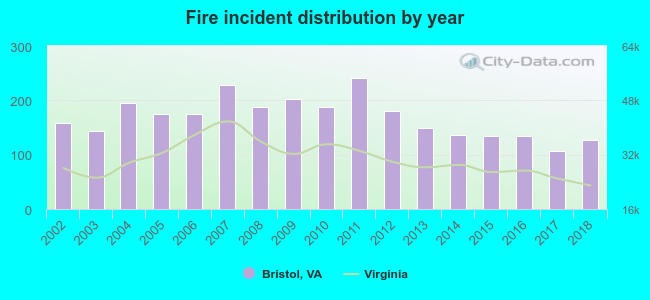 According to the data from the years 2002 - 2018 the average number of fires per year is 168. The highest number of fires - 241 took place in 2011, and the least - 106 in 2017. The data has a decreasing trend.
The average number of yearly fire incidents per 10k residents in Bristol, VA compared to nearest cities:
(Note: Based on data for the last 3 years, including only cities with population 5,000 and above)
| Bristol: | 71.2 |
| Abingdon: | 107.2 |
| Big Stone Gap: | 56.8 |
 The median response time based on all reported fire incidents is 4 minutes. This is lower than the Virginia median value.
The median response time in Bristol, VA compared to nearest cities:
(Note: Based on data for all years, including only cities with at least 500 fire incidents)
| Bristol: | 4 minutes |
| Bristol: | 6 minutes |
| Blountville: | 11 minutes |
| Bluff City: | 8 minutes |
| Abingdon: | 9 minutes |
| Elizabethton: | 8 minutes |
| Kingsport: | 7 minutes |
| Gray: | 10 minutes |
| Johnson City: | 4 minutes |
 Based on the reports from the years 2002 - 2018 the average number of fire-related fatalities per year is 0. The highest number of deaths - 2 took place in 2007, and the lowest - 0 in 2002. The data has a constant trend.
The average number of deaths per 1,000 fire incidents is 2. This indicator was the highest - 11 in 2010, and the lowest 0 in 2002. The trend for fatalities per 1,000 incidents is constant. Compared to the state value the number of fatalities per 1,000 fire incidents is about the same.
Based on the reports from the years 2002 - 2018 the average number of fire-related fatalities per year is 0. The highest number of deaths - 2 took place in 2007, and the lowest - 0 in 2002. The data has a constant trend.
The average number of deaths per 1,000 fire incidents is 2. This indicator was the highest - 11 in 2010, and the lowest 0 in 2002. The trend for fatalities per 1,000 incidents is constant. Compared to the state value the number of fatalities per 1,000 fire incidents is about the same.Deaths per 1,000 incidents in Bristol, VA compared to nearest cities:
(Note: Based on data for all years, including only cities with at least 2,500 fire incidents)
| Bristol: | 2.1 |
| Elizabethton: | 2.2 |
| Kingsport: | 3.4 |
| Johnson City: | 4.7 |
 Based on the data from the years 2002 - 2018 the average number of fire-related casualties per year is 4. The highest number of reported injuries - 11 took place in 2010, and the lowest - 0 in 2014. The data has a dropping trend.
The average number of injuries per 1,000 fires is 23. This indicator was the highest - 59 in 2010, and the lowest 0 in 2014. The trend for injuries per 1,000 incidents is dropping. Compared to the state value the number of casualties per 1,000 fire incidents is much higher.
Based on the data from the years 2002 - 2018 the average number of fire-related casualties per year is 4. The highest number of reported injuries - 11 took place in 2010, and the lowest - 0 in 2014. The data has a dropping trend.
The average number of injuries per 1,000 fires is 23. This indicator was the highest - 59 in 2010, and the lowest 0 in 2014. The trend for injuries per 1,000 incidents is dropping. Compared to the state value the number of casualties per 1,000 fire incidents is much higher.Casualties per 1,000 incidents in Bristol, VA compared to nearest cities:
(Note: Based on data for all years, including only cities with at least 500 fire incidents)
| Bristol: | 26.2 |
| Bristol: | 6.9 |
| Blountville: | 4.1 |
| Bluff City: | 6.0 |
| Abingdon: | 12.2 |
| Elizabethton: | 14.3 |
| Kingsport: | 13.7 |
| Gray: | 1.6 |
| Johnson City: | 19.1 |
 31.7% incidents where reported in the morning and 68.3% in the evening. The most fires (15.4%) took place on Saturday, and the least (13.6%) on Tuesday.
 According to the 2,862 fire incident reports from years 2002 - 2018 most fires (11.1%) took place during April, and the least (6.7%) in August.
 Out of all 19,628 cases reported during the years 2002 - 2018, the most belonged to the categories: Rescue & EMS (54.1%), Fire (14.6%), and Good Intent Call (9.7%).
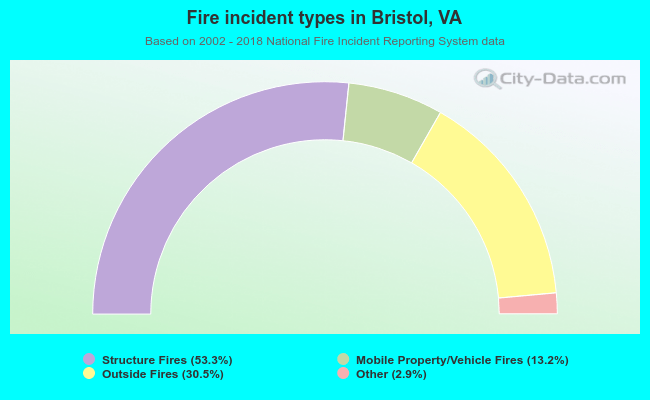 When looking into fire subcategories, the most reports belonged to: Structure Fires (53.3%), and Outside Fires (30.5%).