Briarcliff Manor: Fire Incidents, New York (NY)
Where are fire incidents reported in Briarcliff Manor, NY
Something went wrong! Please refresh the page.
|
| |||||||||||||||||||||||||||||||||||||||||||||||||||||||||||||||||||||||||||||||||||||||||||||||||||||||||||||
2002 - 2018 National Fire Incident Reporting System (NFIRS) incidents
- Incident types reported to NFIRS in Briarcliff Manor, NY
- 81328.7%False Alarm
- 78727.8%Hazardous Condition
- 73526.0%Rescue & EMS
- 1756.2%Good Intent Call
- 1635.8%Fire
- 1455.1%Service Call
- 70.2%Special Incident
- Fire incident types reported to NFIRS in Briarcliff Manor, NY
- 8552.1%Structure Fires
- 4225.8%Outside Fires
- 3320.2%Mobile Property/Vehicle Fires
- 31.8%Other
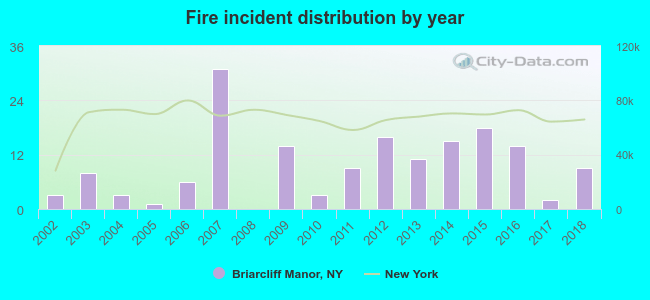 Based on the data from the years 2002 - 2018 the average number of fire incidents per year is 10. The highest number of fire incidents - 31 took place in 2007, and the least - 0 in 2008. The data has an increasing trend.
The average number of yearly fire incidents per 10k residents in Briarcliff Manor, NY compared to nearest cities:
(Note: Based on data for the last 3 years, including only cities with population 5,000 and above)
| Briarcliff Manor: | 10.4 |
| Ossining: | 12.8 |
| Pleasantville: | 6.3 |
| Sleepy Hollow: | 3.3 |
| New Castle: | 1.1 |
| Tarrytown: | 8.4 |
| Congers: | 31.1 |
| Nyack: | 3.8 |
| Valley Cottage: | 30.4 |
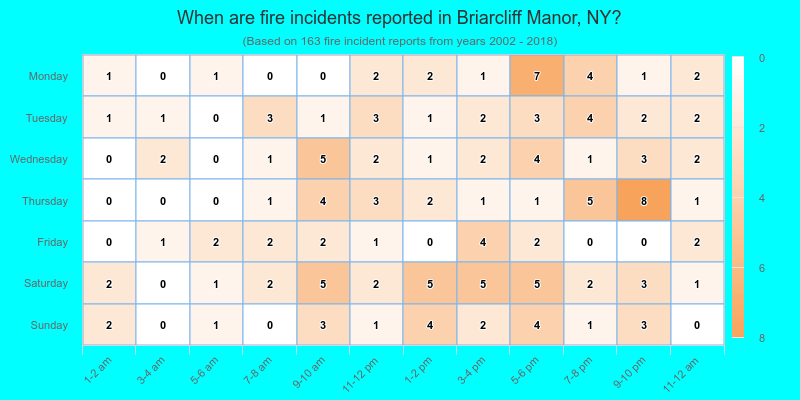
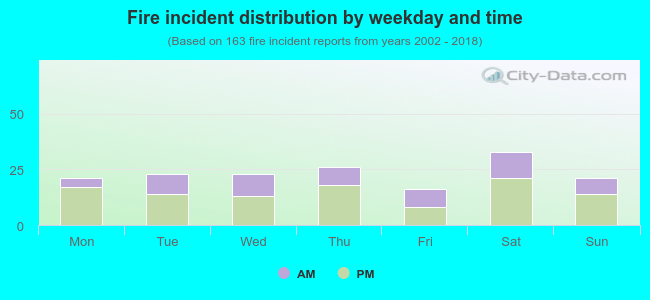 35.6% incidents where reported in the morning and 64.4% in the evening. The most fires (20.2%) took place on Saturday, and the least (9.8%) on Friday.
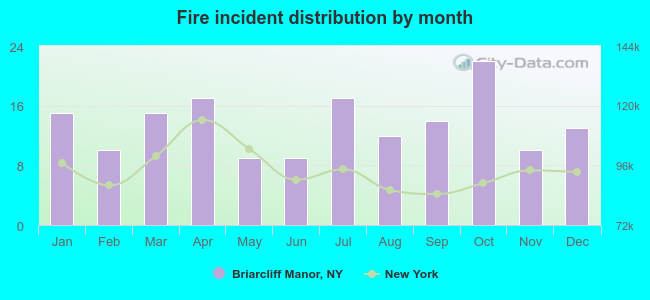 Based on the 163 fires from years 2002 - 2018 most fires (13.5%) took place during October, and the least (5.5%) in May.
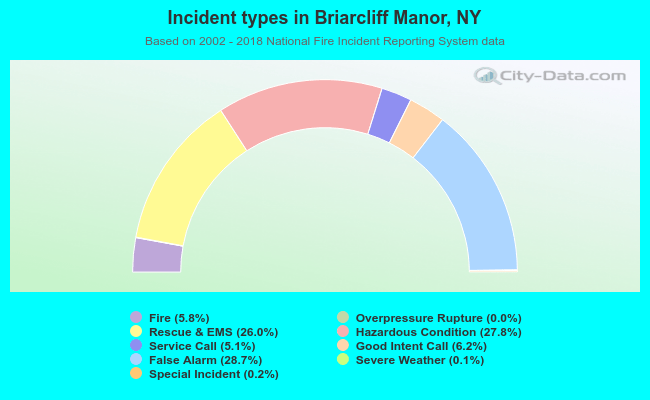 Out of all 2,828 cases reported during the years 2002 - 2018, the most belonged to the categories: False Alarm (28.7%), Hazardous Condition (27.8%), and Rescue & EMS (26.0%).
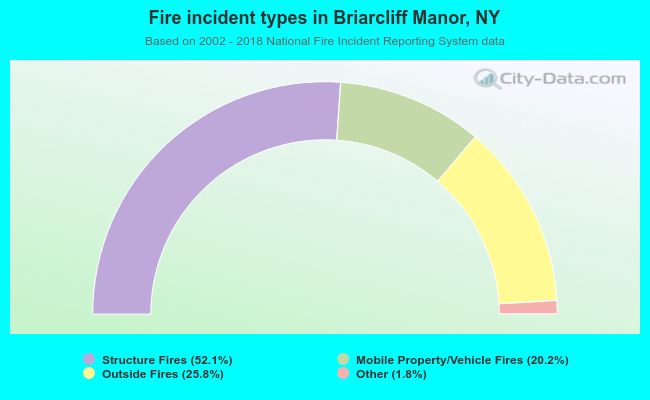 When looking into fire subcategories, the most reports belonged to: Structure Fires (52.1%), and Outside Fires (25.8%).