Bradford: Fire Incidents, Pennsylvania (PA)
Where are fire incidents reported in Bradford, PA
Something went wrong! Please refresh the page.
|
| |||||||||||||||||||||||||||||||||||||||||||||||||||||||||||||||||||||||||||||||||||||||||||||||||||||||||||||
2005 - 2018 National Fire Incident Reporting System (NFIRS) incidents
- Incident types reported to NFIRS in Bradford, PA
- 55122.8%Service Call
- 51421.2%Rescue & EMS
- 43317.9%Fire
- 43117.8%Hazardous Condition
- 30212.5%False Alarm
- 1265.2%Good Intent Call
- 381.6%Severe Weather
- 160.7%Special Incident
- 100.4%Overpressure Rupture
- Fire incident types reported to NFIRS in Bradford, PA
- 24556.6%Structure Fires
- 11927.5%Outside Fires
- 419.5%Mobile Property/Vehicle Fires
- 286.5%Other
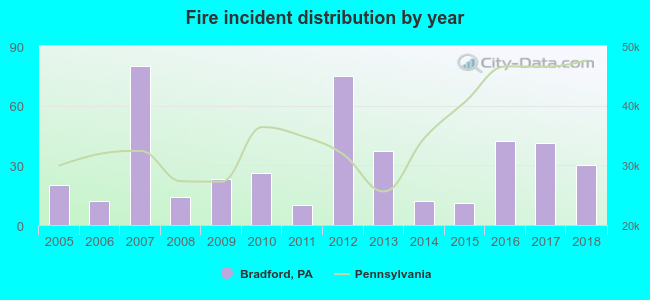 Based on the data from the years 2005 - 2018 the average number of fire incidents per year is 31. The highest number of reported fire incidents - 80 took place in 2007, and the least - 10 in 2011. The data has an increasing trend.
The average number of yearly fire incidents per 10k residents in Bradford, PA compared to nearest cities:
(Note: Based on data for the last 3 years, including only cities with population 5,000 and above)
| Bradford: | 44.0 |
| Warren: | 28.7 |
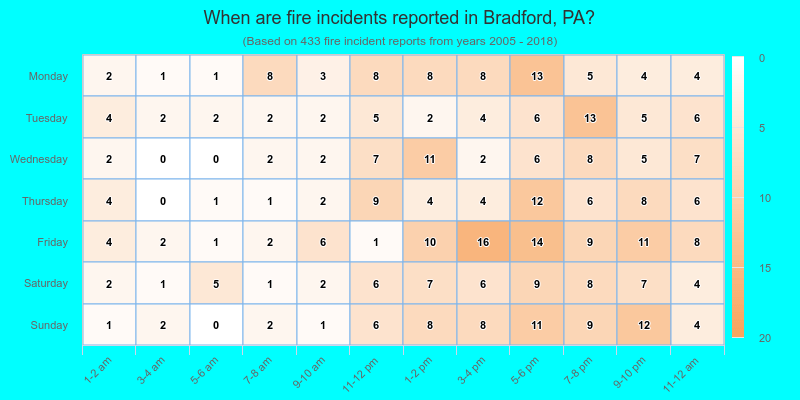
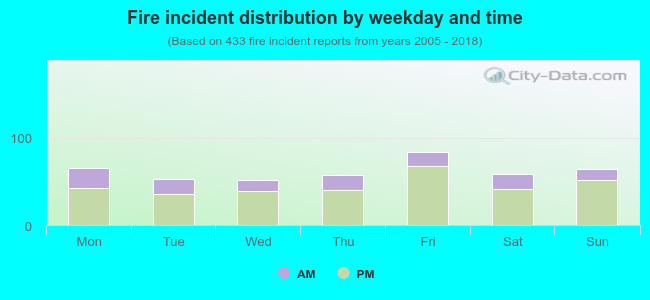 26.6% incidents where reported in the morning and 73.4% in the evening. The most fires (19.4%) took place on Friday, and the least (12.0%) on Wednesday.
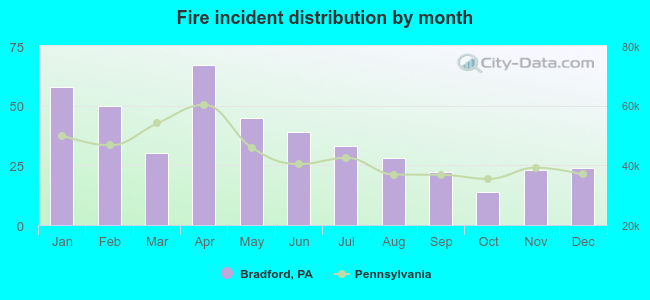 According to the 433 incident reports from years 2005 - 2018 most fires (15.5%) took place during April, and the least (3.2%) in October.
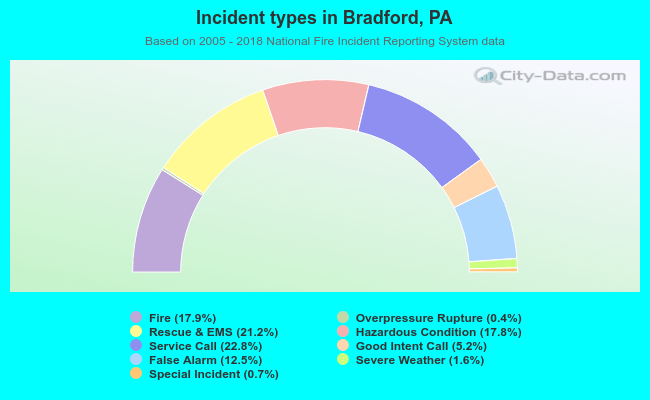 Out of all 2,421 cases reported during the years 2005 - 2018, the most belonged to the categories: Service Call (22.8%), Rescue & EMS (21.2%), and Fire (17.9%).
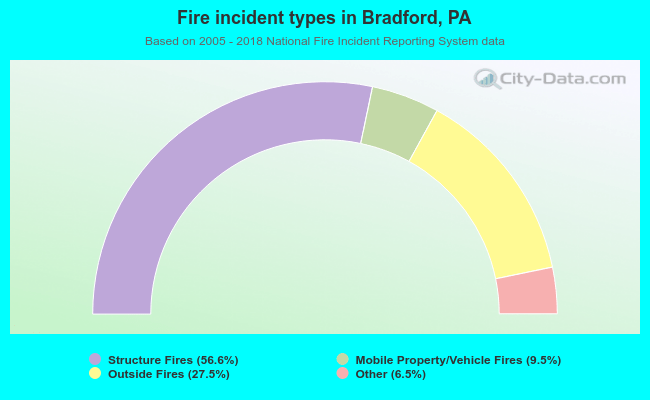 When looking into fire subcategories, the most incidents belonged to: Structure Fires (56.6%), and Outside Fires (27.5%).