Bogota: Fire Incidents, New Jersey (NJ)
Where are fire incidents reported in Bogota, NJ
Something went wrong! Please refresh the page.
|
| |||||||||||||||||||||||||||||||||||||||||||||||||||||||||||||||||||||||||||||||||||||||||||||||||||||||||||||
2005 - 2018 National Fire Incident Reporting System (NFIRS) incidents
- Incident types reported to NFIRS in Bogota, NJ
- 57538.3%Hazardous Condition
- 40627.0%Fire
- 32621.7%False Alarm
- 926.1%Service Call
- 614.1%Good Intent Call
- 312.1%Rescue & EMS
- 50.3%Special Incident
- 40.3%Overpressure Rupture
- 20.1%Severe Weather
- Fire incident types reported to NFIRS in Bogota, NJ
- 31577.6%Structure Fires
- 4410.8%Outside Fires
- 307.4%Mobile Property/Vehicle Fires
- 174.2%Other
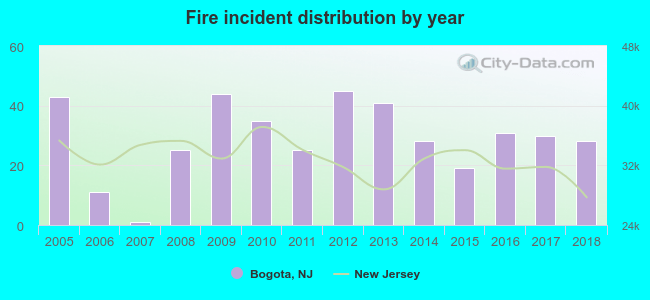 According to the data from the years 2005 - 2018 the average number of fire incidents per year is 29. The highest number of fires - 45 took place in 2012, and the least - 1 in 2007. The data has a dropping trend.
The average number of yearly fire incidents per 10k residents in Bogota, NJ compared to nearest cities:
(Note: Based on data for the last 3 years, including only cities with population 5,000 and above)
| Bogota: | 35.6 |
| Ridgefield Park: | 30.3 |
| Hackensack: | 48.9 |
| Teaneck: | 47.0 |
| Little Ferry: | 19.0 |
| Leonia: | 53.6 |
| Hasbrouck Heights: | 18.9 |
| Palisades Park: | 37.8 |
| Maywood: | 5.8 |
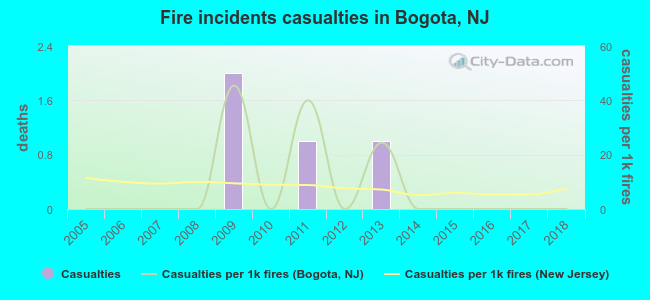 Based on the data from the years 2005 - 2018 the average number of fire-related casualties per year is 0. The highest number of casualties - 2 took place in 2009, and the lowest - 0 in 2005. The data has a constant trend.
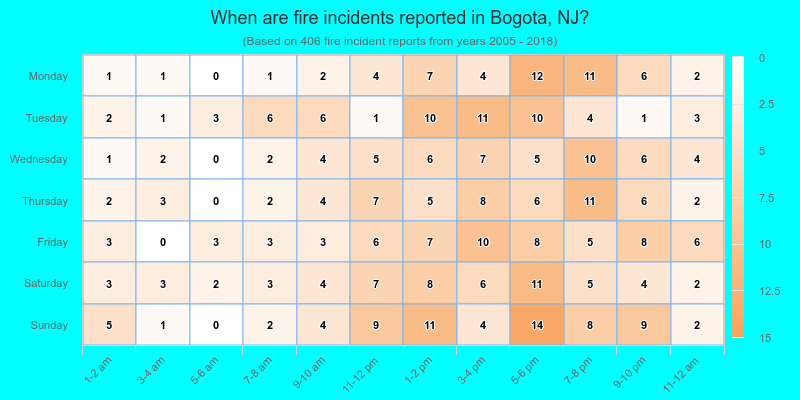
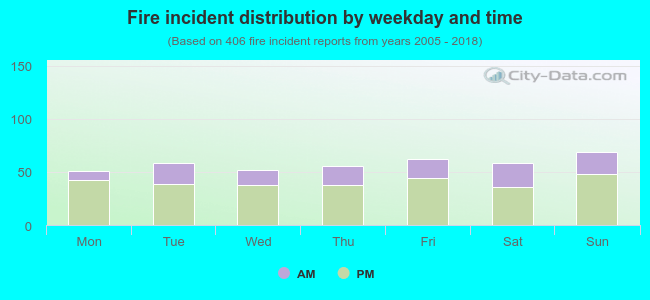 29.8% incidents where reported in the morning and 70.2% in the evening. The most fires (17.0%) took place on Sunday, and the least (12.6%) on Monday.
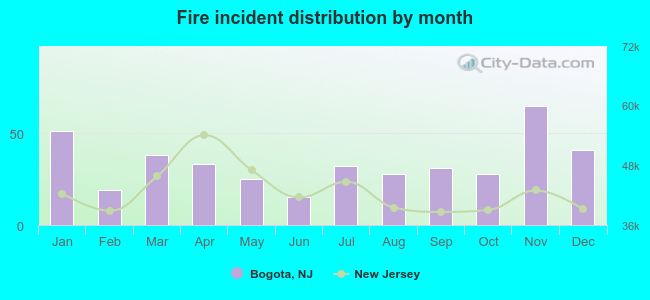 Based on the 406 fires from years 2005 - 2018 most fires (16.0%) took place during November, and the least (3.7%) in June.
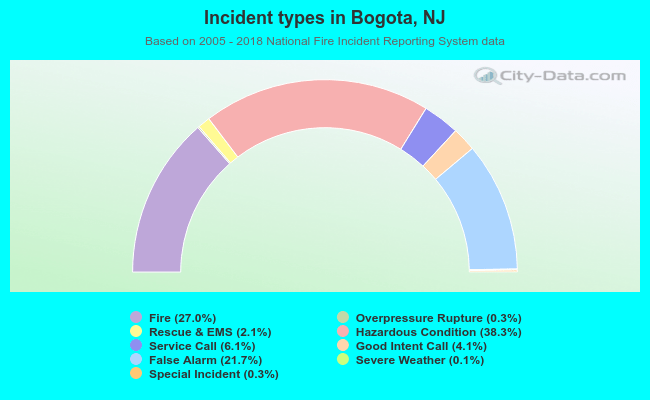 Out of all 1,502 cases reported during the years 2005 - 2018, the most belonged to the categories: Hazardous Condition (38.3%), Fire (27.0%), and False Alarm (21.7%).
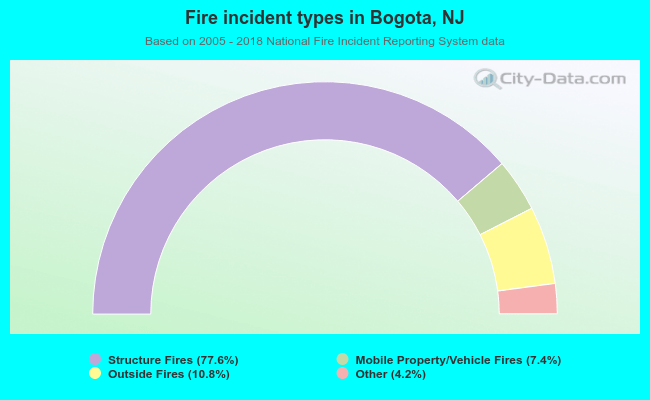 When looking into fire subcategories, the most incidents belonged to: Structure Fires (77.6%), and Outside Fires (10.8%).