Bellmawr: Fire Incidents, New Jersey (NJ)
Where are fire incidents reported in Bellmawr, NJ
Something went wrong! Please refresh the page.
| Fire incidents reported | |
|---|---|
| Sreet name | Count |
| BROWNING RD | 300 |
| KINGS HWY | 76 |
| CREEK RD | 66 |
| BLACK HORSE PIKE | 60 |
| ROUTE 295 HWY | 60 |
| BENIGNO BLVD | 52 |
| KINGS | 46 |
| ROUTE 295 | 40 |
| ALCYON DR | 34 |
| BLACK HORSE | 32 |
| ROUTE 76 | 30 |
| BENIGNO | 26 |
| KINGS HIGHWAY | 26 |
| ROUTE 42 | 26 |
| HARDING AVE | 24 |
| UNION AVE | 24 |
| ADAMS AVE | 22 |
| ROUTE 42 HWY | 22 |
| PEACH RD | 20 |
| ROUTE 42 FWY | 20 |
| WALNUT | 18 |
| BERGEN AVE | 16 |
| CENTER AVE | 16 |
| FORREST DR | 16 |
| PRINCETON AVE | 16 |
| ROUTE 295 RT | 16 |
| SAUNDERS AVE | 16 |
| BERGEN | 14 |
| BLACK HORSE PK | 14 |
| CARTER AVE | 14 |
2002 - 2018 National Fire Incident Reporting System (NFIRS) incidents
- Incident types reported to NFIRS in Bellmawr, NJ
- 1,56631.6%Hazardous Condition
- 1,04821.1%Fire
- 1,03320.8%Good Intent Call
- 70314.2%Rescue & EMS
- 2976.0%Service Call
- 2885.8%False Alarm
- 170.3%Overpressure Rupture
- Fire incident types reported to NFIRS in Bellmawr, NJ
- 67764.6%Structure Fires
- 20019.1%Mobile Property/Vehicle Fires
- 15314.6%Outside Fires
- 181.7%Other
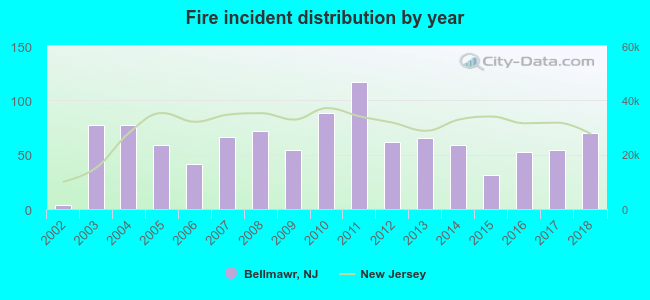 According to the data from the years 2002 - 2018 the average number of fire incidents per year is 62. The highest number of fires - 117 took place in 2011, and the least - 4 in 2002. The data has an increasing trend.
The average number of yearly fire incidents per 10k residents in Bellmawr, NJ compared to nearest cities:
(Note: Based on data for the last 3 years, including only cities with population 5,000 and above)
| Bellmawr: | 51.2 |
| Runnemede: | 46.2 |
| Haddon Heights: | 29.4 |
| Audubon: | 35.6 |
| Barrington: | 61.0 |
| Gloucester City: | 52.7 |
| Collingswood: | 84.3 |
| Haddonfield: | 26.9 |
| Woodbury: | 68.6 |
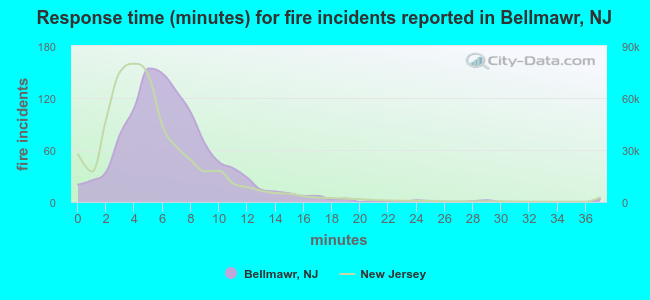 The median response time based on all reported fire incidents is 6 minutes. This is about the same as the New Jersey median value.
The median response time in Bellmawr, NJ compared to nearest cities:
(Note: Based on data for all years, including only cities with at least 500 fire incidents)
| Bellmawr: | 6 minutes |
| Runnemede: | 7 minutes |
| Haddon Heights: | 6 minutes |
| Westville: | 6 minutes |
| Audubon: | 5 minutes |
| Barrington: | 7 minutes |
| Gloucester City: | 4 minutes |
| Magnolia: | 6 minutes |
| Collingswood: | 4 minutes |
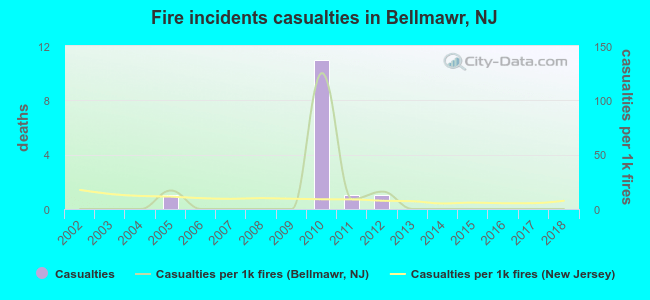 According to the reports from the years 2002 - 2018 the average number of fire-related yearly casualties is 1. The highest number of injuries - 11 took place in 2010, and the lowest - 0 in 2002. The data has a constant trend.
The average number of casualties per 1,000 fires is 10. This indicator was the highest - 125 in 2010, and the lowest 0 in 2002. The trend for casualties per 1,000 fire incidents is constant. Compared to the New Jersey value the number of casualties per 1,000 fire incidents is higher.
According to the reports from the years 2002 - 2018 the average number of fire-related yearly casualties is 1. The highest number of injuries - 11 took place in 2010, and the lowest - 0 in 2002. The data has a constant trend.
The average number of casualties per 1,000 fires is 10. This indicator was the highest - 125 in 2010, and the lowest 0 in 2002. The trend for casualties per 1,000 fire incidents is constant. Compared to the New Jersey value the number of casualties per 1,000 fire incidents is higher.Casualties per 1,000 incidents in Bellmawr, NJ compared to nearest cities:
(Note: Based on data for all years, including only cities with at least 500 fire incidents)
| Bellmawr: | 13.4 |
| Runnemede: | 0.0 |
| Haddon Heights: | 3.8 |
| Westville: | 20.4 |
| Audubon: | 6.2 |
| Barrington: | 0.0 |
| Gloucester City: | 7.4 |
| Magnolia: | 5.7 |
| Collingswood: | 13.0 |
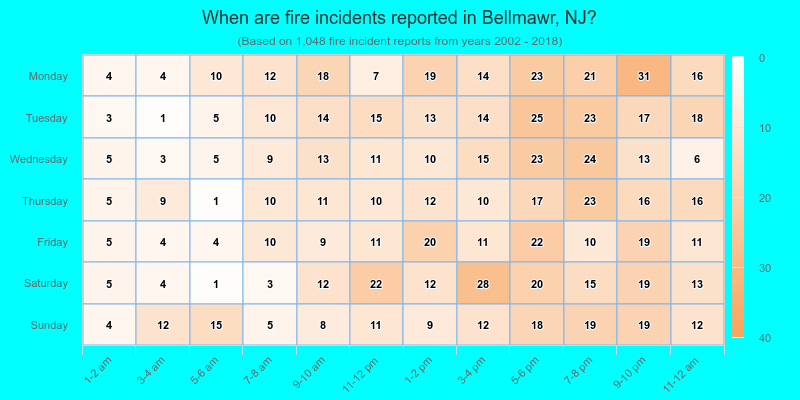
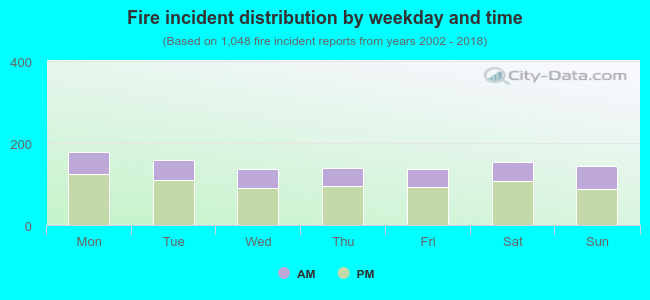 32.4% incidents where reported in the morning and 67.6% in the evening. The most fires (17.1%) took place on Monday, and the least (13.0%) on Friday.
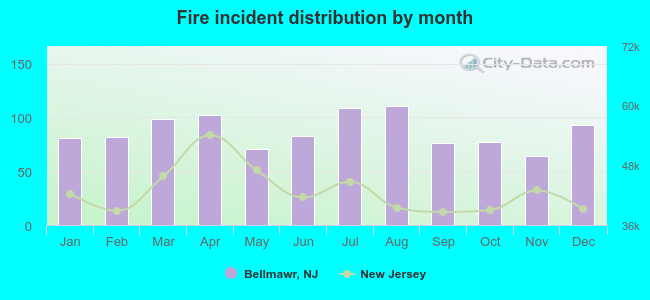 Based on the 1,048 fire incident reports from years 2002 - 2018 most fires (10.6%) took place during August, and the least (6.1%) in November.
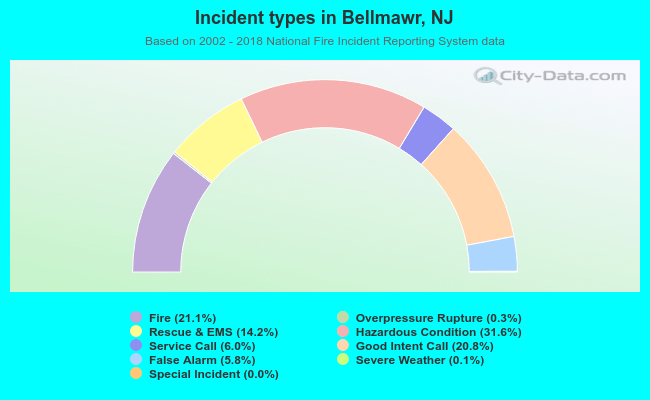 Out of all 4,957 cases reported during the years 2002 - 2018, the most belonged to the categories: Hazardous Condition (31.6%), Fire (21.1%), and Good Intent Call (20.8%).
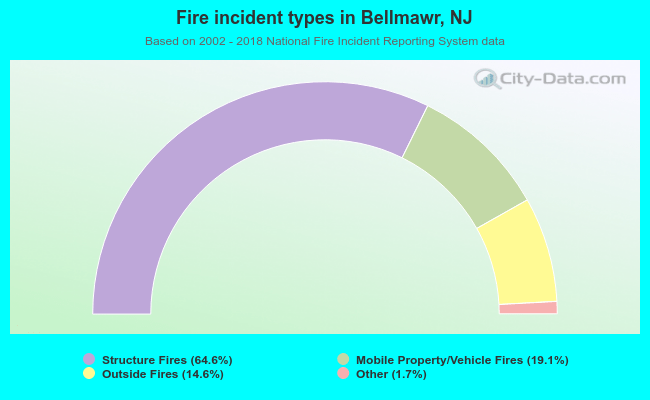 When looking into fire subcategories, the most incidents belonged to: Structure Fires (64.6%), and Mobile Property/Vehicle Fires (19.1%).