Bayport: Fire Incidents, New York (NY)
Where are fire incidents reported in Bayport, NY
Something went wrong! Please refresh the page.
|
| |||||||||||||||||||||||||||||||||||||||||||||||||||||||||||||||||||||||||||||||||||||||||||||||||||||||||||||
2004 - 2018 National Fire Incident Reporting System (NFIRS) incidents
- Incident types reported to NFIRS in Bayport, NY
- 54542.5%Rescue & EMS
- 30824.0%Hazardous Condition
- 15011.7%Fire
- 14411.2%False Alarm
- 816.3%Good Intent Call
- 463.6%Service Call
- 40.3%Severe Weather
- 40.3%Special Incident
- Fire incident types reported to NFIRS in Bayport, NY
- 7650.7%Structure Fires
- 5436.0%Outside Fires
- 117.3%Mobile Property/Vehicle Fires
- 96.0%Other
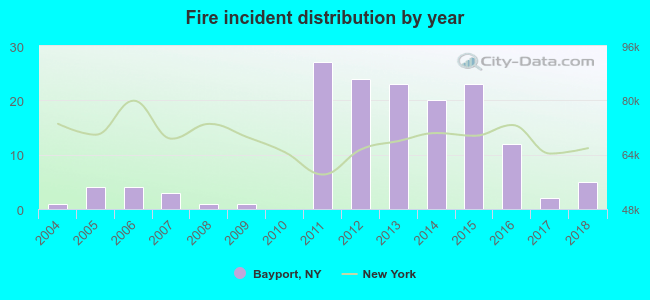 According to the data from the years 2004 - 2018 the average number of fires per year is 10. The highest number of reported fire incidents - 27 took place in 2011, and the least - 0 in 2010. The data has a growing trend.
The average number of yearly fire incidents per 10k residents in Bayport, NY compared to nearest cities:
(Note: Based on data for the last 3 years, including only cities with population 5,000 and above)
| Bayport: | 7.1 |
| Sayville: | 13.4 |
| Patchogue: | 85.5 |
| West Sayville: | 19.3 |
| North Patchogue: | 2.3 |
| Bohemia: | 32.1 |
| Holbrook: | 12.7 |
| East Patchogue: | 22.5 |
| Oakdale: | 31.4 |
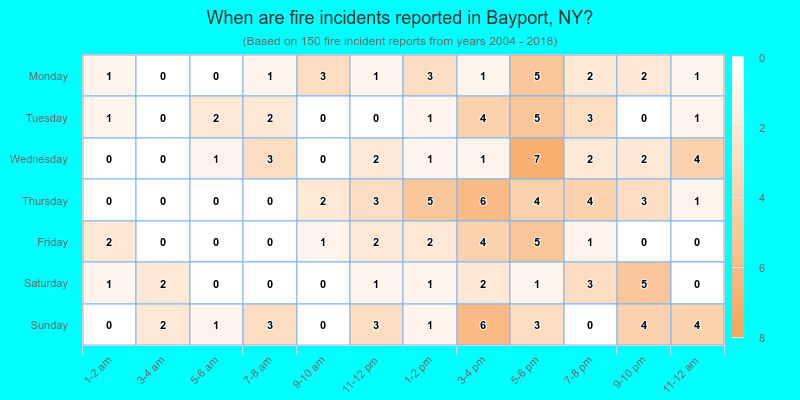
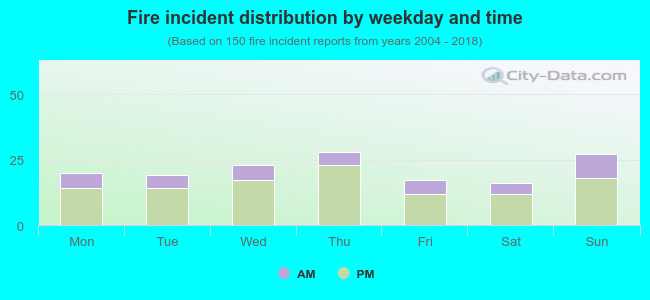 26.7% incidents where reported in the morning and 73.3% in the evening. The most fires (18.7%) took place on Thursday, and the least (10.7%) on Saturday.
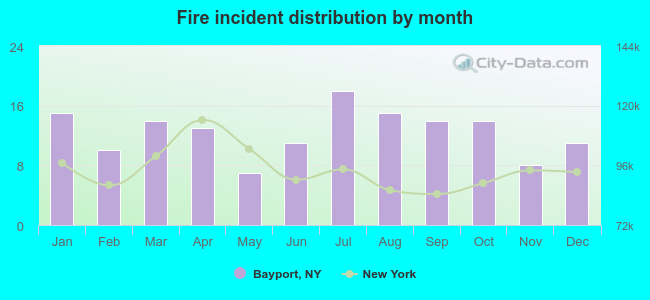 According to the 150 reports from years 2004 - 2018 most fires (12.0%) took place during July, and the least (4.7%) in May.
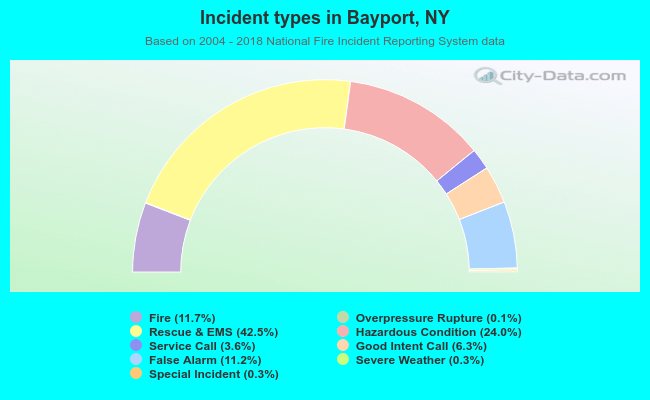 Out of all 1,283 cases reported during the years 2004 - 2018, the most belonged to the categories: Rescue & EMS (42.5%), Hazardous Condition (24.0%), and Fire (11.7%).
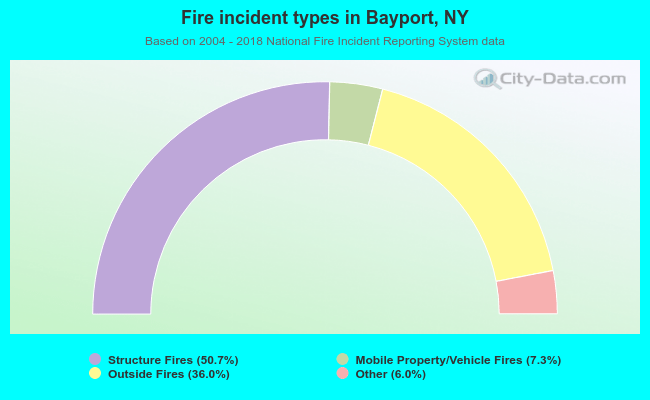 When looking into fire subcategories, the most incidents belonged to: Structure Fires (50.7%), and Outside Fires (36.0%).