Augusta: Fire Incidents, Kansas (KS)
Where are fire incidents reported in Augusta, KS
Something went wrong! Please refresh the page.
| Fire incidents reported | |
|---|---|
| Sreet name | Count |
| OHIO | 80 |
| 110TH | 78 |
| OHIO ST | 72 |
| 100TH | 70 |
| HOPKINS SWITCH | 60 |
| 120TH | 56 |
| BROADWAY | 50 |
| 170TH | 48 |
| HUNTER RD | 48 |
| HAVERHILL RD | 46 |
| THUNDER RD | 46 |
| 100TH ST | 42 |
| 130TH | 42 |
| 70TH | 42 |
| HOPKINS SWITCH RD | 42 |
| SANTA FE LAKE RD | 42 |
| 120TH ST | 38 |
| DIAMOND | 38 |
| 70TH ST | 36 |
| PURITY SPRINGS | 36 |
| 110TH ST | 34 |
| 140TH | 34 |
| 90TH | 34 |
| HAVERHILL | 34 |
| HWY 54 | 34 |
| 60TH | 32 |
| STATE | 32 |
| 80TH | 30 |
| HUNTER | 30 |
| SHUMWAY | 30 |
| Other | 1,001 |
2002 - 2018 National Fire Incident Reporting System (NFIRS) incidents
- Incident types reported to NFIRS in Augusta, KS
- 2,33755.2%Fire
- 93722.1%Hazardous Condition
- 46210.9%Good Intent Call
- 1964.6%Rescue & EMS
- 1673.9%False Alarm
- 1082.6%Service Call
- 150.4%Overpressure Rupture
- 60.1%Severe Weather
- Fire incident types reported to NFIRS in Augusta, KS
- 1,61969.3%Outside Fires
- 42118.0%Structure Fires
- 23310.0%Mobile Property/Vehicle Fires
- 642.7%Other
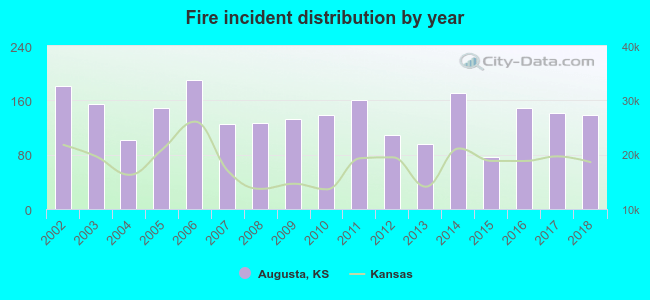 Based on the data from the years 2002 - 2018 the average number of fire incidents per year is 137. The highest number of fires - 190 took place in 2006, and the least - 77 in 2015. The data has a declining trend.
The average number of yearly fire incidents per 10k residents in Augusta, KS compared to nearest cities:
(Note: Based on data for the last 3 years, including only cities with population 5,000 and above)
| Augusta: | 154.4 |
| Andover: | 51.4 |
| El Dorado: | 87.7 |
| Bel Aire: | 17.4 |
| Derby: | 66.0 |
| Wichita: | 48.0 |
| Park City: | 41.9 |
| Mulvane: | 130.9 |
| Haysville: | 53.7 |
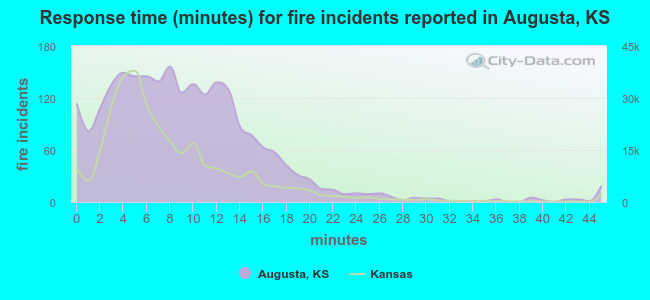 The median response time based on all reported fire incidents is 8 minutes. This is higher compared to the state median value.
The median response time in Augusta, KS compared to nearest cities:
(Note: Based on data for all years, including only cities with at least 500 fire incidents)
| Augusta: | 8 minutes |
| Andover: | 5 minutes |
| Benton: | 10 minutes |
| El Dorado: | 7 minutes |
| Rose Hill: | 7 minutes |
| Douglass: | 10 minutes |
| Derby: | 5 minutes |
| Wichita: | 4 minutes |
| Mulvane: | 7 minutes |
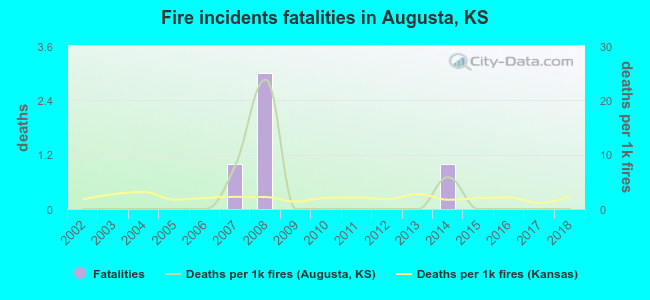 Based on the data from the years 2002 - 2018 the average number of fire-related yearly deaths is 0. The highest number of deaths - 3 took place in 2008, and the lowest - 0 in 2002. The data has a constant trend.
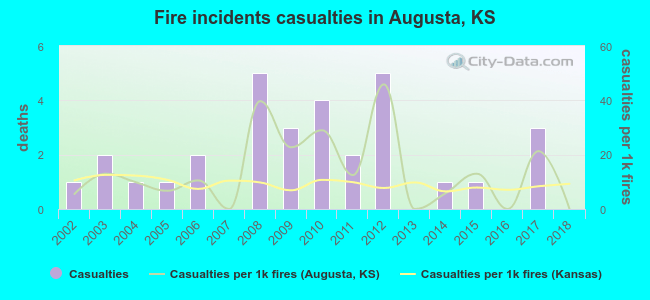 According to the data from the years 2002 - 2018 the average number of fire-related yearly casualties is 2. The highest number of casualties - 5 took place in 2008, and the lowest - 0 in 2007. The data has a decreasing trend.
The average number of casualties per 1,000 fires is 14. This indicator was the highest - 46 in 2012, and the lowest 0 in 2007. The trend for casualties per 1,000 fire incidents is dropping. Compared to the state value the number of casualties per 1,000 incidents is higher.
According to the data from the years 2002 - 2018 the average number of fire-related yearly casualties is 2. The highest number of casualties - 5 took place in 2008, and the lowest - 0 in 2007. The data has a decreasing trend.
The average number of casualties per 1,000 fires is 14. This indicator was the highest - 46 in 2012, and the lowest 0 in 2007. The trend for casualties per 1,000 fire incidents is dropping. Compared to the state value the number of casualties per 1,000 incidents is higher.
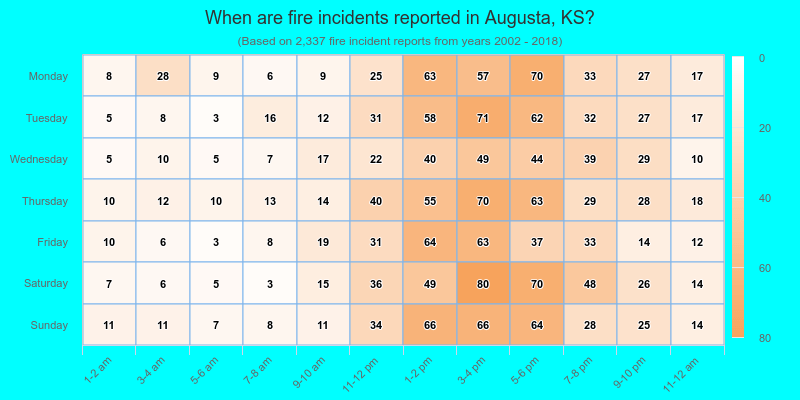
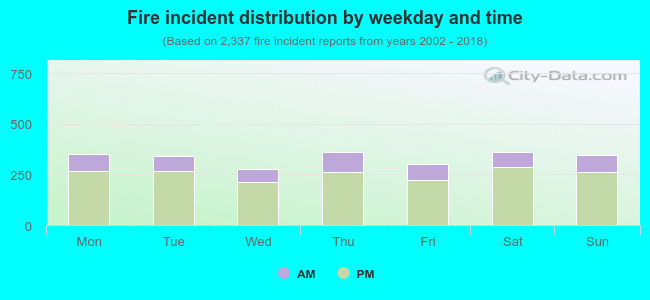 23.8% incidents where reported in the morning and 76.2% in the evening. The most fires (15.5%) took place on Thursday, and the least (11.9%) on Wednesday.
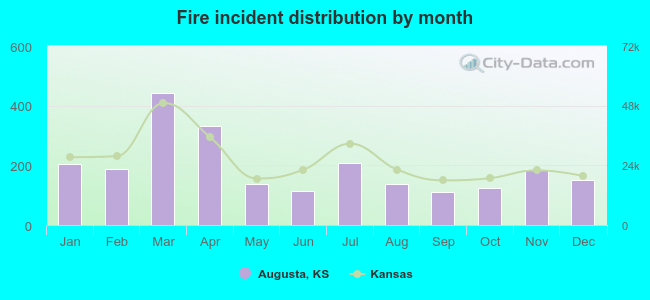 According to the 2,337 fire incidents from years 2002 - 2018 most fires (18.9%) took place during March, and the least (4.7%) in September.
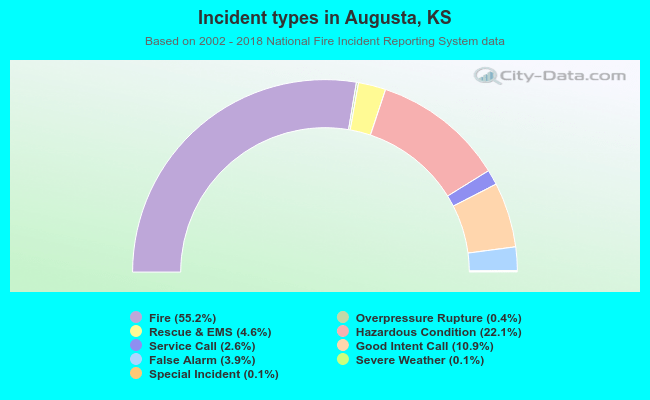 Out of all 4,231 cases reported during the years 2002 - 2018, the most belonged to the categories: Fire (55.2%), Hazardous Condition (22.1%), and Good Intent Call (10.9%).
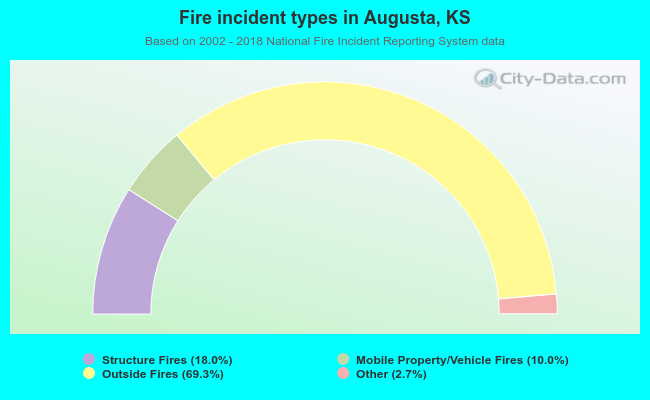 When looking into fire subcategories, the most reports belonged to: Outside Fires (69.3%), and Structure Fires (18.0%).