Auburndale: Fire Incidents, Florida (FL)
Where are fire incidents reported in Auburndale, FL
Something went wrong! Please refresh the page.
| Fire incidents reported | |
|---|---|
| Sreet name | Count |
| 92 HWY | 242 |
| BERKLEY RD | 128 |
| HAVENDALE BLVD | 122 |
| OLD DIXIE HWY | 106 |
| BRIDGERS AVE | 78 |
| ARIANA BLVD | 58 |
| 559 HWY | 54 |
| RECKER HWY | 50 |
| THORNHILL RD | 48 |
| DERBY AVE | 44 |
| HOBBS RD | 40 |
| 42ND ST | 38 |
| BENNETT ST | 38 |
| DAIRY RD | 38 |
| POLK PKY | 38 |
| MAIN ST | 36 |
| K VILLE AVE | 32 |
| MOSS RD | 32 |
| ORANGE ST | 32 |
| ELLIE RD | 30 |
| SENATE ST | 28 |
| TOWER MANOR CIR | 28 |
| DIXIE HWY | 26 |
| HILLCREST RD | 26 |
| JERSEY RD | 26 |
| KVILLE AVE | 26 |
| 1ST AVE | 24 |
| HICKORY RD | 24 |
| DENTON RD | 22 |
| MC KEAN ST | 22 |
| Other | 445 |
2002 - 2018 National Fire Incident Reporting System (NFIRS) incidents
- Incident types reported to NFIRS in Auburndale, FL
- 14,87462.7%Rescue & EMS
- 3,30113.9%Good Intent Call
- 1,9818.3%Fire
- 1,7247.3%Service Call
- 1,2815.4%Hazardous Condition
- 5292.2%False Alarm
- Fire incident types reported to NFIRS in Auburndale, FL
- 91346.1%Structure Fires
- 67434.0%Outside Fires
- 36418.4%Mobile Property/Vehicle Fires
- 301.5%Other
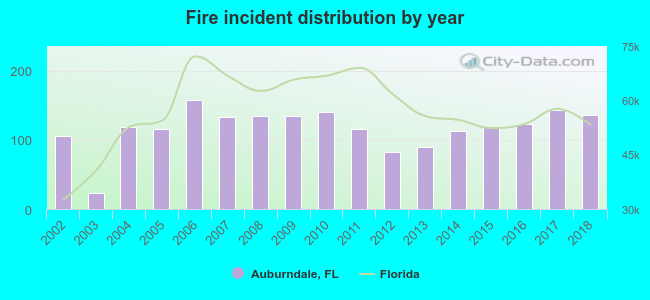 Based on the data from the years 2002 - 2018 the average number of fire incidents per year is 117. The highest number of reported fires - 157 took place in 2006, and the least - 23 in 2003. The data has a growing trend.
The average number of yearly fire incidents per 10k residents in Auburndale, FL compared to nearest cities:
(Note: Based on data for the last 3 years, including only cities with population 5,000 and above)
| Auburndale: | 92.3 |
| Lake Alfred: | 43.8 |
| Winter Haven: | 100.1 |
| Wahneta: | 5.9 |
| Highland City: | 0.9 |
| Lakeland: | 72.9 |
| Haines City: | 85.2 |
| Bartow: | 82.0 |
| Kathleen: | 1.6 |
 The median response time based on all reported fire incidents is 6 minutes. This is close to the state median value.
The median response time in Auburndale, FL compared to nearest cities:
(Note: Based on data for all years, including only cities with at least 500 fire incidents)
| Auburndale: | 6 minutes |
| Lake Alfred: | 5 minutes |
| Winter Haven: | 8 minutes |
| Polk City: | 11 minutes |
| Lakeland: | 8 minutes |
| Haines City: | 8 minutes |
| Bartow: | 8 minutes |
| Davenport: | 9 minutes |
| Mulberry: | 9 minutes |
 According to the data from the years 2002 - 2018 the average number of fire-related yearly deaths is 1. The highest number of reported deaths - 4 took place in 2008, and the lowest - 0 in 2002. The data has a constant trend.
 According to the data from the years 2002 - 2018 the average number of fire-related yearly casualties is 1. The highest number of reported casualties - 2 took place in 2011, and the lowest - 0 in 2002. The data has a growing trend.
The average number of casualties per 1,000 fires is 5. This indicator was the highest - 18 in 2014, and the lowest 0 in 2002. The trend for casualties per 1,000 fires is increasing. Compared to the Florida value the number of injuries per 1,000 fire incidents is much lower.
According to the data from the years 2002 - 2018 the average number of fire-related yearly casualties is 1. The highest number of reported casualties - 2 took place in 2011, and the lowest - 0 in 2002. The data has a growing trend.
The average number of casualties per 1,000 fires is 5. This indicator was the highest - 18 in 2014, and the lowest 0 in 2002. The trend for casualties per 1,000 fires is increasing. Compared to the Florida value the number of injuries per 1,000 fire incidents is much lower.Casualties per 1,000 incidents in Auburndale, FL compared to nearest cities:
(Note: Based on data for all years, including only cities with at least 500 fire incidents)
| Auburndale: | 5.6 |
| Lake Alfred: | 5.2 |
| Winter Haven: | 6.2 |
| Polk City: | 4.9 |
| Lakeland: | 17.2 |
| Haines City: | 5.3 |
| Bartow: | 9.0 |
| Davenport: | 4.7 |
| Mulberry: | 7.0 |
 33.4% incidents where reported in the morning and 66.6% in the evening. The most fires (15.3%) took place on Monday, and the least (13.4%) on Wednesday.
 Based on the 1,981 fires from years 2002 - 2018 most fires (10.9%) took place during March, and the least (5.4%) in August.
 Out of all 23,728 cases reported during the years 2002 - 2018, the most belonged to the categories: Rescue & EMS (62.7%), Good Intent Call (13.9%), and Fire (8.3%).
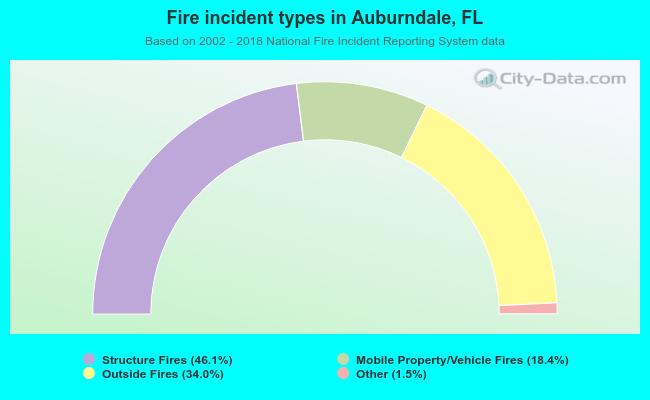 When looking into fire subcategories, the most reports belonged to: Structure Fires (46.1%), and Outside Fires (34.0%).