Auburn: Fire Incidents, Massachusetts (MA)
Where are fire incidents reported in Auburn, MA
Something went wrong! Please refresh the page.
| Fire incidents reported | |
|---|---|
| Sreet name | Count |
| SOUTHBRIDGE ST | 360 |
| WASHINGTON ST | 154 |
| AUBURN ST | 92 |
| OXFORD ST | 60 |
| ROCHDALE ST | 48 |
| LEICESTER ST | 40 |
| SOUTH ST | 40 |
| CENTRAL ST | 34 |
| PAKACHOAG ST | 34 |
| HARDSCRABBLE RD | 30 |
| MILLBURY ST | 26 |
| MASS PIKE | 24 |
| SUNRISE AVE | 24 |
| WEST ST | 22 |
| HAMPTON ST | 20 |
| BRYN MAWR AVE | 18 |
| SWORD ST | 18 |
| PINEHURST AVE | 16 |
| WALLACE AVE | 16 |
| BANCROFT ST | 14 |
| BRIARCLIFF DR | 14 |
| CEMETARY RD | 14 |
| CURTIS ST | 14 |
| INTERSTATE 90 | 14 |
| JEROME AVE | 14 |
| WATERMAN RD | 14 |
| CHURCH ST | 12 |
| ELM ST | 12 |
| SOUTHBRIDGE ST | 12 |
| BOYCE ST | 10 |
2002 - 2018 National Fire Incident Reporting System (NFIRS) incidents
- Incident types reported to NFIRS in Auburn, MA
- 12,98460.4%Rescue & EMS
- 3,06514.3%Hazardous Condition
- 1,5447.2%False Alarm
- 1,3416.2%Service Call
- 1,2695.9%Good Intent Call
- 1,2195.7%Fire
- 640.3%Special Incident
- Fire incident types reported to NFIRS in Auburn, MA
- 47639.0%Structure Fires
- 39032.0%Outside Fires
- 30424.9%Mobile Property/Vehicle Fires
- 494.0%Other
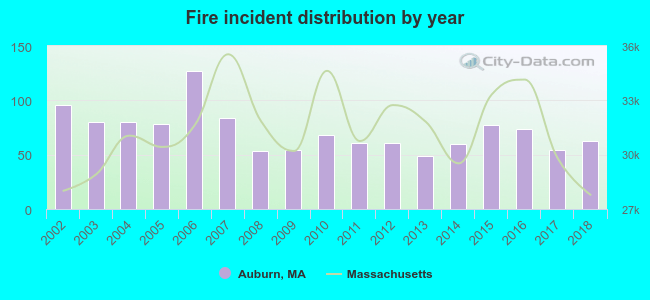 According to the data from the years 2002 - 2018 the average number of fire incidents per year is 72. The highest number of reported fire incidents - 127 took place in 2006, and the least - 49 in 2013. The data has a decreasing trend.
The average number of yearly fire incidents per 10k residents in Auburn, MA compared to nearest cities:
(Note: Based on data for the last 3 years, including only cities with population 5,000 and above)
| Auburn: | 39.3 |
| Millbury: | 51.5 |
| Leicester: | 33.7 |
| Worcester: | 74.5 |
| Oxford: | 162.8 |
| Sutton: | 44.3 |
| Grafton: | 8.1 |
| Shrewsbury: | 35.5 |
| Charlton: | 51.9 |
 The median response time based on all reported fire incidents is 4 minutes. This is close to the state median value.
The median response time in Auburn, MA compared to nearest cities:
(Note: Based on data for all years, including only cities with at least 500 fire incidents)
| Auburn: | 4 minutes |
| Millbury: | 6 minutes |
| Leicester: | 5 minutes |
| Worcester: | 4 minutes |
| Oxford: | 8 minutes |
| Sutton: | 8 minutes |
| Shrewsbury: | 4 minutes |
| Charlton: | 8 minutes |
| Spencer: | 7 minutes |
 According to the data from the years 2002 - 2018 the average number of fire-related yearly casualties is 0. The highest number of reported casualties - 1 took place in 2003, and the lowest - 0 in 2002. The data has a constant trend.
The average number of casualties per 1,000 fires is 2. This indicator was the highest - 14 in 2016, and the lowest 0 in 2002. The trend for injuries per 1,000 incidents is constant. Compared to the state value the number of casualties per 1,000 fires is much lower.
According to the data from the years 2002 - 2018 the average number of fire-related yearly casualties is 0. The highest number of reported casualties - 1 took place in 2003, and the lowest - 0 in 2002. The data has a constant trend.
The average number of casualties per 1,000 fires is 2. This indicator was the highest - 14 in 2016, and the lowest 0 in 2002. The trend for injuries per 1,000 incidents is constant. Compared to the state value the number of casualties per 1,000 fires is much lower.
 33.7% incidents where reported in the morning and 66.3% in the evening. The most fires (17.5%) took place on Thursday, and the least (12.7%) on Sunday.
 Based on the 1,219 incident reports from years 2002 - 2018 most fires (15.5%) took place during April, and the least (4.8%) in October.
 Out of all 21,499 cases reported during the years 2002 - 2018, the most belonged to the categories: Rescue & EMS (60.4%), Hazardous Condition (14.3%), and False Alarm (7.2%).
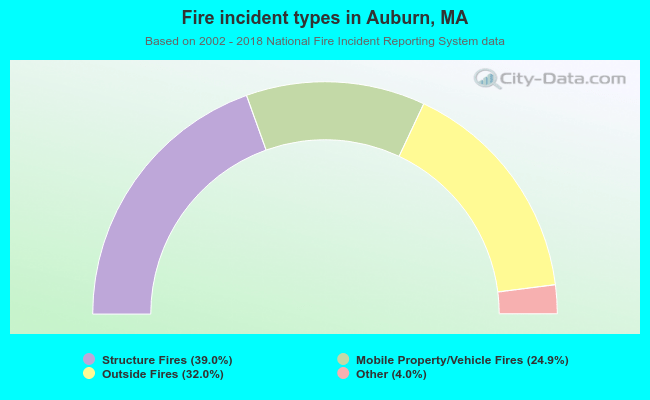 When looking into fire subcategories, the most reports belonged to: Structure Fires (39.0%), and Outside Fires (32.0%).