Auburn: Fire Incidents, Indiana (IN)
Where are fire incidents reported in Auburn, IN
Something went wrong! Please refresh the page.
|
| |||||||||||||||||||||||||||||||||||||||||||||||||||||||||||||||||||||||||||||||||||||||||||||||||||||||||||||
| Other | 149 | |||||||||||||||||||||||||||||||||||||||||||||||||||||||||||||||||||||||||||||||||||||||||||||||||||||||||||||
2002 - 2018 National Fire Incident Reporting System (NFIRS) incidents
- Incident types reported to NFIRS in Auburn, IN
- 1,35932.9%Rescue & EMS
- 85720.7%Hazardous Condition
- 85520.7%Fire
- 48211.7%Service Call
- 3328.0%False Alarm
- 1814.4%Good Intent Call
- 631.5%Special Incident
- 60.1%Overpressure Rupture
- Fire incident types reported to NFIRS in Auburn, IN
- 35942.0%Structure Fires
- 30435.6%Outside Fires
- 14116.5%Mobile Property/Vehicle Fires
- 516.0%Other
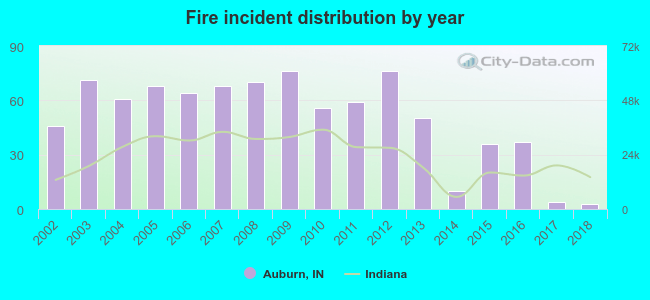 According to the data from the years 2002 - 2018 the average number of fires per year is 50. The highest number of reported fire incidents - 76 took place in 2009, and the least - 3 in 2018. The data has a decreasing trend.
The average number of yearly fire incidents per 10k residents in Auburn, IN compared to nearest cities:
(Note: Based on data for the last 3 years, including only cities with population 5,000 and above)
| Auburn: | 11.4 |
| Garrett: | 15.8 |
| Huntertown: | 16.8 |
| Kendallville: | 12.6 |
| Angola: | 12.4 |
| Fort Wayne: | 23.1 |
| New Haven: | 20.8 |
| Columbia City: | 56.6 |
| Decatur: | 33.9 |
 The median response time based on all reported fire incidents is 4 minutes. This is lower compared to the state median value.
The median response time in Auburn, IN compared to nearest cities:
(Note: Based on data for all years, including only cities with at least 500 fire incidents)
| Auburn: | 4 minutes |
| Butler: | 10 minutes |
| Kendallville: | 4 minutes |
| Angola: | 8 minutes |
| Albion: | 10 minutes |
| Fort Wayne: | 5 minutes |
| New Haven: | 5 minutes |
| Fremont: | 8 minutes |
| Columbia City: | 7 minutes |
 30.1% incidents where reported in the morning and 69.9% in the evening. The most fires (16.5%) took place on Monday, and the least (13.0%) on Friday.
 According to the 855 reports from years 2002 - 2018 most fires (12.6%) took place during April, and the least (6.3%) in September.
 Out of all 4,136 cases reported during the years 2002 - 2018, the most belonged to the categories: Rescue & EMS (32.9%), Hazardous Condition (20.7%), and Fire (20.7%).
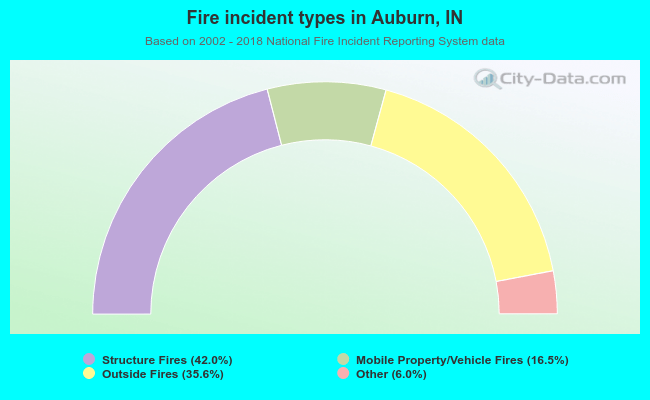 When looking into fire subcategories, the most incidents belonged to: Structure Fires (42.0%), and Outside Fires (35.6%).