Ashland: Fire Incidents, Ohio (OH)
Where are fire incidents reported in Ashland, OH
Something went wrong! Please refresh the page.
| Fire incidents reported | |
|---|---|
| Sreet name | Count |
| MAIN ST | 206 |
| CLAREMONT AVE | 104 |
| CENTER ST | 92 |
| CLEVELAND AVE | 50 |
| ORANGE RD | 48 |
| I 71 | 44 |
| COTTAGE ST | 42 |
| INTERSTATE 71 | 40 |
| ORANGE ST | 40 |
| WALNUT ST | 40 |
| COLLEGE AVE | 38 |
| SR 58 HWY | 32 |
| SANDUSKY ST | 30 |
| STATE ROUTE 96 | 30 |
| STATE RT 42 | 30 |
| BANEY RD | 28 |
| CR 30A | 28 |
| SR 302 HWY | 28 |
| STATE ROUTE 302 | 28 |
| 4TH ST | 26 |
| SAMARITAN AVE | 26 |
| 10TH ST | 24 |
| TROY RD | 24 |
| LIBERTY ST | 20 |
| MIFFLIN AVE | 20 |
| MONTGOMERY TWP RD 655 | 20 |
| OHIO ST | 20 |
| SR 511 HWY | 20 |
| SR 603 | 20 |
| STATE ROUTE 545 | 20 |
| Other | 1,097 |
2002 - 2018 National Fire Incident Reporting System (NFIRS) incidents
- Incident types reported to NFIRS in Ashland, OH
- 7,49052.4%Rescue & EMS
- 2,31516.2%Fire
- 1,59011.1%Hazardous Condition
- 1,1037.7%Good Intent Call
- 1,0847.6%Service Call
- 6524.6%False Alarm
- 270.2%Overpressure Rupture
- 170.1%Severe Weather
- Fire incident types reported to NFIRS in Ashland, OH
- 1,27755.2%Structure Fires
- 59225.6%Outside Fires
- 41918.1%Mobile Property/Vehicle Fires
- 271.2%Other
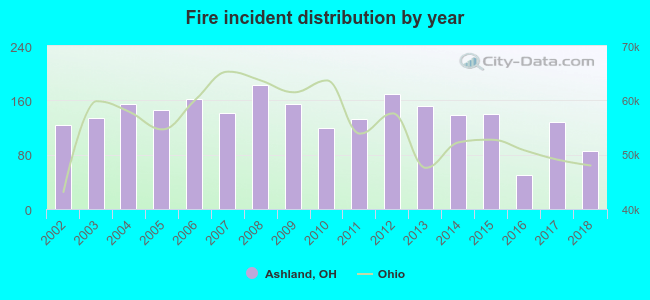 Based on the data from the years 2002 - 2018 the average number of fire incidents per year is 136. The highest number of reported fire incidents - 183 took place in 2008, and the least - 50 in 2016. The data has a declining trend.
The average number of yearly fire incidents per 10k residents in Ashland, OH compared to nearest cities:
(Note: Based on data for the last 3 years, including only cities with population 5,000 and above)
| Ashland: | 43.4 |
| Mansfield: | 83.5 |
| Ontario: | 34.8 |
| Shelby: | 62.4 |
| Wooster: | 43.3 |
| Willard: | 78.2 |
| Galion: | 54.7 |
| Orrville: | 74.5 |
| Rittman: | 43.2 |
 The median response time based on all reported fire incidents is 7 minutes. This is comparable to the state median value.
The median response time in Ashland, OH compared to nearest cities:
(Note: Based on data for all years, including only cities with at least 500 fire incidents)
| Ashland: | 7 minutes |
| West Salem: | 12 minutes |
| Mansfield: | 4 minutes |
| Shelby: | 5 minutes |
| Lexington: | 10 minutes |
| Wooster: | 7 minutes |
| Wellington: | 8 minutes |
| Crestline: | 7 minutes |
| Willard: | 7 minutes |
 According to the data from the years 2002 - 2018 the average number of fire-related yearly casualties is 1. The highest number of reported casualties - 5 took place in 2008, and the lowest - 0 in 2002. The data has a constant trend.
The average number of casualties per 1,000 fire incidents is 6. This indicator was the highest - 27 in 2008, and the lowest 0 in 2002. The trend for injuries per 1,000 incidents is constant. Compared to the state value the number of casualties per 1,000 incidents is lower.
According to the data from the years 2002 - 2018 the average number of fire-related yearly casualties is 1. The highest number of reported casualties - 5 took place in 2008, and the lowest - 0 in 2002. The data has a constant trend.
The average number of casualties per 1,000 fire incidents is 6. This indicator was the highest - 27 in 2008, and the lowest 0 in 2002. The trend for injuries per 1,000 incidents is constant. Compared to the state value the number of casualties per 1,000 incidents is lower.Casualties per 1,000 incidents in Ashland, OH compared to nearest cities:
(Note: Based on data for all years, including only cities with at least 500 fire incidents)
| Ashland: | 7.3 |
| West Salem: | 1.4 |
| Mansfield: | 24.7 |
| Shelby: | 18.9 |
| Lexington: | 2.3 |
| Wooster: | 16.1 |
| Wellington: | 33.6 |
| Crestline: | 33.8 |
| Willard: | 19.5 |
 31.7% incidents where reported in the morning and 68.3% in the evening. The most fires (15.3%) took place on Friday, and the least (13.0%) on Tuesday.
 According to the 2,315 fire incidents from years 2002 - 2018 most fires (12.2%) took place during April, and the least (6.3%) in September.
 Out of all 14,283 cases reported during the years 2002 - 2018, the most belonged to the categories: Rescue & EMS (52.4%), Fire (16.2%), and Hazardous Condition (11.1%).
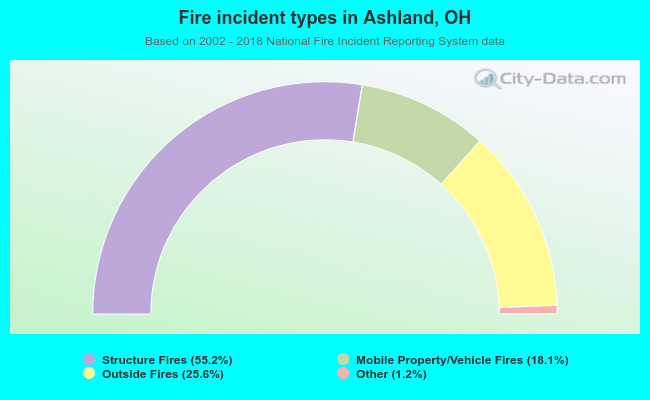 When looking into fire subcategories, the most incidents belonged to: Structure Fires (55.2%), and Outside Fires (25.6%).