Armuchee: Fire Incidents, Georgia (GA)
Where are fire incidents reported in Armuchee, GA
Something went wrong! Please refresh the page.
|
| |||||||||||||||||||||||||||||||||||||||||||||||||||||||||||||||||||||||||||||||||||||||||||||||||||||||||||||
2005 - 2018 National Fire Incident Reporting System (NFIRS) incidents
- Incident types reported to NFIRS in Armuchee, GA
- 30528.9%Fire
- 28627.1%Rescue & EMS
- 21620.5%Hazardous Condition
- 12812.1%Good Intent Call
- 898.4%Service Call
- 262.5%False Alarm
- 30.3%Overpressure Rupture
- Fire incident types reported to NFIRS in Armuchee, GA
- 19463.6%Outside Fires
- 7123.3%Structure Fires
- 3912.8%Mobile Property/Vehicle Fires
- 10.3%Other
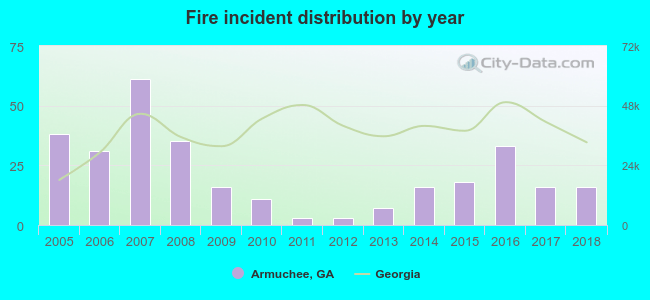 Based on the data from the years 2005 - 2018 the average number of fires per year is 22. The highest number of fires - 61 took place in 2007, and the least - 3 in 2011. The data has a decreasing trend.
The average number of yearly fire incidents per 10k residents in Armuchee, GA compared to nearest cities:
(Note: Based on data for the last 3 years, including only cities with population 5,000 and above)
| Armuchee: | 22.1 |
| Rome: | 120.7 |
| Calhoun: | 39.7 |
| La Fayette: | 11.2 |
| Cartersville: | 188.9 |
| Cedartown: | 110.4 |
| Dalton: | 101.5 |
| Acworth: | 85.7 |
| Dallas: | 203.0 |
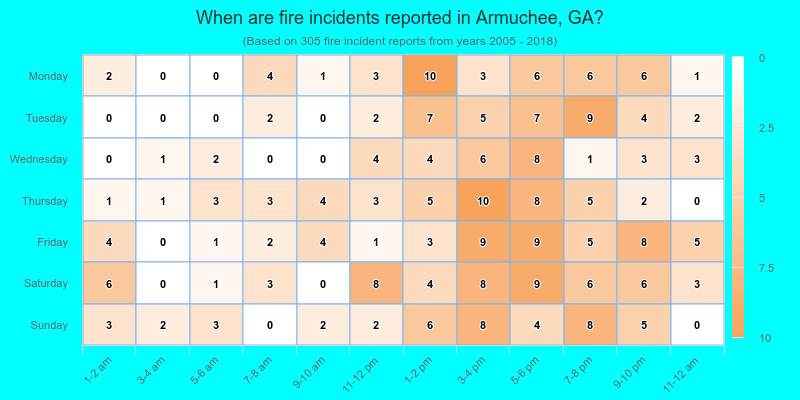
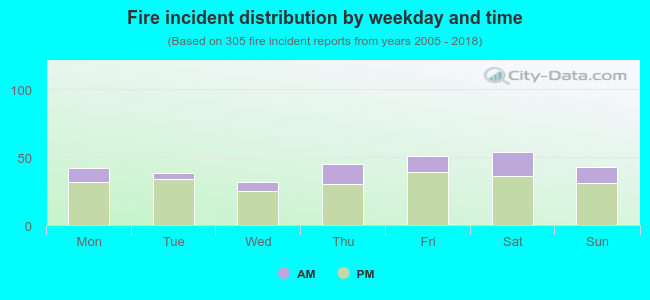 25.6% incidents where reported in the morning and 74.4% in the evening. The most fires (17.7%) took place on Saturday, and the least (10.5%) on Wednesday.
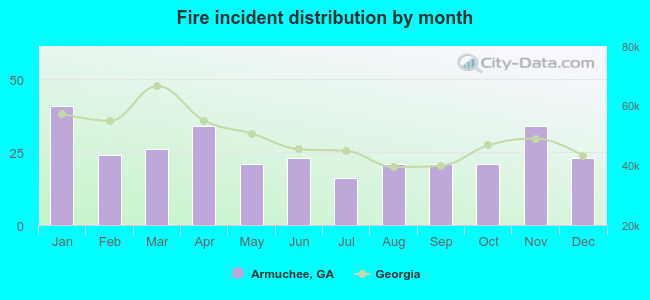 According to the 305 fire incident reports from years 2005 - 2018 most fires (13.4%) took place during January, and the least (5.2%) in July.
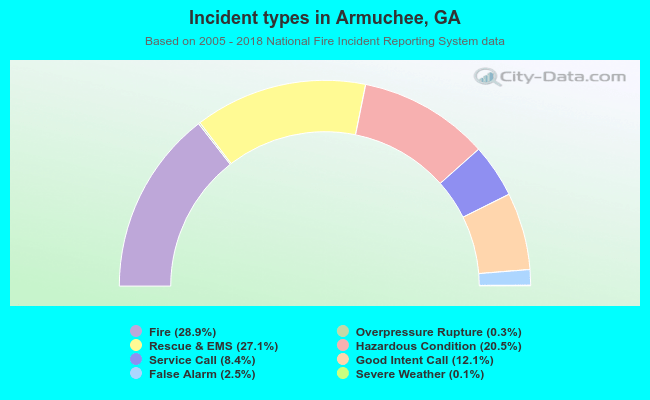 Out of all 1,054 cases reported during the years 2005 - 2018, the most belonged to the categories: Fire (28.9%), Rescue & EMS (27.1%), and Hazardous Condition (20.5%).
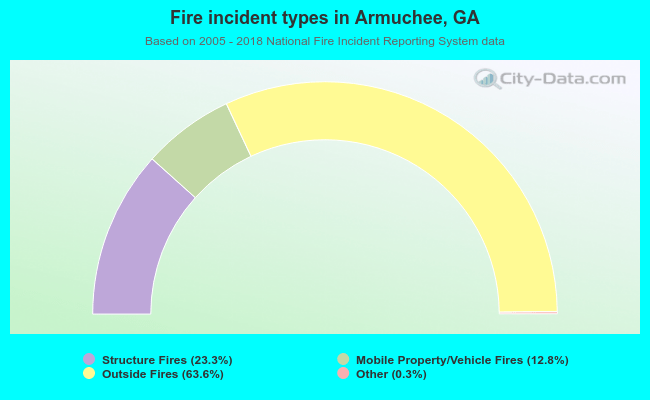 When looking into fire subcategories, the most incidents belonged to: Outside Fires (63.6%), and Structure Fires (23.3%).