Arden Hills: Fire Incidents, Minnesota (MN)
Where are fire incidents reported in Arden Hills, MN
Something went wrong! Please refresh the page.
|
| |||||||||||||||||||||||||||||||||||||||||||||||||||||||||||||||||||||||||||||||||||||||||||||||||||||||||||||
2002 - 2018 National Fire Incident Reporting System (NFIRS) incidents
- Incident types reported to NFIRS in Arden Hills, MN
- 2,66456.8%Rescue & EMS
- 58012.4%Good Intent Call
- 55111.8%Hazardous Condition
- 4168.9%Fire
- 3577.6%False Alarm
- 1092.3%Service Call
- 50.1%Overpressure Rupture
- 50.1%Special Incident
- Fire incident types reported to NFIRS in Arden Hills, MN
- 18544.5%Structure Fires
- 12028.8%Outside Fires
- 10725.7%Mobile Property/Vehicle Fires
- 41.0%Other
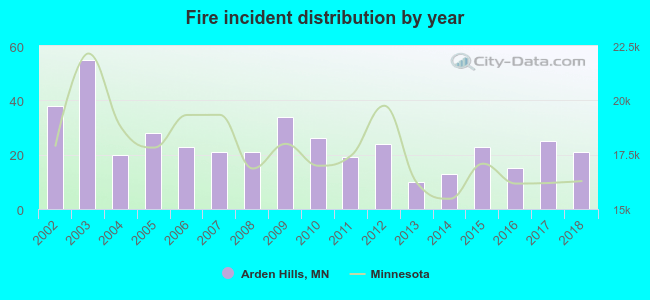 According to the data from the years 2002 - 2018 the average number of fires per year is 24. The highest number of reported fire incidents - 55 took place in 2003, and the least - 10 in 2013. The data has a decreasing trend.
The average number of yearly fire incidents per 10k residents in Arden Hills, MN compared to nearest cities:
(Note: Based on data for the last 3 years, including only cities with population 5,000 and above)
| Arden Hills: | 20.6 |
| New Brighton: | 30.8 |
| Shoreview: | 11.8 |
| Roseville: | 26.0 |
| Columbia Heights: | 33.0 |
| Mounds View: | 19.2 |
| Little Canada: | 43.0 |
| Vadnais Heights: | 27.4 |
| Falcon Heights: | 23.6 |

 Based on the data from the years 2002 - 2018 the average number of fire-related yearly casualties is 0. The highest number of injuries - 1 took place in 2005, and the lowest - 0 in 2002. The data has a constant trend.
 36.5% incidents where reported in the morning and 63.5% in the evening. The most fires (17.8%) took place on Friday, and the least (11.5%) on Monday.
 According to the 416 incident reports from years 2002 - 2018 most fires (14.2%) took place during April, and the least (4.6%) in January.
 Out of all 4,688 cases reported during the years 2002 - 2018, the most belonged to the categories: Rescue & EMS (56.8%), Good Intent Call (12.4%), and Hazardous Condition (11.8%).
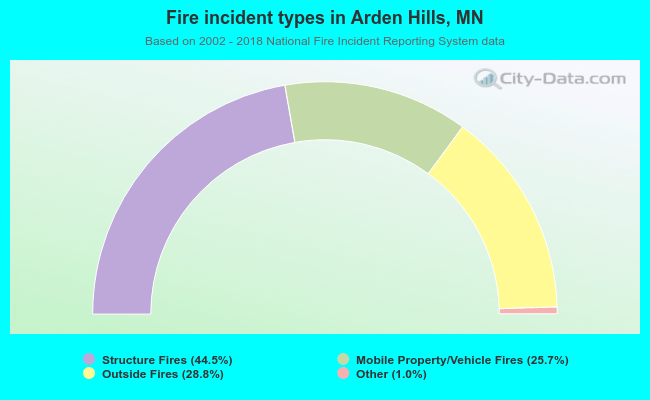 When looking into fire subcategories, the most incidents belonged to: Structure Fires (44.5%), and Outside Fires (28.8%).