Anderson: Fire Incidents, South Carolina (SC)
Where are fire incidents reported in Anderson, SC
Something went wrong! Please refresh the page.
| Fire incidents reported | |
|---|---|
| Sreet name | Count |
| MAIN ST | 326 |
| CLEMSON BLVD | 216 |
| WHITNER ST | 186 |
| INTERSTATE 85 | 170 |
| HIGHWAY 29 | 168 |
| GREENVILLE ST | 154 |
| HIGHWAY 81 | 136 |
| WILLIAMSTON RD | 130 |
| AIRLINE RD | 124 |
| PEARMAN DAIRY RD | 120 |
| ABBEVILLE HWY | 114 |
| MIRACLE MILE DR | 114 |
| RIVER ST | 112 |
| FANT ST | 110 |
| HIGHWAY 24 | 104 |
| MARKET ST | 100 |
| WHITEHALL RD | 98 |
| GLENN ST | 88 |
| LIBERTY HWY | 84 |
| FRANKLIN ST | 82 |
| MASTERS BLVD | 82 |
| CONCORD RD | 80 |
| BROADWAY LAKE RD | 74 |
| JACKSON ST | 74 |
| SHOCKLEY FERRY RD | 72 |
| AMITY RD | 70 |
| CENTERVILLE RD | 70 |
| MAULDIN ST | 70 |
| MURRAY AVE | 70 |
| DOBBINS BRIDGE RD | 68 |
| Other | 5,530 |
2002 - 2018 National Fire Incident Reporting System (NFIRS) incidents
- Incident types reported to NFIRS in Anderson, SC
- 8,99632.1%Fire
- 7,76927.7%Rescue & EMS
- 5,49019.6%Hazardous Condition
- 3,23511.5%False Alarm
- 1,5985.7%Good Intent Call
- 7692.7%Service Call
- 1020.4%Severe Weather
- 560.2%Special Incident
- Fire incident types reported to NFIRS in Anderson, SC
- 3,90943.5%Outside Fires
- 3,47538.6%Structure Fires
- 1,39215.5%Mobile Property/Vehicle Fires
- 2202.4%Other
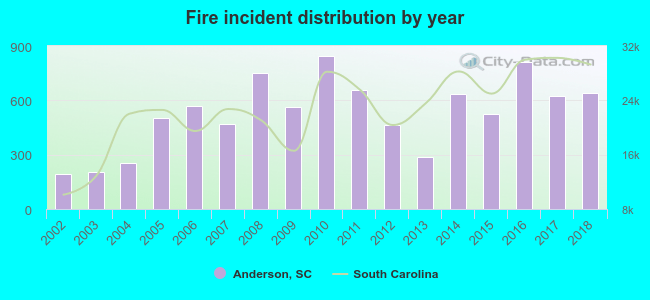 According to the data from the years 2002 - 2018 the average number of fire incidents per year is 529. The highest number of reported fire incidents - 846 took place in 2010, and the least - 194 in 2002. The data has a growing trend.
The average number of yearly fire incidents per 10k residents in Anderson, SC compared to nearest cities:
(Note: Based on data for the last 3 years, including only cities with population 5,000 and above)
| Anderson: | 254.5 |
| Homeland Park: | 192.2 |
| Centerville: | 15.2 |
| Clemson: | 40.7 |
| Central: | 54.4 |
| Piedmont: | 313.5 |
| Powderville: | 49.0 |
| Seneca: | 131.4 |
| Easley: | 102.0 |
 The median response time based on all reported fire incidents is 7 minutes. This is close to the state median value.
The median response time in Anderson, SC compared to nearest cities:
(Note: Based on data for all years, including only cities with at least 500 fire incidents)
| Anderson: | 7 minutes |
| Belton: | 6 minutes |
| Williamston: | 7 minutes |
| Pendleton: | 8 minutes |
| Pelzer: | 6 minutes |
| Iva: | 7 minutes |
| Clemson: | 6 minutes |
| Honea Path: | 5 minutes |
| Central: | 6 minutes |
 Based on the reports from the years 2002 - 2018 the average number of fire-related yearly deaths is 2. The highest number of deaths - 5 took place in 2015, and the lowest - 0 in 2003. The data has an increasing trend.
The average number of fatalities per 1,000 fire incidents is 3. This indicator was the highest - 10 in 2015, and the lowest 0 in 2003. The trend for fatalities per 1,000 fires is growing. Compared to the South Carolina value the number of fatalities per 1,000 fire incidents is higher.
Based on the reports from the years 2002 - 2018 the average number of fire-related yearly deaths is 2. The highest number of deaths - 5 took place in 2015, and the lowest - 0 in 2003. The data has an increasing trend.
The average number of fatalities per 1,000 fire incidents is 3. This indicator was the highest - 10 in 2015, and the lowest 0 in 2003. The trend for fatalities per 1,000 fires is growing. Compared to the South Carolina value the number of fatalities per 1,000 fire incidents is higher.Deaths per 1,000 incidents in Anderson, SC compared to nearest cities:
(Note: Based on data for all years, including only cities with at least 2,500 fire incidents)
| Anderson: | 3.0 |
| Easley: | 2.7 |
| Greenville: | 1.8 |
 Based on the reports from the years 2002 - 2018 the average number of fire-related yearly casualties is 5. The highest number of reported casualties - 15 took place in 2008, and the lowest - 1 in 2017. The data has a declining trend.
The average number of injuries per 1,000 fire incidents is 11. This indicator was the highest - 41 in 2002, and the lowest 2 in 2018. The trend for injuries per 1,000 fire incidents is decreasing. Compared to the South Carolina value the number of injuries per 1,000 fires is higher.
Based on the reports from the years 2002 - 2018 the average number of fire-related yearly casualties is 5. The highest number of reported casualties - 15 took place in 2008, and the lowest - 1 in 2017. The data has a declining trend.
The average number of injuries per 1,000 fire incidents is 11. This indicator was the highest - 41 in 2002, and the lowest 2 in 2018. The trend for injuries per 1,000 fire incidents is decreasing. Compared to the South Carolina value the number of injuries per 1,000 fires is higher.Casualties per 1,000 incidents in Anderson, SC compared to nearest cities:
(Note: Based on data for all years, including only cities with at least 500 fire incidents)
| Anderson: | 9.4 |
| Belton: | 2.6 |
| Williamston: | 7.7 |
| Pendleton: | 1.6 |
| Pelzer: | 1.4 |
| Iva: | 6.6 |
| Clemson: | 17.1 |
| Honea Path: | 10.6 |
| Central: | 3.3 |
 28.6% incidents where reported in the morning and 71.4% in the evening. The most fires (16.4%) took place on Saturday, and the least (12.8%) on Wednesday.
 Based on the 8,996 fires from years 2002 - 2018 most fires (10.6%) took place during March, and the least (6.8%) in December.
 Out of all 28,040 cases reported during the years 2002 - 2018, the most belonged to the categories: Fire (32.1%), Rescue & EMS (27.7%), and Hazardous Condition (19.6%).
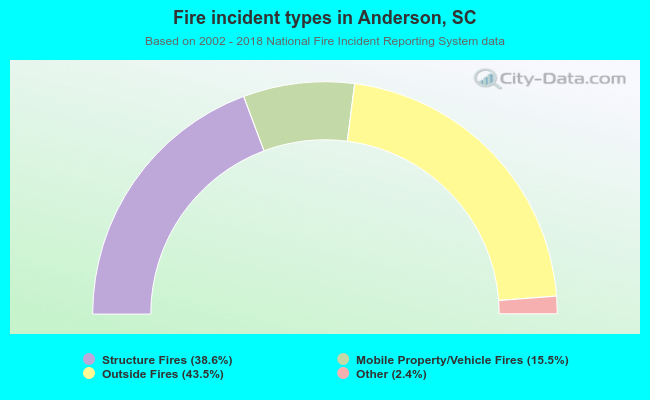 When looking into fire subcategories, the most incidents belonged to: Outside Fires (43.5%), and Structure Fires (38.6%).