Ambridge: Fire Incidents, Pennsylvania (PA)
Where are fire incidents reported in Ambridge, PA
Something went wrong! Please refresh the page.
| Fire incidents reported | |
|---|---|
| Sreet name | Count |
| MERCHANT ST | 192 |
| BEAVER RD | 188 |
| DUSS AVE | 172 |
| MAPLEWOOD AVE | 86 |
| PARK RD | 58 |
| 4TH ST | 32 |
| GLENWOOD AVE | 32 |
| CHURCH ST | 30 |
| 8TH ST | 28 |
| ECONOMY VILLAGE | 28 |
| 14TH ST | 24 |
| 15TH ST | 24 |
| CRESTVIEW VILLAGE | 22 |
| 11TH ST | 20 |
| 1ST ST | 20 |
| MELROSE AVE | 18 |
| GLENWOOD DR | 16 |
| OHIO RIVER BLVD | 16 |
| 16TH ST | 14 |
| LOCUST ST | 14 |
| OLIVE LANE | 14 |
| PINE ST | 14 |
| 12TH ST | 12 |
| CENTURY DR | 12 |
| HENRICI ST | 12 |
| 21ST ST | 10 |
| LENZ AVE | 10 |
| WALNUT ST | 10 |
| 18TH ST | 8 |
| 6TH ST | 8 |
2004 - 2018 National Fire Incident Reporting System (NFIRS) incidents
- Incident types reported to NFIRS in Ambridge, PA
- 79132.6%Hazardous Condition
- 72730.0%Fire
- 29112.0%Service Call
- 2038.4%Rescue & EMS
- 2038.4%False Alarm
- 1024.2%Special Incident
- 1014.2%Good Intent Call
- 40.2%Overpressure Rupture
- 30.1%Severe Weather
- Fire incident types reported to NFIRS in Ambridge, PA
- 50168.9%Structure Fires
- 13819.0%Outside Fires
- 456.2%Mobile Property/Vehicle Fires
- 435.9%Other
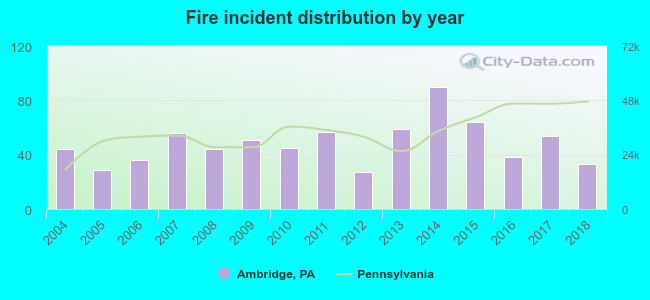 According to the data from the years 2004 - 2018 the average number of fires per year is 48. The highest number of reported fire incidents - 90 took place in 2014, and the least - 27 in 2012. The data has a decreasing trend.
The average number of yearly fire incidents per 10k residents in Ambridge, PA compared to nearest cities:
(Note: Based on data for the last 3 years, including only cities with population 5,000 and above)
| Ambridge: | 60.4 |
| Aliquippa: | 102.0 |
| Economy: | 2.2 |
| Coraopolis: | 46.8 |
| Monaca: | 45.8 |
| Franklin Park: | 0.9 |
| Kennedy Township: | 3.5 |
| Robinson Township: | 5.5 |
| New Brighton: | 100.9 |
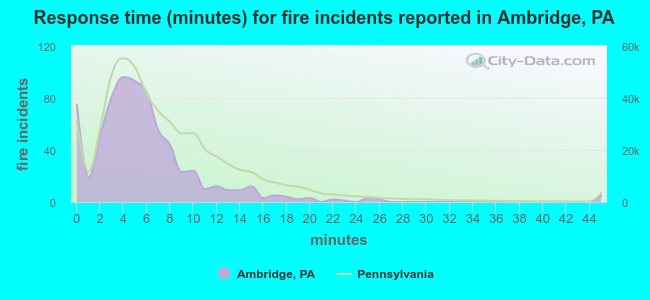 The median response time based on all reported fire incidents is 5 minutes. This is lower compared to the state median value.
The median response time in Ambridge, PA compared to nearest cities:
(Note: Based on data for all years, including only cities with at least 500 fire incidents)
| Ambridge: | 5 minutes |
| Aliquippa: | 7 minutes |
| Baden: | 8 minutes |
| Rochester: | 7 minutes |
| New Brighton: | 8 minutes |
| Beaver Falls: | 5 minutes |
| Gibsonia: | 9 minutes |
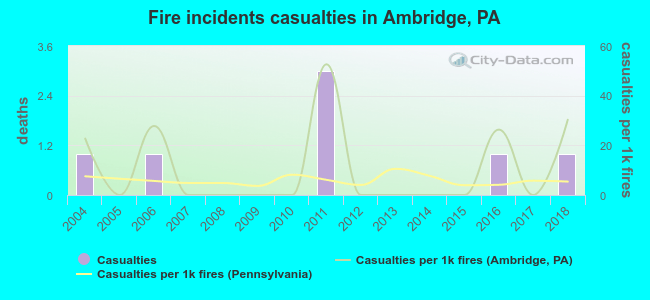 According to the reports from the years 2004 - 2018 the average number of fire-related yearly casualties is 0. The highest number of casualties - 3 took place in 2011, and the lowest - 0 in 2005. The data has a constant trend.
The average number of injuries per 1,000 fires is 11. This indicator was the highest - 53 in 2011, and the lowest 0 in 2005. The trend for injuries per 1,000 fire incidents is growing. Compared to the state value the number of injuries per 1,000 fires is higher.
According to the reports from the years 2004 - 2018 the average number of fire-related yearly casualties is 0. The highest number of casualties - 3 took place in 2011, and the lowest - 0 in 2005. The data has a constant trend.
The average number of injuries per 1,000 fires is 11. This indicator was the highest - 53 in 2011, and the lowest 0 in 2005. The trend for injuries per 1,000 fire incidents is growing. Compared to the state value the number of injuries per 1,000 fires is higher.Casualties per 1,000 incidents in Ambridge, PA compared to nearest cities:
(Note: Based on data for all years, including only cities with at least 500 fire incidents)
| Ambridge: | 9.6 |
| Aliquippa: | 7.8 |
| Baden: | 0.0 |
| Rochester: | 7.9 |
| New Brighton: | 10.9 |
| Beaver Falls: | 23.5 |
| Gibsonia: | 9.4 |
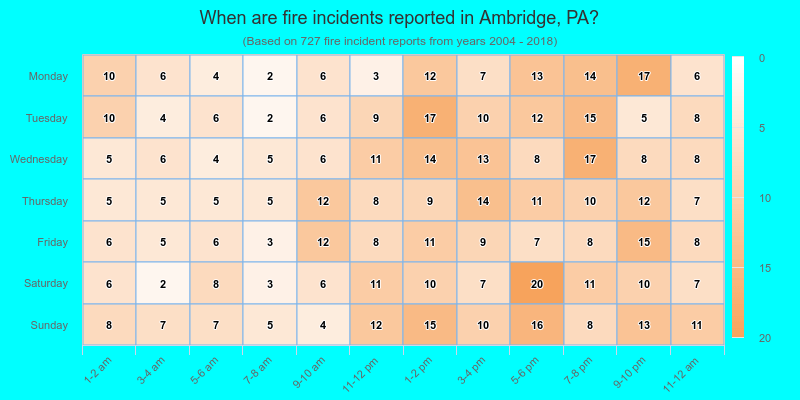
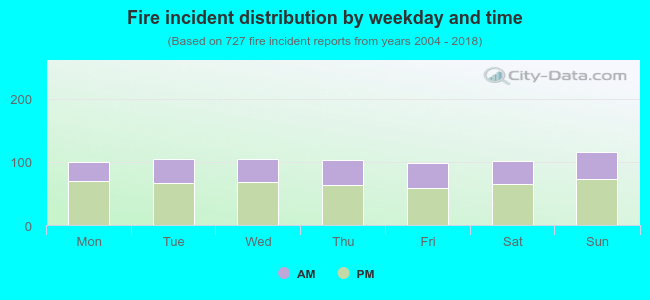 36.3% incidents where reported in the morning and 63.7% in the evening. The most fires (16.0%) took place on Sunday, and the least (13.5%) on Friday.
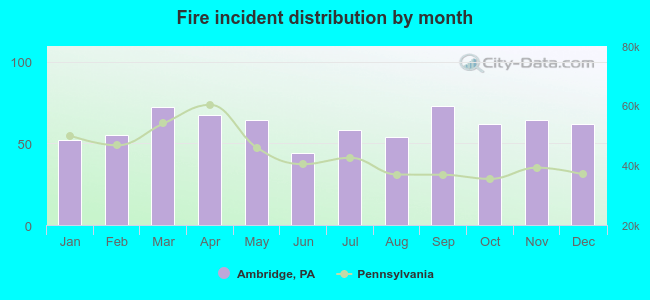 According to the 727 incident reports from years 2004 - 2018 most fires (10.0%) took place during September, and the least (6.1%) in June.
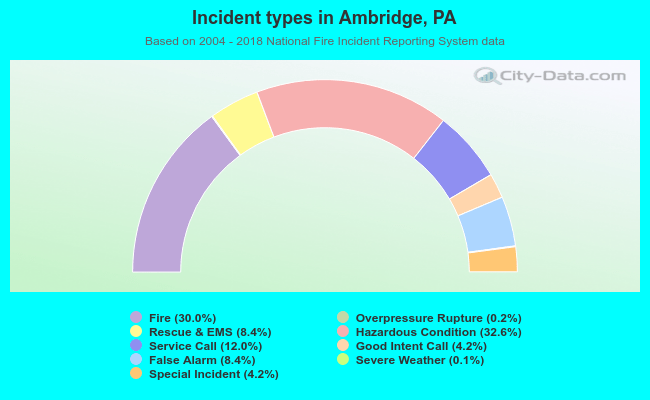 Out of all 2,425 cases reported during the years 2004 - 2018, the most belonged to the categories: Hazardous Condition (32.6%), Fire (30.0%), and Service Call (12.0%).
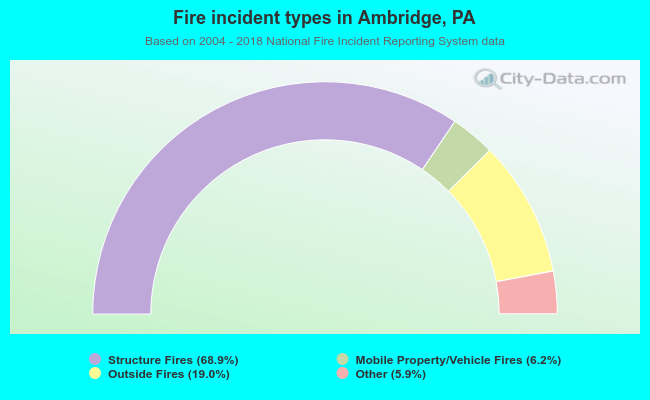 When looking into fire subcategories, the most incidents belonged to: Structure Fires (68.9%), and Outside Fires (19.0%).