Alamogordo: Fire Incidents, New Mexico (NM)
Where are fire incidents reported in Alamogordo, NM
Something went wrong! Please refresh the page.
| Fire incidents reported | |
|---|---|
| Sreet name | Count |
| SCENIC | 58 |
| WHITE SANDS BLVD | 58 |
| FLORIDA | 56 |
| WHITE SANDS | 48 |
| FIRST ST | 38 |
| MESCALERO | 36 |
| HWY 70 | 32 |
| BELLAMAH | 30 |
| FLORIDA AVE | 30 |
| INDIAN WELLS | 28 |
| HWY 82 | 26 |
| POST | 26 |
| NEW YORK AVE | 24 |
| OREGON | 24 |
| JEFFERSON | 20 |
| NEW YORK | 20 |
| PUERTO RICO | 20 |
| LINDBERG | 18 |
| TENTH ST | 18 |
| US HWY 70 | 18 |
| FIRST | 16 |
| HWY 70 WEST | 16 |
| TENTH | 16 |
| WALKER | 16 |
| ABBOTT | 14 |
| COLLINS | 14 |
| DELAWARE AVE | 14 |
| HIGHWAY 54 SOUTH HWY | 14 |
| QUAIL TRAIL | 14 |
| QUAIL TRL | 14 |
| Other | 1,044 |
2004 - 2018 National Fire Incident Reporting System (NFIRS) incidents
- Incident types reported to NFIRS in Alamogordo, NM
- 4,76043.9%Rescue & EMS
- 2,18420.1%Hazardous Condition
- 1,82016.8%Fire
- 7847.2%Good Intent Call
- 6355.9%False Alarm
- 5765.3%Service Call
- 740.7%Severe Weather
- 140.1%Special Incident
- Fire incident types reported to NFIRS in Alamogordo, NM
- 86347.4%Outside Fires
- 56731.2%Structure Fires
- 25614.1%Mobile Property/Vehicle Fires
- 1347.4%Other
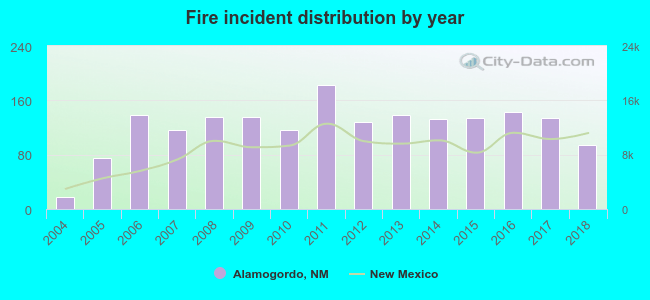 Based on the data from the years 2004 - 2018 the average number of fires per year is 121. The highest number of reported fire incidents - 183 took place in 2011, and the least - 18 in 2004. The data has an increasing trend.
The average number of yearly fire incidents per 10k residents in Alamogordo, NM compared to nearest cities:
(Note: Based on data for the last 3 years, including only cities with population 5,000 and above)
| Alamogordo: | 39.8 |
| Ruidoso: | 53.3 |
| Las Cruces: | 24.8 |
| Chaparral: | 92.3 |
| Anthony: | 60.5 |
| Fairacres: | 59.4 |
| Sunland Park: | 25.5 |
| Roswell: | 80.2 |
| Artesia: | 126.7 |
 The median response time based on all reported fire incidents is 5 minutes. This is lower compared to the New Mexico median value.
The median response time in Alamogordo, NM compared to nearest cities:
(Note: Based on data for all years, including only cities with at least 500 fire incidents)
| Alamogordo: | 5 minutes |
| Las Cruces: | 6 minutes |
| Chaparral: | 8 minutes |
| Anthony: | 12 minutes |
| Roswell: | 5 minutes |
| Artesia: | 6 minutes |
 According to the reports from the years 2004 - 2018 the average number of fire-related yearly deaths is 0. The highest number of reported deaths - 2 took place in 2017, and the lowest - 0 in 2004. The data has a constant trend.
 Based on the data from the years 2004 - 2018 the average number of fire-related yearly casualties is 1. The highest number of reported injuries - 2 took place in 2013, and the lowest - 0 in 2004. The data has a constant trend.
The average number of casualties per 1,000 fire incidents is 5. This indicator was the highest - 14 in 2013, and the lowest 0 in 2004. The trend for injuries per 1,000 fire incidents is constant. Compared to the state value the number of injuries per 1,000 fires is higher.
Based on the data from the years 2004 - 2018 the average number of fire-related yearly casualties is 1. The highest number of reported injuries - 2 took place in 2013, and the lowest - 0 in 2004. The data has a constant trend.
The average number of casualties per 1,000 fire incidents is 5. This indicator was the highest - 14 in 2013, and the lowest 0 in 2004. The trend for injuries per 1,000 fire incidents is constant. Compared to the state value the number of injuries per 1,000 fires is higher.Casualties per 1,000 incidents in Alamogordo, NM compared to nearest cities:
(Note: Based on data for all years, including only cities with at least 500 fire incidents)
| Alamogordo: | 4.9 |
| Las Cruces: | 3.1 |
| Chaparral: | 0.0 |
| Anthony: | 0.0 |
| Roswell: | 1.7 |
| Artesia: | 1.2 |
 30.8% incidents where reported in the morning and 69.2% in the evening. The most fires (17.0%) took place on Sunday, and the least (13.4%) on Thursday.
 Based on the 1,820 fire incident reports from years 2004 - 2018 most fires (12.1%) took place during June, and the least (5.1%) in September.
 Out of all 10,853 cases reported during the years 2004 - 2018, the most belonged to the categories: Rescue & EMS (43.9%), Hazardous Condition (20.1%), and Fire (16.8%).
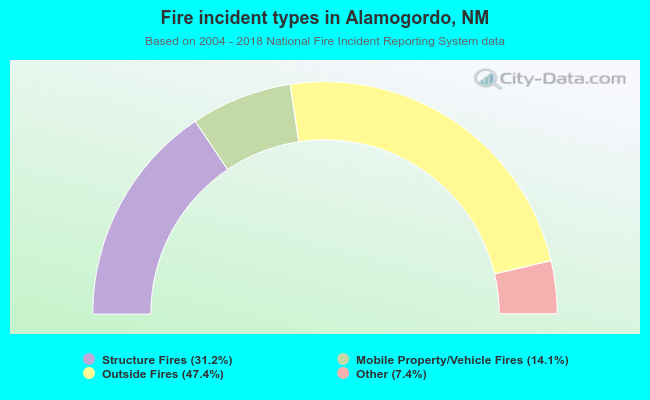 When looking into fire subcategories, the most reports belonged to: Outside Fires (47.4%), and Structure Fires (31.2%).