Aiken: Fire Incidents, South Carolina (SC)
Where are fire incidents reported in Aiken, SC
Something went wrong! Please refresh the page.
| Fire incidents reported | |
|---|---|
| Sreet name | Count |
| WHISKEY RD | 266 |
| RICHLAND AVE | 230 |
| YORK ST | 172 |
| PINE LOG RD | 102 |
| SILVER BLUFF RD | 94 |
| RUTLAND DR | 90 |
| UNIVERSITY PKY | 82 |
| ALDRICH ST | 72 |
| HAMPTON AVE | 70 |
| LAURENS ST | 70 |
| WIRE RD | 60 |
| WAGENER RD | 58 |
| HITCHCOCK PKY | 52 |
| EAST PINE LOG RD | 48 |
| KERSHAW ST | 44 |
| OLD BARNWELL RD | 42 |
| PIPELINE RD | 42 |
| ABBEVILLE AVE | 40 |
| BANKS MILL RD | 40 |
| VAUCLUSE RD | 40 |
| PARK AVE | 38 |
| SUMTER ST | 38 |
| COLUMBIA HWY | 36 |
| EAST GATE DR | 36 |
| UNION ST | 36 |
| ALFRED ST | 34 |
| I-20 HWY | 34 |
| POWDERHOUSE RD | 34 |
| TROLLEY LINE RD | 32 |
| JEHOSSEE DR | 30 |
| Other | 1,631 |
2003 - 2018 National Fire Incident Reporting System (NFIRS) incidents
- Incident types reported to NFIRS in Aiken, SC
- 3,69332.0%Fire
- 3,59931.2%Rescue & EMS
- 1,54813.4%False Alarm
- 1,31811.4%Hazardous Condition
- 9628.3%Good Intent Call
- 3713.2%Service Call
- 260.2%Severe Weather
- 160.1%Overpressure Rupture
- Fire incident types reported to NFIRS in Aiken, SC
- 1,50840.8%Outside Fires
- 1,50640.8%Structure Fires
- 61816.7%Mobile Property/Vehicle Fires
- 611.7%Other
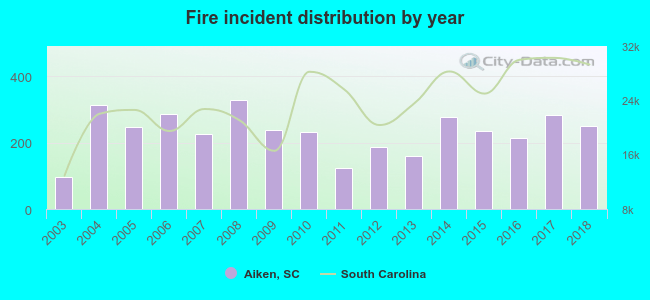 According to the data from the years 2003 - 2018 the average number of fires per year is 231. The highest number of fire incidents - 327 took place in 2008, and the least - 95 in 2003. The data has an increasing trend.
The average number of yearly fire incidents per 10k residents in Aiken, SC compared to nearest cities:
(Note: Based on data for the last 3 years, including only cities with population 5,000 and above)
| Aiken: | 82.3 |
| Beech Island: | 77.9 |
| Belvedere: | 90.9 |
| North Augusta: | 73.8 |
| Lexington: | 285.2 |
 The median response time based on all reported fire incidents is 4 minutes. This is lower compared to the South Carolina median value.
The median response time in Aiken, SC compared to nearest cities:
(Note: Based on data for all years, including only cities with at least 500 fire incidents)
| Aiken: | 4 minutes |
| Graniteville: | 9 minutes |
| Beech Island: | 9 minutes |
| Belvedere: | 8 minutes |
| North Augusta: | 5 minutes |
| Augusta: | 5 minutes |
| Williston: | 6 minutes |
| Wagener: | 10 minutes |
| Martinez: | 5 minutes |
 According to the reports from the years 2003 - 2018 the average number of fire-related yearly deaths is 1. The highest number of reported deaths - 3 took place in 2011, and the lowest - 0 in 2003. The data has a constant trend.
The average number of deaths per 1,000 fire incidents is 3. This indicator was the highest - 24 in 2011, and the lowest 0 in 2003. The trend for fatalities per 1,000 incidents is constant. Compared to the state value the number of deaths per 1,000 incidents is about the same.
According to the reports from the years 2003 - 2018 the average number of fire-related yearly deaths is 1. The highest number of reported deaths - 3 took place in 2011, and the lowest - 0 in 2003. The data has a constant trend.
The average number of deaths per 1,000 fire incidents is 3. This indicator was the highest - 24 in 2011, and the lowest 0 in 2003. The trend for fatalities per 1,000 incidents is constant. Compared to the state value the number of deaths per 1,000 incidents is about the same.
 Based on the reports from the years 2003 - 2018 the average number of fire-related yearly casualties is 4. The highest number of injuries - 10 took place in 2004, and the lowest - 0 in 2016. The data has a dropping trend.
The average number of injuries per 1,000 fire incidents is 18. This indicator was the highest - 74 in 2003, and the lowest 0 in 2016. The trend for injuries per 1,000 fire incidents is declining. Compared to the state value the number of injuries per 1,000 incidents is much higher.
Based on the reports from the years 2003 - 2018 the average number of fire-related yearly casualties is 4. The highest number of injuries - 10 took place in 2004, and the lowest - 0 in 2016. The data has a dropping trend.
The average number of injuries per 1,000 fire incidents is 18. This indicator was the highest - 74 in 2003, and the lowest 0 in 2016. The trend for injuries per 1,000 fire incidents is declining. Compared to the state value the number of injuries per 1,000 incidents is much higher.Casualties per 1,000 incidents in Aiken, SC compared to nearest cities:
(Note: Based on data for all years, including only cities with at least 500 fire incidents)
| Aiken: | 16.8 |
| Graniteville: | 10.1 |
| Beech Island: | 3.2 |
| Belvedere: | 1.3 |
| North Augusta: | 5.8 |
| Augusta: | 18.7 |
| Williston: | 3.9 |
| Wagener: | 1.0 |
| Martinez: | 1.3 |
 26.5% incidents where reported in the morning and 73.5% in the evening. The most fires (15.1%) took place on Monday, and the least (13.2%) on Friday.
 Based on the 3,693 reports from years 2003 - 2018 most fires (10.7%) took place during January, and the least (6.3%) in August.
 Out of all 11,543 cases reported during the years 2003 - 2018, the most belonged to the categories: Fire (32.0%), Rescue & EMS (31.2%), and False Alarm (13.4%).
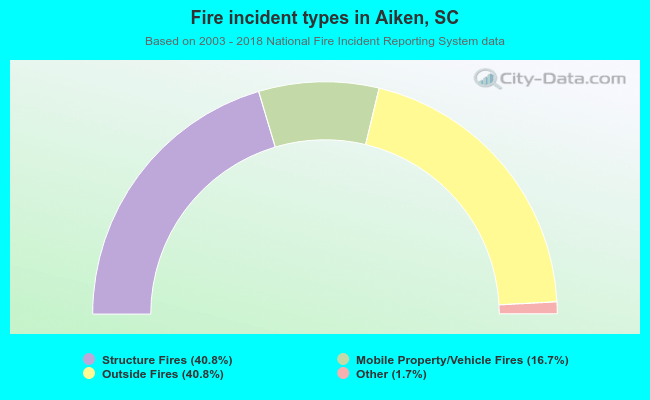 When looking into fire subcategories, the most reports belonged to: Outside Fires (40.8%), and Structure Fires (40.8%).