Crime rate in Virginia Beach, Virginia (VA): murders, rapes, robberies, assaults, burglaries, thefts, auto thefts, arson, law enforcement employees, police officers, crime map
Crime rate in Virginia Beach, VA
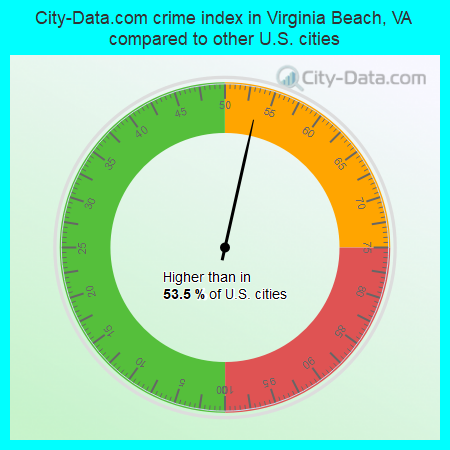
The 2022 crime rate in Virginia Beach, VA is 110 (City-Data.com crime index), which is 2.2 times smaller than the U.S. average. It was higher than in 53.5% U.S. cities. The 2022 Virginia Beach crime rate fell by 3% compared to 2021. The number of homicides stood at 21 - an increase of 7 compared to 2021. In the last 5 years Virginia Beach has seen decline of violent crime and decline of property crime.See how dangerous Virginia Beach, VA is compared to the nearest cities:
(Note: Higher means more crime)
(Note: Higher means more crime)
| Virginia Beach: | 109.6 |
| Norfolk: | 461.0 |
| Chesapeake: | 214.0 |
| Portsmouth: | 537.5 |
| Hampton: | 239.8 |
| Poquoson: | 76.7 |
| Newport News: | 288.4 |
| Suffolk: | 226.4 |
| Cape Charles: | 46.7 |
The City-Data.com crime index weighs serious crimes and violent crimes more heavily. Higher means more crime, U.S. average is 246.1. It adjusts for the number of visitors and daily workers commuting into cities.
- means the value is smaller than the state average.- means the value is about the same as the state average.
- means the value is bigger than the state average.
- means the value is much bigger than the state average.
According to our research of Virginia and other state lists, there were 706 registered sex offenders living in Virginia Beach, Virginia as of June 05, 2024.
The ratio of all residents to sex offenders in Virginia Beach is 641 to 1.
The ratio of registered sex offenders to all residents in this city is lower than the state average.
Violent crime rate in 2022
| Virginia Beach: | 56.5 |
| U.S. Average: | 219.8 |
Violent crime rate in 2021
| Virginia Beach: | 69.6 |
| U.S. Average: | 224.8 |
Violent crime rate in 2020
| Virginia Beach: | 64.0 |
| U.S. Average: | 228.2 |
Violent crime rate in 2019
| Virginia Beach: | 83.6 |
| U.S. Average: | 219.9 |
Violent crime rate in 2018
| Virginia Beach: | 79.5 |
| U.S. Average: | 221.2 |
Violent crime rate in 2017
| Virginia Beach: | 85.2 |
| U.S. Average: | 226.2 |
Violent crime rate in 2016
| Virginia Beach: | 99.1 |
| U.S. Average: | 227.3 |
Violent crime rate in 2015
| Virginia Beach: | 90.7 |
| U.S. Average: | 219.3 |
Violent crime rate in 2014
| Virginia Beach: | 92.3 |
| U.S. Average: | 211.1 |
Violent crime rate in 2013
| Virginia Beach: | 103.8 |
| U.S. Average: | 214.2 |
Violent crime rate in 2012
| Virginia Beach: | 97.3 |
| U.S. Average: | 187.4 |
Violent crime rate in 2011
| Virginia Beach: | 100.9 |
| U.S. Average: | 187.1 |
Violent crime rate in 2010
| Virginia Beach: | 105.7 |
| U.S. Average: | 195.7 |
Violent crime rate in 2009
| Virginia Beach: | 116.8 |
| U.S. Average: | 208.9 |
Violent crime rate in 2008
| Virginia Beach: | 133.0 |
| U.S. Average: | 222.5 |
Violent crime rate in 2007
| Virginia Beach: | 120.0 |
| U.S. Average: | 229.1 |
Violent crime rate in 2006
| Virginia Beach: | 138.6 |
| U.S. Average: | 232.6 |
Violent crime rate in 2005
| Virginia Beach: | 124.8 |
| U.S. Average: | 227.0 |
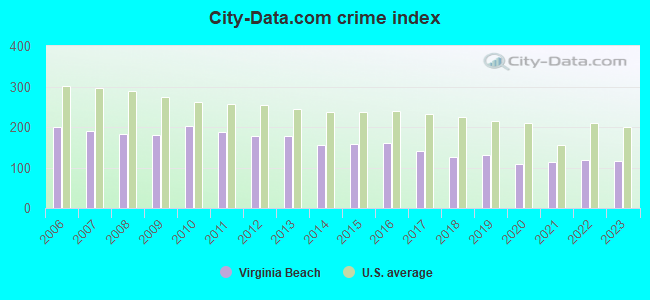
Property crime rate in 2022
| Virginia Beach: | 109.6 |
| U.S. Average: | 166.5 |
Property crime rate in 2021
| Virginia Beach: | 108.1 |
| U.S. Average: | 157.8 |
Property crime rate in 2020
| Virginia Beach: | 107.2 |
| U.S. Average: | 169.6 |
Property crime rate in 2019
| Virginia Beach: | 119.4 |
| U.S. Average: | 179.7 |
Property crime rate in 2018
| Virginia Beach: | 119.7 |
| U.S. Average: | 190.2 |
Property crime rate in 2017
| Virginia Beach: | 132.2 |
| U.S. Average: | 206.4 |
Property crime rate in 2016
| Virginia Beach: | 149.1 |
| U.S. Average: | 216.6 |
Property crime rate in 2015
| Virginia Beach: | 152.1 |
| U.S. Average: | 221.5 |
Property crime rate in 2014
| Virginia Beach: | 152.4 |
| U.S. Average: | 230.8 |
Property crime rate in 2013
| Virginia Beach: | 181.8 |
| U.S. Average: | 250.4 |
Property crime rate in 2012
| Virginia Beach: | 194.9 |
| U.S. Average: | 267.3 |
Property crime rate in 2011
| Virginia Beach: | 217.2 |
| U.S. Average: | 273.5 |
Property crime rate in 2010
| Virginia Beach: | 241.3 |
| U.S. Average: | 276.4 |
Property crime rate in 2009
| Virginia Beach: | 237.1 |
| U.S. Average: | 285.6 |
Property crime rate in 2008
| Virginia Beach: | 227.2 |
| U.S. Average: | 302.2 |
Property crime rate in 2007
| Virginia Beach: | 204.8 |
| U.S. Average: | 309.2 |
Property crime rate in 2006
| Virginia Beach: | 196.6 |
| U.S. Average: | 317.3 |
Property crime rate in 2005
| Virginia Beach: | 207.3 |
| U.S. Average: | 322.3 |


Full-time law enforcement employees in 2021, including police officers: 964 (734 officers - 608 male; 126 female).
| Officers per 1,000 residents here: | 1.62 |
| Virginia average: | 2.24 |
Full-time law enforcement employees in 2020, including police officers: 925 (744 officers - 624 male; 120 female).
| Officers per 1,000 residents here: | 1.65 |
| Virginia average: | 2.31 |
Full-time law enforcement employees in 2019, including police officers: 938 (760 officers - 641 male; 119 female).
| Officers per 1,000 residents here: | 1.69 |
| Virginia average: | 2.27 |
Full-time law enforcement employees in 2018, including police officers: 953 (778 officers - 656 male; 122 female).
| Officers per 1,000 residents here: | 1.73 |
| Virginia average: | 2.26 |
Full-time law enforcement employees in 2017, including police officers: 984 (805 officers - 688 male; 117 female).
| Officers per 1,000 residents here: | 1.77 |
| Virginia average: | 2.25 |
Full-time law enforcement employees in 2016, including police officers: 951 (779 officers - 668 male; 111 female).
| Officers per 1,000 residents here: | 1.72 |
| Virginia average: | 2.25 |
Full-time law enforcement employees in 2015, including police officers: 953 (772 officers - 665 male; 107 female).
| Officers per 1,000 residents here: | 1.70 |
| Virginia average: | 2.26 |
Full-time law enforcement employees in 2014, including police officers: 964 (787 officers - 684 male; 103 female).
| Officers per 1,000 residents here: | 1.74 |
| Virginia average: | 2.27 |
Full-time law enforcement employees in 2013, including police officers: 955 (782 officers - 679 male; 103 female).
| Officers per 1,000 residents here: | 1.74 |
| Virginia average: | 2.27 |
Full-time law enforcement employees in 2012, including police officers: 955 (783 officers - 677 male; 106 female).
| Officers per 1,000 residents here: | 1.75 |
| Virginia average: | 2.27 |
Full-time law enforcement employees in 2011, including police officers: 945 (776 officers - 672 male; 104 female).
| Officers per 1,000 residents here: | 1.75 |
| Virginia average: | 2.28 |
Full-time law enforcement employees in 2010, including police officers: 938 (775 officers - 673 male; 102 female).
| Officers per 1,000 residents here: | 1.77 |
| Virginia average: | 2.30 |
Full-time law enforcement employees in 2009, including police officers: 944 (780 officers - 684 male; 96 female).
| Officers per 1,000 residents here: | 1.79 |
| Virginia average: | 2.32 |
Full-time law enforcement employees in 2008, including police officers: 968 (812 officers - 715 male; 97 female).
| Officers per 1,000 residents here: | 1.87 |
| Virginia average: | 2.38 |
Full-time law enforcement employees in 2007, including police officers: 962 (800 officers - 700 male; 100 female).
| Officers per 1,000 residents here: | 1.84 |
| Virginia average: | 2.34 |
Full-time law enforcement employees in 2006, including police officers: 955 (800 officers - 697 male; 103 female).
| Officers per 1,000 residents here: | 1.81 |
| Virginia average: | 2.31 |
Full-time law enforcement employees in 2005, including police officers: 951 (786 officers - 686 male; 100 female).
| Officers per 1,000 residents here: | 1.76 |
| Virginia average: | 2.29 |
Full-time law enforcement employees in 2004, including police officers: 931 (766 officers - 674 male; 92 female).
| Officers per 1,000 residents here: | 1.73 |
| Virginia average: | 2.28 |
Full-time law enforcement employees in 2003, including police officers: 946 (783 officers - 696 male; 87 female).
| Officers per 1,000 residents here: | 1.78 |
| Virginia average: | 2.27 |


Zip codes: 23451, 23452, 23453, 23454, 23455, 23456, 23457, 23459, 23460, 23461, 23462, 23464.