Crime rate in Oceanside, California (CA): murders, rapes, robberies, assaults, burglaries, thefts, auto thefts, arson, law enforcement employees, police officers, crime map
Crime rate in Oceanside, CA
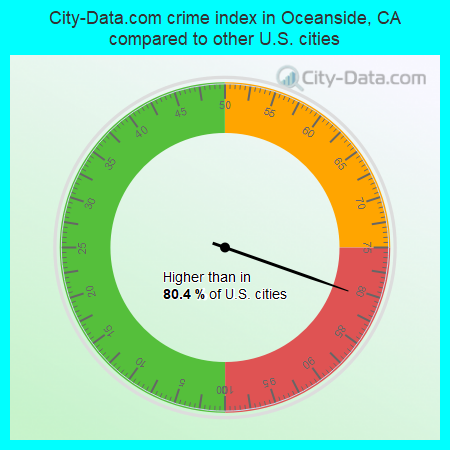
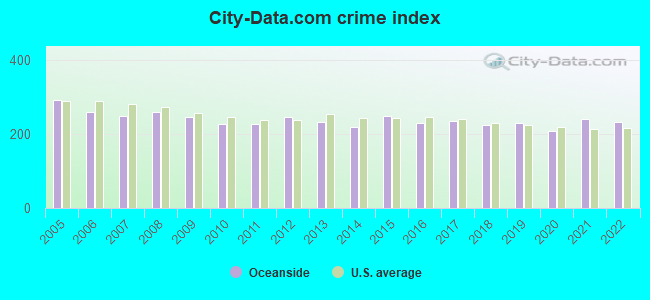
The 2022 crime rate in Oceanside, CA is 233 (City-Data.com crime index), which is about the average for the U.S. cities. It was higher than in 80.4% U.S. cities. The 2022 Oceanside crime rate fell by 3% compared to 2021. The number of homicides stood at 8 - an increase of 2 compared to 2021. In the last 5 years Oceanside has seen rise of violent crime and decreasing property crime.See how dangerous Oceanside, CA is compared to the nearest cities:
(Note: Higher means more crime)
(Note: Higher means more crime)
| Oceanside: | 232.6 |
| Vista: | 176.6 |
| Carlsbad: | 145.9 |
| San Marcos: | 110.2 |
| Encinitas: | 117.0 |
| Escondido: | 193.0 |
| Solana Beach: | 130.4 |
| Del Mar: | 231.0 |
| San Clemente: | 110.5 |
The City-Data.com crime index weighs serious crimes and violent crimes more heavily. Higher means more crime, U.S. average is 246.1. It adjusts for the number of visitors and daily workers commuting into cities.
- means the value is smaller than the state average.- means the value is about the same as the state average.
- means the value is bigger than the state average.
- means the value is much bigger than the state average.
According to our research of California and other state lists, there were 114 registered sex offenders living in Oceanside, California as of May 28, 2024.
The ratio of all residents to sex offenders in Oceanside is 1,539 to 1.
The ratio of registered sex offenders to all residents in this city is lower than the state average.
Violent crime rate in 2022
| Oceanside: | 262.2 |
| U.S. Average: | 219.8 |
Violent crime rate in 2021
| Oceanside: | 265.5 |
| U.S. Average: | 224.8 |
Violent crime rate in 2020
| Oceanside: | 227.0 |
| U.S. Average: | 228.2 |
Violent crime rate in 2019
| Oceanside: | 231.8 |
| U.S. Average: | 219.9 |
Violent crime rate in 2018
| Oceanside: | 215.5 |
| U.S. Average: | 221.2 |
Violent crime rate in 2017
| Oceanside: | 223.4 |
| U.S. Average: | 226.2 |
Violent crime rate in 2016
| Oceanside: | 202.7 |
| U.S. Average: | 227.3 |
Violent crime rate in 2015
| Oceanside: | 226.0 |
| U.S. Average: | 219.3 |
Violent crime rate in 2014
| Oceanside: | 206.5 |
| U.S. Average: | 211.1 |
Violent crime rate in 2013
| Oceanside: | 203.4 |
| U.S. Average: | 214.2 |
Violent crime rate in 2012
| Oceanside: | 233.7 |
| U.S. Average: | 187.4 |
Violent crime rate in 2011
| Oceanside: | 206.7 |
| U.S. Average: | 187.1 |
Violent crime rate in 2010
| Oceanside: | 212.2 |
| U.S. Average: | 195.7 |
Violent crime rate in 2009
| Oceanside: | 241.2 |
| U.S. Average: | 208.9 |
Violent crime rate in 2008
| Oceanside: | 260.8 |
| U.S. Average: | 222.5 |
Violent crime rate in 2007
| Oceanside: | 251.1 |
| U.S. Average: | 229.1 |
Violent crime rate in 2006
| Oceanside: | 259.1 |
| U.S. Average: | 232.6 |
Violent crime rate in 2005
| Oceanside: | 276.6 |
| U.S. Average: | 227.0 |
Property crime rate in 2022
| Oceanside: | 171.7 |
| U.S. Average: | 166.5 |
Property crime rate in 2021
| Oceanside: | 165.7 |
| U.S. Average: | 157.8 |
Property crime rate in 2020
| Oceanside: | 149.8 |
| U.S. Average: | 169.6 |
Property crime rate in 2019
| Oceanside: | 167.1 |
| U.S. Average: | 179.7 |
Property crime rate in 2018
| Oceanside: | 178.7 |
| U.S. Average: | 190.2 |
Property crime rate in 2017
| Oceanside: | 193.9 |
| U.S. Average: | 206.4 |
Property crime rate in 2016
| Oceanside: | 201.5 |
| U.S. Average: | 216.6 |
Property crime rate in 2015
| Oceanside: | 207.0 |
| U.S. Average: | 221.5 |
Property crime rate in 2014
| Oceanside: | 188.2 |
| U.S. Average: | 230.8 |
Property crime rate in 2013
| Oceanside: | 212.3 |
| U.S. Average: | 250.4 |
Property crime rate in 2012
| Oceanside: | 225.0 |
| U.S. Average: | 267.3 |
Property crime rate in 2011
| Oceanside: | 205.0 |
| U.S. Average: | 273.5 |
Property crime rate in 2010
| Oceanside: | 206.3 |
| U.S. Average: | 276.4 |
Property crime rate in 2009
| Oceanside: | 210.5 |
| U.S. Average: | 285.6 |
Property crime rate in 2008
| Oceanside: | 228.7 |
| U.S. Average: | 302.2 |
Property crime rate in 2007
| Oceanside: | 217.5 |
| U.S. Average: | 309.2 |
Property crime rate in 2006
| Oceanside: | 233.3 |
| U.S. Average: | 317.3 |
Property crime rate in 2005
| Oceanside: | 264.4 |
| U.S. Average: | 322.3 |


Full-time law enforcement employees in 2021, including police officers: 288 (200 officers - 177 male; 23 female).
| Officers per 1,000 residents here: | 1.14 |
| California average: | 2.30 |
Full-time law enforcement employees in 2020, including police officers: 299 (208 officers - 187 male; 21 female).
| Officers per 1,000 residents here: | 1.18 |
| California average: | 2.36 |
Full-time law enforcement employees in 2019, including police officers: 288 (203 officers - 184 male; 19 female).
| Officers per 1,000 residents here: | 1.15 |
| California average: | 2.35 |
Full-time law enforcement employees in 2018, including police officers: 293 (207 officers - 188 male; 19 female).
| Officers per 1,000 residents here: | 1.17 |
| California average: | 2.34 |
Full-time law enforcement employees in 2017, including police officers: 282 (204 officers - 186 male; 18 female).
| Officers per 1,000 residents here: | 1.15 |
| California average: | 2.32 |
Full-time law enforcement employees in 2016, including police officers: 278 (204 officers - 183 male; 21 female).
| Officers per 1,000 residents here: | 1.15 |
| California average: | 2.32 |
Full-time law enforcement employees in 2015, including police officers: 276 (206 officers - 185 male; 21 female).
| Officers per 1,000 residents here: | 1.17 |
| California average: | 1.98 |
Full-time law enforcement employees in 2014, including police officers: 277 (203 officers - 184 male; 19 female).
| Officers per 1,000 residents here: | 1.17 |
| California average: | 2.00 |
Full-time law enforcement employees in 2013, including police officers: 280 (200 officers - 181 male; 19 female).
| Officers per 1,000 residents here: | 1.16 |
| California average: | 2.34 |
Full-time law enforcement employees in 2012, including police officers: 282 (203 officers - 185 male; 18 female).
| Officers per 1,000 residents here: | 1.19 |
| California average: | 2.36 |
Full-time law enforcement employees in 2011, including police officers: 284 (203 officers - 183 male; 20 female).
| Officers per 1,000 residents here: | 1.20 |
| California average: | 2.09 |
Full-time law enforcement employees in 2010, including police officers: 292 (208 officers - 186 male; 22 female).
| Officers per 1,000 residents here: | 1.24 |
| California average: | 2.46 |
Full-time law enforcement employees in 2009, including police officers: 304 (206 officers - 183 male; 23 female).
| Officers per 1,000 residents here: | 1.21 |
| California average: | 2.52 |
Full-time law enforcement employees in 2008, including police officers: 302 (206 officers - 183 male; 23 female).
| Officers per 1,000 residents here: | 1.22 |
| California average: | 2.55 |
Full-time law enforcement employees in 2007, including police officers: 297 (200 officers - 181 male; 19 female).
| Officers per 1,000 residents here: | 1.20 |
| California average: | 2.48 |
Full-time law enforcement employees in 2006, including police officers: 286 (199 officers - 180 male; 19 female).
| Officers per 1,000 residents here: | 1.19 |
| California average: | 2.38 |
Full-time law enforcement employees in 2005, including police officers: 277 (187 officers - 168 male; 19 female).
| Officers per 1,000 residents here: | 1.11 |
| California average: | 2.34 |
Full-time law enforcement employees in 2004, including police officers: 238 (177 officers - 160 male; 17 female).
| Officers per 1,000 residents here: | 1.05 |
| California average: | 2.36 |
Full-time law enforcement employees in 2003, including police officers: 263 (178 officers - 158 male; 20 female).
| Officers per 1,000 residents here: | 1.06 |
| California average: | 2.42 |


