Crime rate in Lyndon, Illinois (IL): murders, rapes, robberies, assaults, burglaries, thefts, auto thefts, arson, crime map

Crime rate in Lyndon, IL
The 2011 crime rate in Lyndon, IL is 32 (City-Data.com crime index), which is 8.7 times smaller than the U.S. average. It was higher than in 10.0% U.S. cities. The 2011 Lyndon crime rate fell by 21% compared to 2010. In the last 5 years Lyndon has seen decreasing violent crime and constant level of property crime.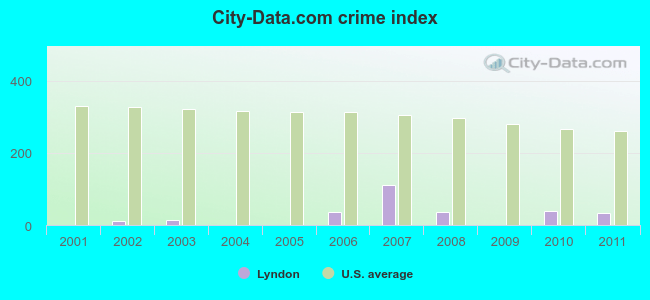
Type |
2003 |
2004 |
2005 |
2006 |
2007 |
2008 |
2009 |
2010 |
2011 |
|---|---|---|---|---|---|---|---|---|---|
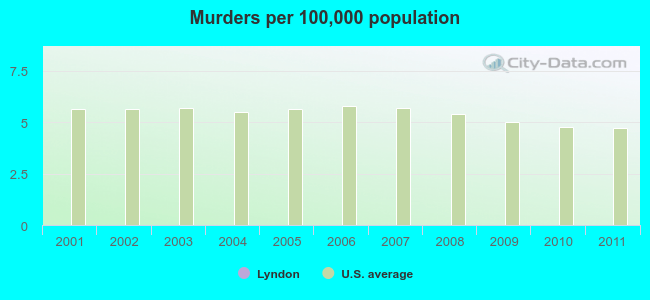
| Murders (per 100,000) | 0 (0.0) | 0 (0.0) | 0 (0.0) | 0 (0.0) | 0 (0.0) | 0 (0.0) | 0 (0.0) | 0 (0.0) | N/A |
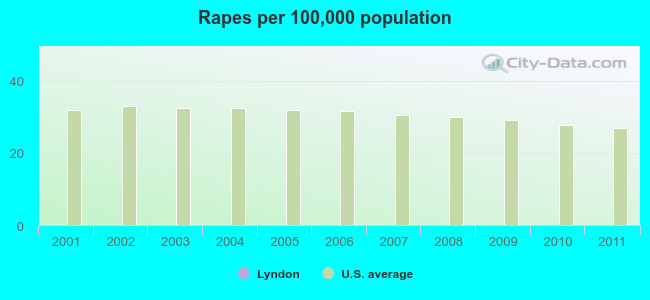
| Rapes (per 100,000) | 0 (0.0) | 0 (0.0) | 0 (0.0) | 0 (0.0) | 0 (0.0) | 0 (0.0) | 0 (0.0) | 0 (0.0) | N/A |
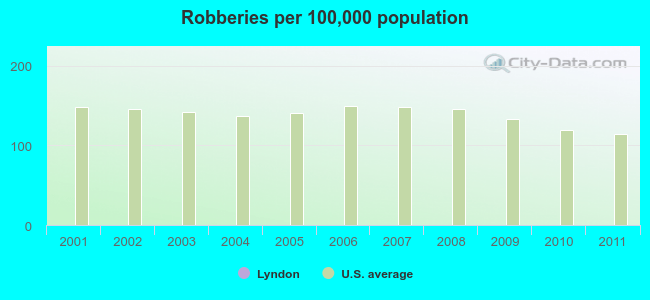
| Robberies (per 100,000) | 0 (0.0) | 0 (0.0) | 0 (0.0) | 0 (0.0) | 0 (0.0) | 0 (0.0) | 0 (0.0) | 0 (0.0) | N/A |
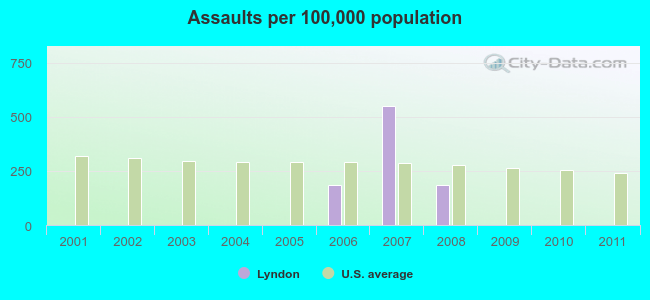
| Assaults (per 100,000) | 0 (0.0) | 0 (0.0) | 0 (0.0) | 1 (183.2) | 3 (551.5) | 1 (185.5) | 0 (0.0) | 0 (0.0) | N/A |
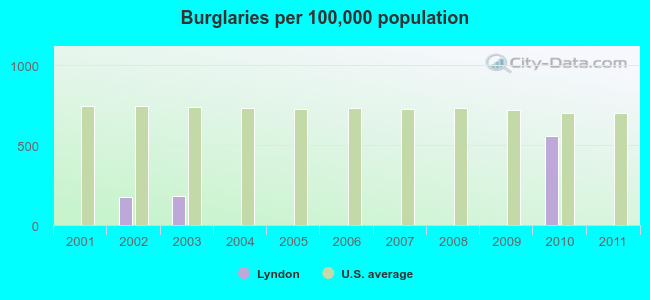
| Burglaries (per 100,000) | 1 (179.2) | 0 (0.0) | 0 (0.0) | 0 (0.0) | 0 (0.0) | 0 (0.0) | 0 (0.0) | 3 (557.6) | N/A |
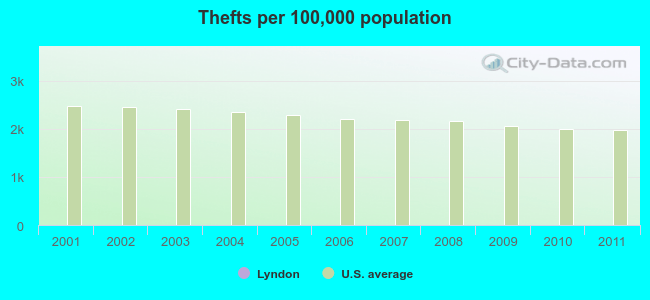
| Thefts (per 100,000) | 0 (0.0) | 0 (0.0) | 0 (0.0) | 0 (0.0) | 0 (0.0) | 0 (0.0) | 0 (0.0) | 0 (0.0) | N/A |
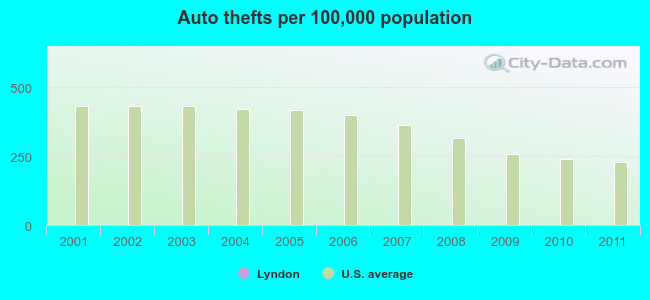
| Auto thefts (per 100,000) | 0 (0.0) | 0 (0.0) | 0 (0.0) | 0 (0.0) | 0 (0.0) | 0 (0.0) | 0 (0.0) | N/A | 0 (0.0) |
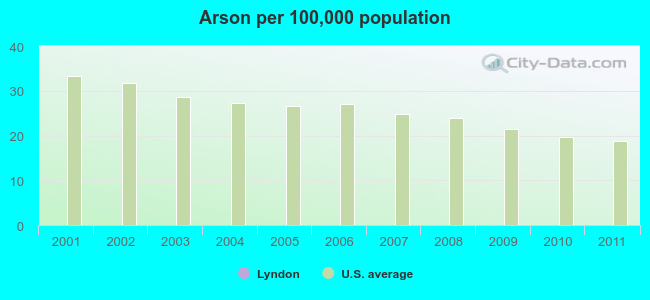
| Arson (per 100,000) | 0 (0.0) | 0 (0.0) | 0 (0.0) | 0 (0.0) | 0 (0.0) | 0 (0.0) | 0 (0.0) | 0 (0.0) | N/A |
| City-Data.com crime index (higher means more crime, U.S. average = 280.6) | 12.6 | 0.0 | 0.0 | 36.6 | 110.3 | 37.1 | 0.0 | 39.0 | 32.3 |
The City-Data.com crime rate weighs serious crimes and violent crimes more heavily. It adjusts for the number of visitors and daily workers commuting into cities.
According to our research of Illinois and other state lists, there was 1 registered sex offender living in Lyndon, Illinois as of May 28, 2024.
The ratio of all residents to sex offenders in Lyndon is 687 to 1.
The ratio of registered sex offenders to all residents in this city is near the state average.
Violent crime rate in 2010
| Lyndon: | 0.0 |
| U.S. Average: | 223.2 |
Violent crime rate in 2009
| Lyndon: | 0.0 |
| U.S. Average: | 238.0 |
Violent crime rate in 2008
| Lyndon: | 92.8 |
| U.S. Average: | 252.4 |
Violent crime rate in 2007
| Lyndon: | 275.7 |
| U.S. Average: | 259.7 |
Violent crime rate in 2006
| Lyndon: | 91.6 |
| U.S. Average: | 264.1 |
Violent crime rate in 2005
| Lyndon: | 0.0 |
| U.S. Average: | 258.9 |
Violent crime rate in 2004
| Lyndon: | 0.0 |
| U.S. Average: | 256.0 |
Violent crime rate in 2003
| Lyndon: | 0.0 |
| U.S. Average: | 262.6 |
Violent crime rate in 2002
| Lyndon: | 0.0 |
| U.S. Average: | 272.2 |
Violent crime rate in 2001
| Lyndon: | 0.0 |
| U.S. Average: | 276.6 |
Property crime rate in 2009
| Lyndon: | 0.0 |
| U.S. Average: | 285.6 |
Property crime rate in 2008
| Lyndon: | 0.0 |
| U.S. Average: | 302.2 |
Property crime rate in 2007
| Lyndon: | 0.0 |
| U.S. Average: | 309.2 |
Property crime rate in 2006
| Lyndon: | 0.0 |
| U.S. Average: | 317.3 |
Property crime rate in 2005
| Lyndon: | 0.0 |
| U.S. Average: | 322.3 |
Property crime rate in 2004
| Lyndon: | 0.0 |
| U.S. Average: | 327.4 |
Property crime rate in 2003
| Lyndon: | 35.9 |
| U.S. Average: | 334.1 |
Property crime rate in 2002
| Lyndon: | 35.4 |
| U.S. Average: | 336.9 |
Property crime rate in 2001
| Lyndon: | 0.0 |
| U.S. Average: | 337.2 |