Crime rate in Lubbock, Texas (TX): murders, rapes, robberies, assaults, burglaries, thefts, auto thefts, arson, law enforcement employees, police officers, crime map
Crime rate in Lubbock, TX
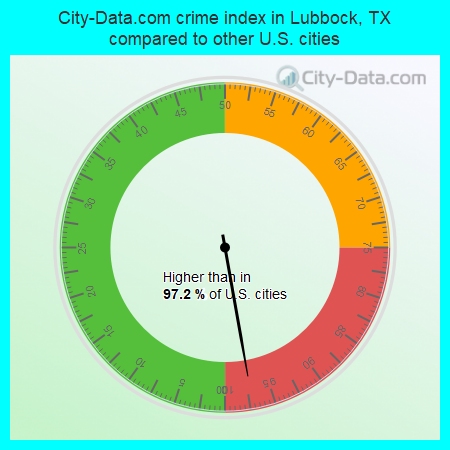
The 2022 crime rate in Lubbock, TX is 521 (City-Data.com crime index), which is 2.1 times greater than the U.S. average. It was higher than in 97.2% U.S. cities. The 2022 Lubbock crime rate rose by 5% compared to 2021. The number of homicides stood at 25. In the last 5 years Lubbock has seen increasing violent crime and decline of property crime.See how dangerous Lubbock, TX is compared to the nearest cities:
(Note: Higher means more crime)
(Note: Higher means more crime)
| Lubbock: | 520.8 |
| Wolfforth: | 53.4 |
| Shallowater: | 124.8 |
| Ransom Canyon: | 32.3 |
| New Deal: | 5.0 |
| Idalou: | 111.0 |
| Slaton: | 149.5 |
| Abernathy: | 67.6 |
| Lorenzo: | 134.7 |
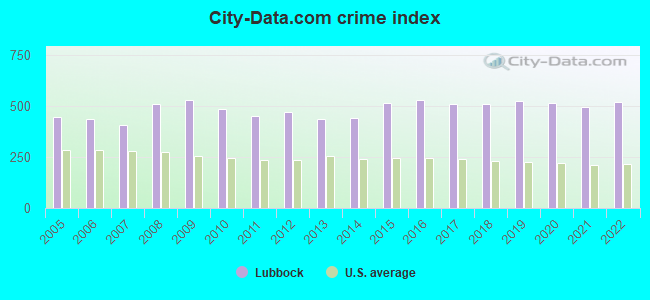
The City-Data.com crime index weighs serious crimes and violent crimes more heavily. Higher means more crime, U.S. average is 246.1. It adjusts for the number of visitors and daily workers commuting into cities.
- means the value is smaller than the state average.- means the value is about the same as the state average.
- means the value is bigger than the state average.
- means the value is much bigger than the state average.
According to our research of Texas and other state lists, there were 599 registered sex offenders living in Lubbock, Texas as of June 01, 2024.
The ratio of all residents to sex offenders in Lubbock is 422 to 1.
The ratio of registered sex offenders to all residents in this city is near the state average.
Violent crime rate in 2022
| Lubbock: | 602.9 |
| U.S. Average: | 219.8 |
Violent crime rate in 2021
| Lubbock: | 599.6 |
| U.S. Average: | 224.8 |
Violent crime rate in 2020
| Lubbock: | 606.0 |
| U.S. Average: | 228.2 |
Violent crime rate in 2019
| Lubbock: | 564.8 |
| U.S. Average: | 219.9 |
Violent crime rate in 2018
| Lubbock: | 555.0 |
| U.S. Average: | 221.2 |
Violent crime rate in 2017
| Lubbock: | 564.7 |
| U.S. Average: | 226.2 |
Violent crime rate in 2016
| Lubbock: | 580.5 |
| U.S. Average: | 227.3 |
Violent crime rate in 2015
| Lubbock: | 531.0 |
| U.S. Average: | 219.3 |
Violent crime rate in 2014
| Lubbock: | 464.8 |
| U.S. Average: | 211.1 |
Violent crime rate in 2013
| Lubbock: | 406.1 |
| U.S. Average: | 214.2 |
Violent crime rate in 2012
| Lubbock: | 442.4 |
| U.S. Average: | 187.4 |
Violent crime rate in 2011
| Lubbock: | 404.0 |
| U.S. Average: | 187.1 |
Violent crime rate in 2010
| Lubbock: | 462.2 |
| U.S. Average: | 195.7 |
Violent crime rate in 2009
| Lubbock: | 496.0 |
| U.S. Average: | 208.9 |
Violent crime rate in 2008
| Lubbock: | 501.8 |
| U.S. Average: | 222.5 |
Violent crime rate in 2007
| Lubbock: | 394.1 |
| U.S. Average: | 229.1 |
Violent crime rate in 2006
| Lubbock: | 429.5 |
| U.S. Average: | 232.6 |
Violent crime rate in 2005
| Lubbock: | 448.8 |
| U.S. Average: | 227.0 |
Property crime rate in 2022
| Lubbock: | 381.2 |
| U.S. Average: | 166.5 |
Property crime rate in 2021
| Lubbock: | 346.1 |
| U.S. Average: | 157.8 |
Property crime rate in 2020
| Lubbock: | 381.3 |
| U.S. Average: | 169.6 |
Property crime rate in 2019
| Lubbock: | 416.0 |
| U.S. Average: | 179.7 |
Property crime rate in 2018
| Lubbock: | 409.7 |
| U.S. Average: | 190.2 |
Property crime rate in 2017
| Lubbock: | 425.6 |
| U.S. Average: | 206.4 |
Property crime rate in 2016
| Lubbock: | 450.7 |
| U.S. Average: | 216.6 |
Property crime rate in 2015
| Lubbock: | 448.2 |
| U.S. Average: | 221.5 |
Property crime rate in 2014
| Lubbock: | 393.1 |
| U.S. Average: | 230.8 |
Property crime rate in 2013
| Lubbock: | 442.9 |
| U.S. Average: | 250.4 |
Property crime rate in 2012
| Lubbock: | 486.0 |
| U.S. Average: | 267.3 |
Property crime rate in 2011
| Lubbock: | 505.4 |
| U.S. Average: | 273.5 |
Property crime rate in 2010
| Lubbock: | 493.4 |
| U.S. Average: | 276.4 |
Property crime rate in 2009
| Lubbock: | 566.5 |
| U.S. Average: | 285.6 |
Property crime rate in 2008
| Lubbock: | 519.0 |
| U.S. Average: | 302.2 |
Property crime rate in 2007
| Lubbock: | 418.7 |
| U.S. Average: | 309.2 |
Property crime rate in 2006
| Lubbock: | 427.8 |
| U.S. Average: | 317.3 |
Property crime rate in 2005
| Lubbock: | 426.5 |
| U.S. Average: | 322.3 |


Full-time law enforcement employees in 2021, including police officers: 535 (421 officers - 378 male; 43 female).
| Officers per 1,000 residents here: | 1.58 |
| Texas average: | 2.07 |
Full-time law enforcement employees in 2020, including police officers: 557 (446 officers - 402 male; 44 female).
| Officers per 1,000 residents here: | 1.70 |
| Texas average: | 2.05 |
Full-time law enforcement employees in 2018, including police officers: 534 (432 officers - 394 male; 38 female).
| Officers per 1,000 residents here: | 1.68 |
| Texas average: | 2.18 |
Full-time law enforcement employees in 2016, including police officers: 526 (392 officers - 363 male; 29 female).
| Officers per 1,000 residents here: | 1.55 |
| Texas average: | 2.11 |
Full-time law enforcement employees in 2015, including police officers: 506 (388 officers - 362 male; 26 female).
| Officers per 1,000 residents here: | 1.57 |
| Texas average: | 2.13 |
Full-time law enforcement employees in 2014, including police officers: 516 (399 officers - 369 male; 30 female).
| Officers per 1,000 residents here: | 1.65 |
| Texas average: | 2.01 |
Full-time law enforcement employees in 2013, including police officers: 547 (399 officers - 370 male; 29 female).
| Officers per 1,000 residents here: | 1.68 |
| Texas average: | 2.05 |
Full-time law enforcement employees in 2012, including police officers: 556 (401 officers - 372 male; 29 female).
| Officers per 1,000 residents here: | 1.69 |
| Texas average: | 1.95 |
Full-time law enforcement employees in 2011, including police officers: 488 (378 officers - 349 male; 29 female).
| Officers per 1,000 residents here: | 1.61 |
| Texas average: | 2.17 |
Full-time law enforcement employees in 2010, including police officers: 513 (382 officers - 355 male; 27 female).
| Officers per 1,000 residents here: | 1.66 |
| Texas average: | 2.20 |
Full-time law enforcement employees in 2009, including police officers: 466 (354 officers - 325 male; 29 female).
| Officers per 1,000 residents here: | 1.59 |
| Texas average: | 2.23 |
Full-time law enforcement employees in 2008, including police officers: 499 (359 officers - 335 male; 24 female).
| Officers per 1,000 residents here: | 1.63 |
| Texas average: | 2.17 |
Full-time law enforcement employees in 2007, including police officers: 521 (365 officers - 340 male; 25 female).
| Officers per 1,000 residents here: | 1.71 |
| Texas average: | 2.18 |
Full-time law enforcement employees in 2006, including police officers: 487 (368 officers - 341 male; 27 female).
| Officers per 1,000 residents here: | 1.71 |
| Texas average: | 2.13 |
Full-time law enforcement employees in 2005, including police officers: 472 (359 officers - 333 male; 26 female).
| Officers per 1,000 residents here: | 1.70 |
| Texas average: | 2.18 |
Full-time law enforcement employees in 2004, including police officers: 395 (304 officers - 281 male; 23 female).
| Officers per 1,000 residents here: | 1.45 |
| Texas average: | 2.19 |
Full-time law enforcement employees in 2003, including police officers: 407 (308 officers - 289 male; 19 female).
| Officers per 1,000 residents here: | 1.49 |
| Texas average: | 2.17 |


Zip codes: 79382, 79401, 79403, 79406, 79407, 79410, 79411, 79412, 79413, 79414, 79415, 79416, 79423, 79424.