Crime rate in Hollywood, Florida (FL): murders, rapes, robberies, assaults, burglaries, thefts, auto thefts, arson, law enforcement employees, police officers, crime map
Crime rate in Hollywood, FL
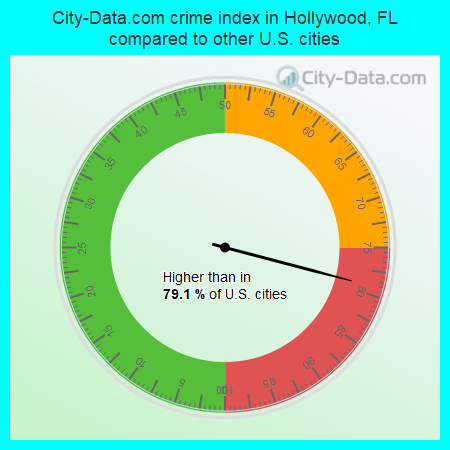
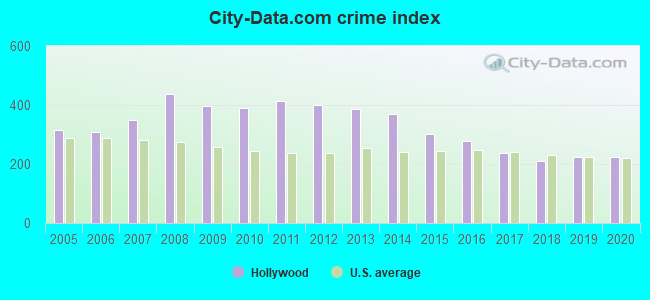
The 2020 crime rate in Hollywood, FL is 224 (City-Data.com crime index), which is about the average for the U.S. cities. It was higher than in 79.1% U.S. cities. The 2020 Hollywood crime rate rose by 0% compared to 2019. The number of homicides stood at 16 - an increase of 6 compared to 2019. In the last 5 years Hollywood has seen decline of violent crime and decreasing property crime.See how dangerous Hollywood, FL is compared to the nearest cities:
(Note: Higher means more crime)
(Note: Higher means more crime)
| Hollywood: | 224.1 |
| Pembroke Park: | 286.8 |
| West Park: | 297.5 |
| Hallandale: | 309.0 |
| Aventura: | 227.2 |
| Golden Beach: | 96.3 |
| North Miami Beach: | 361.1 |
| Sunny Isles Beach: | 83.1 |
| Cooper City: | 75.8 |
The City-Data.com crime index weighs serious crimes and violent crimes more heavily. Higher means more crime, U.S. average is 246.1. It adjusts for the number of visitors and daily workers commuting into cities.
- means the value is smaller than the state average.- means the value is about the same as the state average.
- means the value is bigger than the state average.
- means the value is much bigger than the state average.
According to our research of Florida and other state lists, there were 97 registered sex offenders living in Hollywood, Florida as of May 31, 2024.
The ratio of all residents to sex offenders in Hollywood is 1,567 to 1.
The ratio of registered sex offenders to all residents in this city is much lower than the state average.
Violent crime rate in 2020
| Hollywood: | 205.8 |
| U.S. Average: | 228.2 |
Violent crime rate in 2019
| Hollywood: | 169.5 |
| U.S. Average: | 219.9 |
Violent crime rate in 2018
| Hollywood: | 133.4 |
| U.S. Average: | 221.2 |
Violent crime rate in 2017
| Hollywood: | 161.2 |
| U.S. Average: | 226.2 |
Violent crime rate in 2016
| Hollywood: | 212.5 |
| U.S. Average: | 227.3 |
Violent crime rate in 2015
| Hollywood: | 239.6 |
| U.S. Average: | 219.3 |
Violent crime rate in 2014
| Hollywood: | 280.2 |
| U.S. Average: | 211.1 |
Violent crime rate in 2013
| Hollywood: | 283.3 |
| U.S. Average: | 214.2 |
Violent crime rate in 2012
| Hollywood: | 239.5 |
| U.S. Average: | 187.4 |
Violent crime rate in 2011
| Hollywood: | 252.0 |
| U.S. Average: | 187.1 |
Violent crime rate in 2010
| Hollywood: | 233.4 |
| U.S. Average: | 195.7 |
Violent crime rate in 2009
| Hollywood: | 267.3 |
| U.S. Average: | 208.9 |
Violent crime rate in 2008
| Hollywood: | 316.2 |
| U.S. Average: | 222.5 |
Violent crime rate in 2007
| Hollywood: | 260.8 |
| U.S. Average: | 229.1 |
Violent crime rate in 2006
| Hollywood: | 228.3 |
| U.S. Average: | 232.6 |
Violent crime rate in 2005
| Hollywood: | 237.4 |
| U.S. Average: | 227.0 |
Property crime rate in 2020
| Hollywood: | 175.6 |
| U.S. Average: | 169.6 |
Property crime rate in 2019
| Hollywood: | 211.9 |
| U.S. Average: | 179.7 |
Property crime rate in 2018
| Hollywood: | 226.5 |
| U.S. Average: | 190.2 |
Property crime rate in 2017
| Hollywood: | 254.6 |
| U.S. Average: | 206.4 |
Property crime rate in 2016
| Hollywood: | 277.0 |
| U.S. Average: | 216.6 |
Property crime rate in 2015
| Hollywood: | 310.2 |
| U.S. Average: | 221.5 |
Property crime rate in 2014
| Hollywood: | 392.7 |
| U.S. Average: | 230.8 |
Property crime rate in 2013
| Hollywood: | 415.8 |
| U.S. Average: | 250.4 |
Property crime rate in 2012
| Hollywood: | 512.9 |
| U.S. Average: | 267.3 |
Property crime rate in 2011
| Hollywood: | 529.0 |
| U.S. Average: | 273.5 |
Property crime rate in 2010
| Hollywood: | 498.5 |
| U.S. Average: | 276.4 |
Property crime rate in 2009
| Hollywood: | 467.8 |
| U.S. Average: | 285.6 |
Property crime rate in 2008
| Hollywood: | 480.8 |
| U.S. Average: | 302.2 |
Property crime rate in 2007
| Hollywood: | 364.3 |
| U.S. Average: | 309.2 |
Property crime rate in 2006
| Hollywood: | 330.5 |
| U.S. Average: | 317.3 |
Property crime rate in 2005
| Hollywood: | 336.8 |
| U.S. Average: | 322.3 |


Full-time law enforcement employees in 2021, including police officers: 407 (314 officers - 261 male; 53 female).
| Officers per 1,000 residents here: | 2.04 |
| Florida average: | 2.33 |
Full-time law enforcement employees in 2020, including police officers: 407 (319 officers - 263 male; 56 female).
| Officers per 1,000 residents here: | 2.04 |
| Florida average: | 2.26 |
Full-time law enforcement employees in 2018, including police officers: 394 (300 officers - 249 male; 51 female).
| Officers per 1,000 residents here: | 1.93 |
| Florida average: | 2.21 |
Full-time law enforcement employees in 2017, including police officers: 391 (302 officers - 253 male; 49 female).
| Officers per 1,000 residents here: | 1.96 |
| Florida average: | 2.41 |
Full-time law enforcement employees in 2015, including police officers: 449 (314 officers - 259 male; 55 female).
| Officers per 1,000 residents here: | 2.10 |
| Florida average: | 2.39 |
Full-time law enforcement employees in 2014, including police officers: 456 (311 officers - 262 male; 49 female).
| Officers per 1,000 residents here: | 2.10 |
| Florida average: | 2.29 |
Full-time law enforcement employees in 2013, including police officers: 426 (294 officers - 249 male; 45 female).
| Officers per 1,000 residents here: | 2.00 |
| Florida average: | 2.39 |
Full-time law enforcement employees in 2012, including police officers: 450 (292 officers - 246 male; 46 female).
| Officers per 1,000 residents here: | 2.01 |
| Florida average: | 2.45 |
Full-time law enforcement employees in 2011, including police officers: 465 (305 officers - 257 male; 48 female).
| Officers per 1,000 residents here: | 2.14 |
| Florida average: | 2.35 |
Full-time law enforcement employees in 2010, including police officers: 472 (315 officers - 266 male; 49 female).
| Officers per 1,000 residents here: | 2.24 |
| Florida average: | 2.47 |
Full-time law enforcement employees in 2009, including police officers: 481 (316 officers - 267 male; 49 female).
| Officers per 1,000 residents here: | 2.23 |
| Florida average: | 2.50 |
Full-time law enforcement employees in 2008, including police officers: 479 (314 officers - 267 male; 47 female).
| Officers per 1,000 residents here: | 2.23 |
| Florida average: | 2.43 |
Full-time law enforcement employees in 2007, including police officers: 497 (320 officers - 272 male; 48 female).
| Officers per 1,000 residents here: | 2.18 |
| Florida average: | 2.45 |
Full-time law enforcement employees in 2006, including police officers: 507 (327 officers - 278 male; 49 female).
| Officers per 1,000 residents here: | 2.21 |
| Florida average: | 2.54 |
Full-time law enforcement employees in 2005, including police officers: 510 (331 officers - 285 male; 46 female).
| Officers per 1,000 residents here: | 2.24 |
| Florida average: | 2.40 |
Full-time law enforcement employees in 2004, including police officers: 509 (325 officers - 274 male; 51 female).
| Officers per 1,000 residents here: | 2.22 |
| Florida average: | 2.53 |
Full-time law enforcement employees in 2003, including police officers: 498 (323 officers - 276 male; 47 female).
| Officers per 1,000 residents here: | 2.21 |
| Florida average: | 2.55 |


