Crime rate in Bayonne, New Jersey (NJ): murders, rapes, robberies, assaults, burglaries, thefts, auto thefts, arson, law enforcement employees, police officers, crime map
Crime rate in Bayonne, NJ
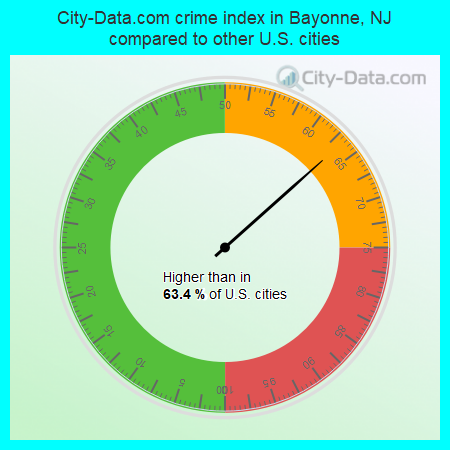
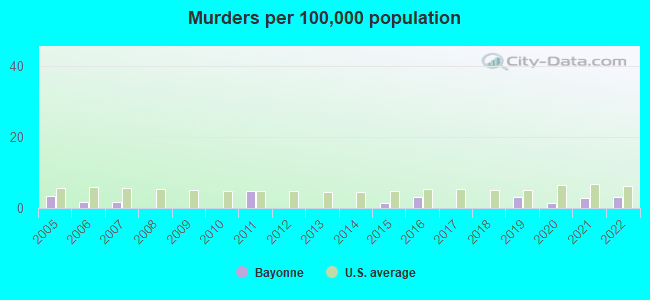
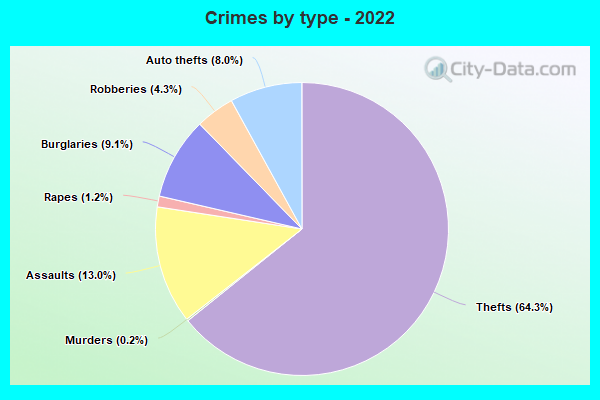
The 2022 crime rate in Bayonne, NJ is 146 (City-Data.com crime index), which is 1.7 times smaller than the U.S. average. It was higher than in 63.4% U.S. cities. The 2022 Bayonne crime rate rose by 50% compared to 2021. The number of homicides stood at 2. In the last 5 years Bayonne has seen rise of violent crime and rise of property crime.See how dangerous Bayonne, NJ is compared to the nearest cities:
(Note: Higher means more crime)
(Note: Higher means more crime)
| Bayonne: | 145.7 |
| Jersey City: | 128.9 |
| Elizabeth: | 267.7 |
| Harrison: | 180.6 |
| Newark: | 273.8 |
| Hillside: | 214.7 |
| East Newark: | 71.3 |
| Kearny: | 140.3 |
| Hoboken: | 111.4 |
The City-Data.com crime index weighs serious crimes and violent crimes more heavily. Higher means more crime, U.S. average is 246.1. It adjusts for the number of visitors and daily workers commuting into cities.
- means the value is smaller than the state average.- means the value is about the same as the state average.
- means the value is bigger than the state average.
According to our research of New Jersey and other state lists, there were 32 registered sex offenders living in Bayonne, New Jersey as of June 04, 2024.
The ratio of all residents to sex offenders in Bayonne is 2,070 to 1.
The ratio of registered sex offenders to all residents in this city is near the state average.
Violent crime rate in 2022
| Bayonne: | 164.2 |
| U.S. Average: | 219.8 |
Violent crime rate in 2021
| Bayonne: | 114.5 |
| U.S. Average: | 224.8 |
Violent crime rate in 2020
| Bayonne: | 96.9 |
| U.S. Average: | 228.2 |
Violent crime rate in 2019
| Bayonne: | 124.6 |
| U.S. Average: | 219.9 |
Violent crime rate in 2018
| Bayonne: | 94.3 |
| U.S. Average: | 221.2 |
Violent crime rate in 2017
| Bayonne: | 112.6 |
| U.S. Average: | 226.2 |
Violent crime rate in 2016
| Bayonne: | 122.3 |
| U.S. Average: | 227.3 |
Violent crime rate in 2015
| Bayonne: | 135.9 |
| U.S. Average: | 219.3 |
Violent crime rate in 2014
| Bayonne: | 115.8 |
| U.S. Average: | 211.1 |
Violent crime rate in 2013
| Bayonne: | 106.2 |
| U.S. Average: | 214.2 |
Violent crime rate in 2012
| Bayonne: | 107.8 |
| U.S. Average: | 187.4 |
Violent crime rate in 2011
| Bayonne: | 128.9 |
| U.S. Average: | 187.1 |
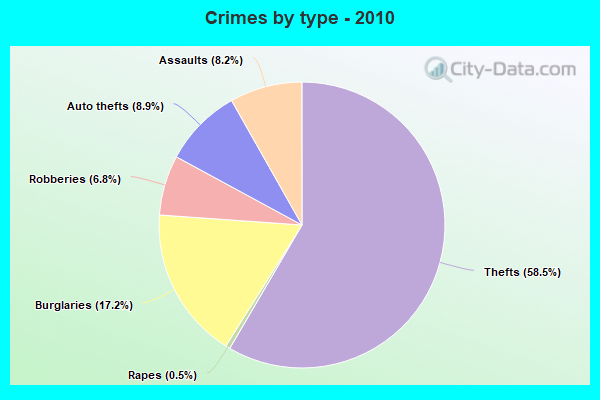
Violent crime rate in 2010
| Bayonne: | 132.5 |
| U.S. Average: | 195.7 |
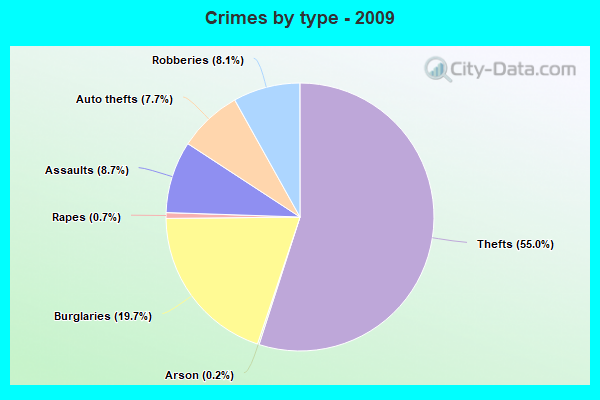
Violent crime rate in 2009
| Bayonne: | 168.5 |
| U.S. Average: | 208.9 |
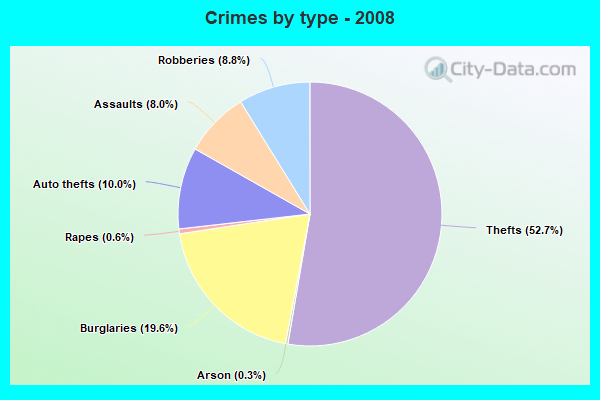
Violent crime rate in 2008
| Bayonne: | 188.9 |
| U.S. Average: | 222.5 |
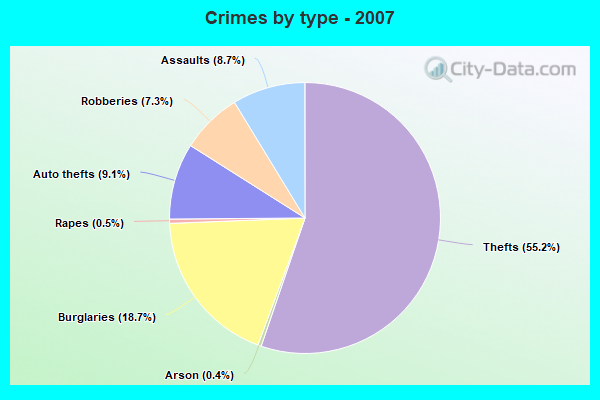
Violent crime rate in 2007
| Bayonne: | 164.5 |
| U.S. Average: | 229.1 |
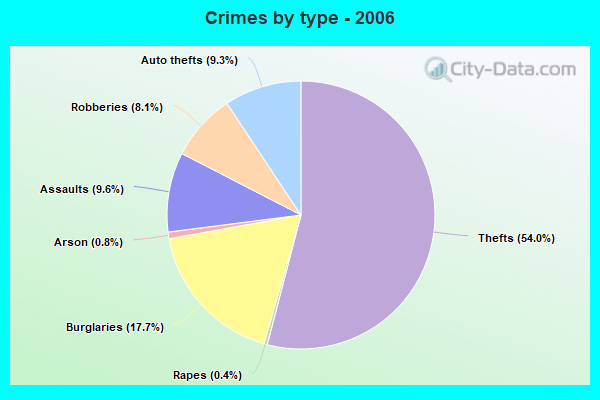
Violent crime rate in 2006
| Bayonne: | 162.2 |
| U.S. Average: | 232.6 |
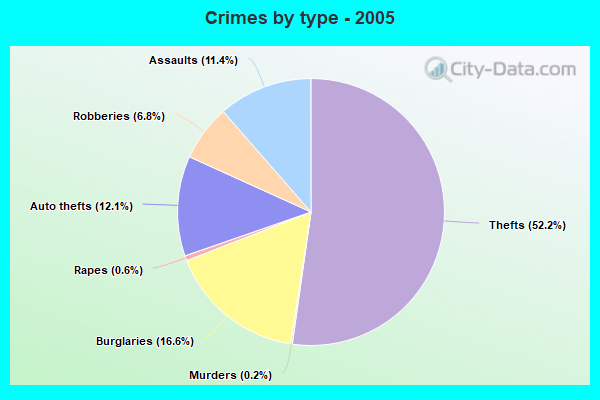
Violent crime rate in 2005
| Bayonne: | 186.3 |
| U.S. Average: | 227.0 |
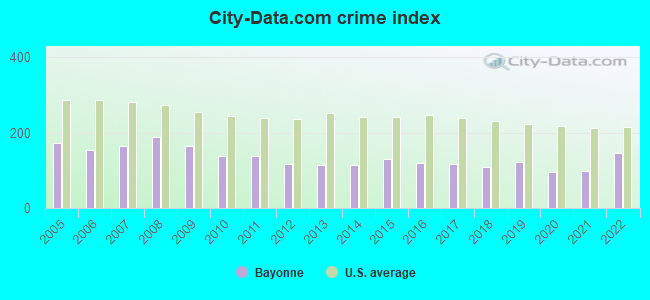
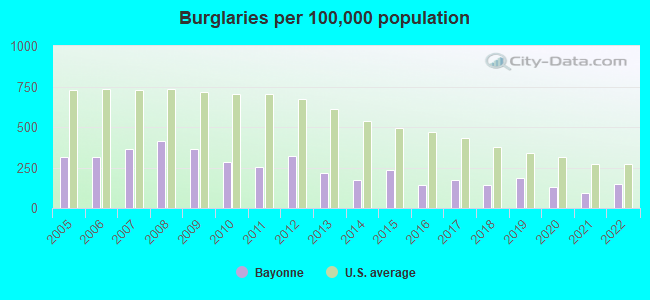
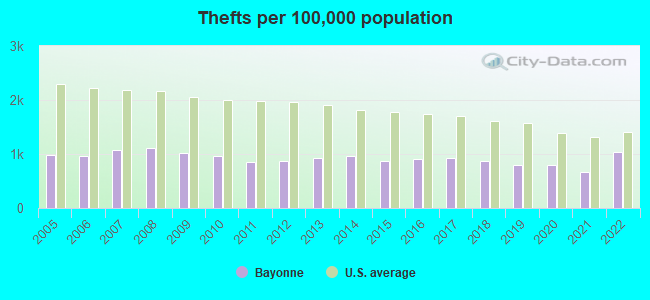
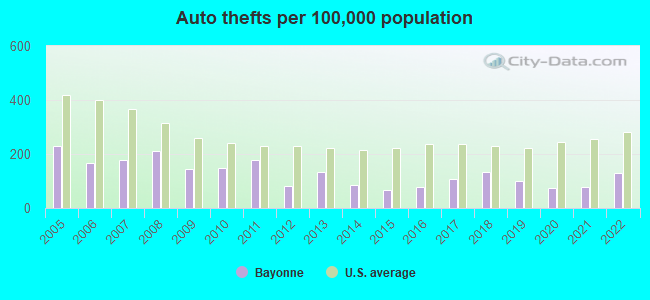
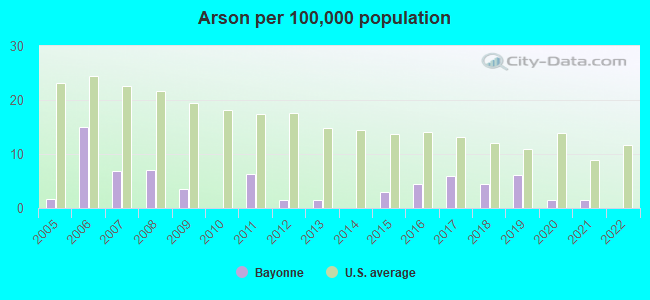
Property crime rate in 2022
| Bayonne: | 100.2 |
| U.S. Average: | 166.5 |
Property crime rate in 2021
| Bayonne: | 62.5 |
| U.S. Average: | 157.8 |
Property crime rate in 2020
| Bayonne: | 76.7 |
| U.S. Average: | 169.6 |
Property crime rate in 2019
| Bayonne: | 91.8 |
| U.S. Average: | 179.7 |
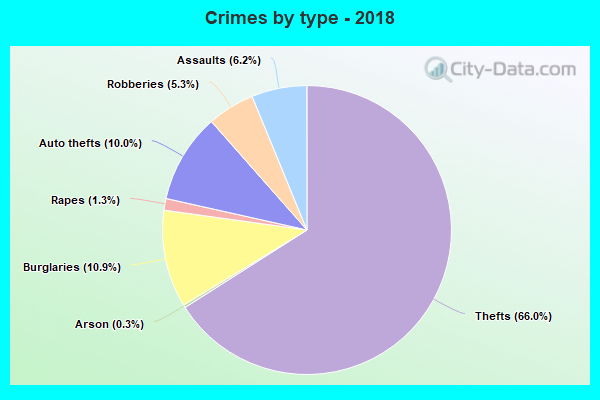
Property crime rate in 2018
| Bayonne: | 92.9 |
| U.S. Average: | 190.2 |
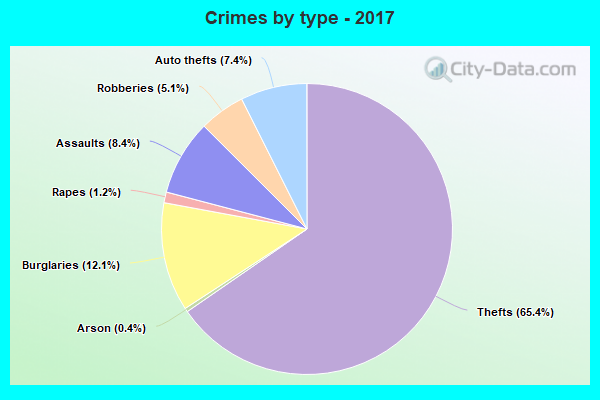
Property crime rate in 2017
| Bayonne: | 96.7 |
| U.S. Average: | 206.4 |
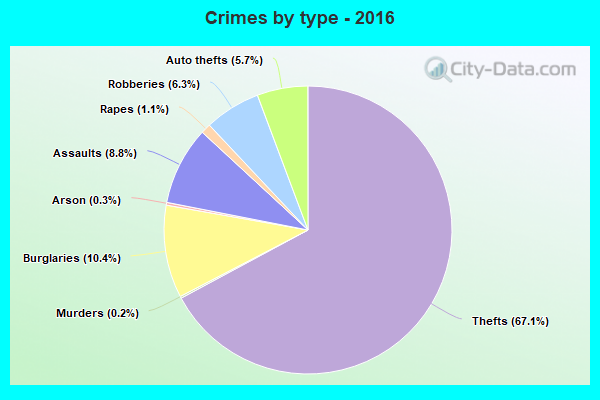
Property crime rate in 2016
| Bayonne: | 84.3 |
| U.S. Average: | 216.6 |
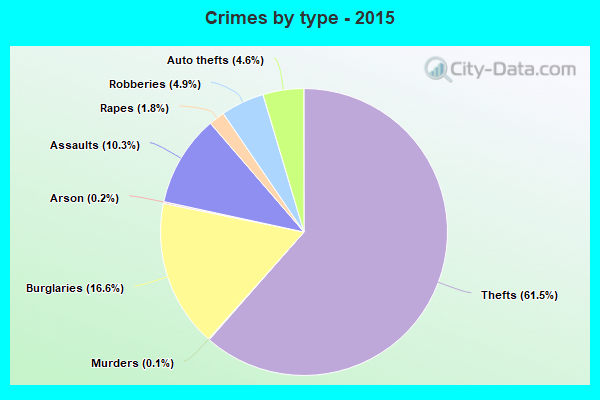
Property crime rate in 2015
| Bayonne: | 100.5 |
| U.S. Average: | 221.5 |
Property crime rate in 2014
| Bayonne: | 95.9 |
| U.S. Average: | 230.8 |
Property crime rate in 2013
| Bayonne: | 109.9 |
| U.S. Average: | 250.4 |
Property crime rate in 2012
| Bayonne: | 119.9 |
| U.S. Average: | 267.3 |
Property crime rate in 2011
| Bayonne: | 119.7 |
| U.S. Average: | 273.5 |
Property crime rate in 2010
| Bayonne: | 127.8 |
| U.S. Average: | 276.4 |
Property crime rate in 2009
| Bayonne: | 146.2 |
| U.S. Average: | 285.6 |
Property crime rate in 2008
| Bayonne: | 170.3 |
| U.S. Average: | 302.2 |
Property crime rate in 2007
| Bayonne: | 148.2 |
| U.S. Average: | 309.2 |
Property crime rate in 2006
| Bayonne: | 131.5 |
| U.S. Average: | 317.3 |
Property crime rate in 2005
| Bayonne: | 142.8 |
| U.S. Average: | 322.3 |


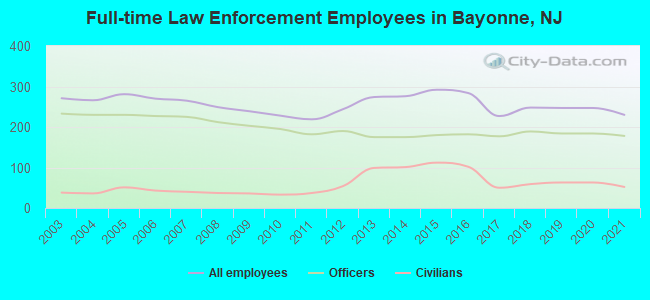
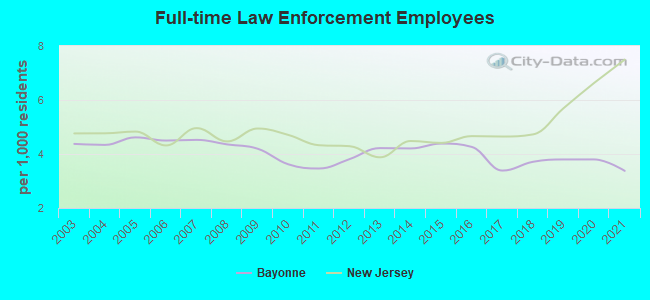
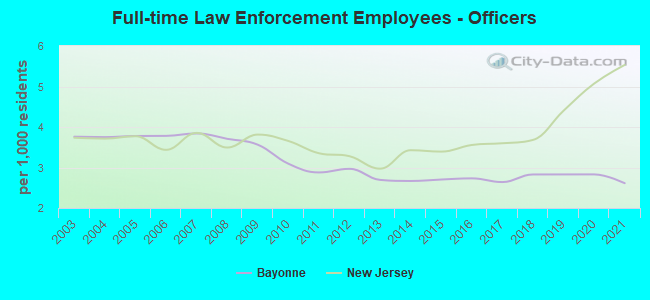
Full-time law enforcement employees in 2021, including police officers: 230 (178 officers - 162 male; 16 female).
| Officers per 1,000 residents here: | 2.61 |
| New Jersey average: | 5.53 |
Full-time law enforcement employees in 2020, including police officers: 247 (184 officers - 168 male; 16 female).
| Officers per 1,000 residents here: | 2.83 |
| New Jersey average: | 5.07 |
Full-time law enforcement employees in 2019, including police officers: 247 (184 officers - 168 male; 16 female).
| Officers per 1,000 residents here: | 2.83 |
| New Jersey average: | 4.40 |
Full-time law enforcement employees in 2018, including police officers: 248 (189 officers - 176 male; 13 female).
| Officers per 1,000 residents here: | 2.83 |
| New Jersey average: | 3.68 |
Full-time law enforcement employees in 2017, including police officers: 227 (177 officers - 164 male; 13 female).
| Officers per 1,000 residents here: | 2.64 |
| New Jersey average: | 3.60 |
Full-time law enforcement employees in 2016, including police officers: 284 (182 officers - 168 male; 14 female).
| Officers per 1,000 residents here: | 2.73 |
| New Jersey average: | 3.56 |
Full-time law enforcement employees in 2015, including police officers: 292 (180 officers - 167 male; 13 female).
| Officers per 1,000 residents here: | 2.70 |
| New Jersey average: | 3.39 |
Full-time law enforcement employees in 2014, including police officers: 276 (175 officers - 162 male; 13 female).
| Officers per 1,000 residents here: | 2.67 |
| New Jersey average: | 3.43 |
Full-time law enforcement employees in 2013, including police officers: 274 (175 officers - 162 male; 13 female).
| Officers per 1,000 residents here: | 2.69 |
| New Jersey average: | 2.97 |
Full-time law enforcement employees in 2012, including police officers: 244 (190 officers - 178 male; 12 female).
| Officers per 1,000 residents here: | 2.97 |
| New Jersey average: | 3.28 |
Full-time law enforcement employees in 2011, including police officers: 219 (182 officers - 171 male; 11 female).
| Officers per 1,000 residents here: | 2.88 |
| New Jersey average: | 3.35 |
Full-time law enforcement employees in 2010, including police officers: 228 (195 officers - 184 male; 11 female).
| Officers per 1,000 residents here: | 3.09 |
| New Jersey average: | 3.66 |
Full-time law enforcement employees in 2009, including police officers: 239 (203 officers - 191 male; 12 female).
| Officers per 1,000 residents here: | 3.56 |
| New Jersey average: | 3.81 |
Full-time law enforcement employees in 2008, including police officers: 249 (212 officers - 201 male; 11 female).
| Officers per 1,000 residents here: | 3.71 |
| New Jersey average: | 3.49 |
Full-time law enforcement employees in 2007, including police officers: 265 (225 officers - 211 male; 14 female).
| Officers per 1,000 residents here: | 3.84 |
| New Jersey average: | 3.86 |
Full-time law enforcement employees in 2006, including police officers: 270 (227 officers - 214 male; 13 female).
| Officers per 1,000 residents here: | 3.78 |
| New Jersey average: | 3.44 |
Full-time law enforcement employees in 2005, including police officers: 281 (230 officers - 218 male; 12 female).
| Officers per 1,000 residents here: | 3.78 |
| New Jersey average: | 3.77 |
Full-time law enforcement employees in 2004, including police officers: 266 (230 officers - 216 male; 14 female).
| Officers per 1,000 residents here: | 3.75 |
| New Jersey average: | 3.71 |
Full-time law enforcement employees in 2003, including police officers: 271 (233 officers - 219 male; 14 female).
| Officers per 1,000 residents here: | 3.76 |
| New Jersey average: | 3.74 |
Zip codes: 07002.