Williamsburg County, South Carolina (SC)
County owner-occupied free and clear houses and condos in 2010: 5,298
County owner-occupied houses and condos in 2000: 11,061
Renter-occupied apartments: 3,226 (it was 2,653 in 2000)
| % of renters here: | 19% |
| State: | 31% |
Land area: 934 sq. mi.
Water area: 3.0 sq. mi.
Population density: 34 people per square mile (low).
Industries providing employment: Educational, health and social services (22.9%), Manufacturing (16.5%), Professional, scientific, management, administrative, and waste management services (10.5%).
Type of workers:
- Private wage or salary: 78%
- Government: 19%
- Self-employed, not incorporated: 3%
- Unpaid family work: 0%
- OSM Map
- General Map
- Google Map
- MSN Map

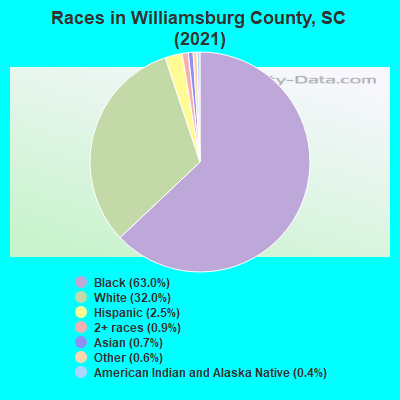
- 19,56762.6%Black Non-Hispanic Alone
- 9,88631.6%White Non-Hispanic Alone
- 9833.1%Hispanic or Latino
- 2580.8%Asian alone
- 2360.8%Some other race alone
- 1940.6%Two or more races
- 1190.4%American Indian and Alaska Native alone
| Median resident age: | 43.7 years |
| South Carolina median age: | 40.5 years |
| Males: 15,396 | |
| Females: 16,322 |

 | Out-of-market OTA TV reception in Columbia area? (60 replies) |
| Williamsburg County, South Carolina: School district taken over by South Carolina Department of Education (3 replies) |
| Since 2000 Charleston has added 238k residents, eclipsing our 2030 forecasts already (94 replies) |
| Our Carolina in pictures (169 replies) |
| Charleston Metro Area Construction (5175 replies) |
| Columbia - general (5183 replies) |
| Williamsburg County: | 2.0 people |
| South Carolina: | 2 people |
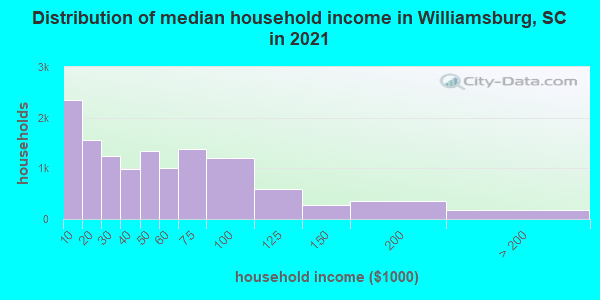
Estimated median household income in 2022: $41,163 ($24,214 in 1999)
| This county: | $41,163 |
| South Carolina: | $64,115 |
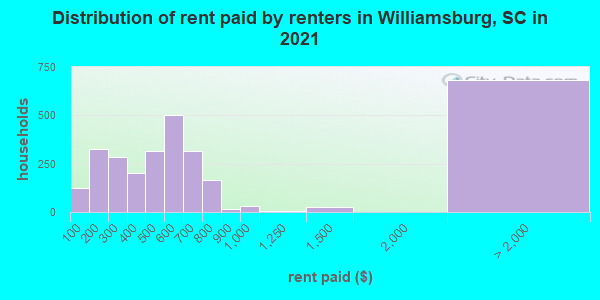
Median contract rent in 2022 for apartments: $524 (lower quartile is $295, upper quartile is $636)
| This county: | $524 |
| State: | $893 |
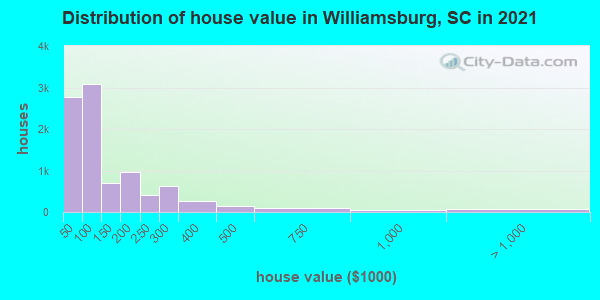
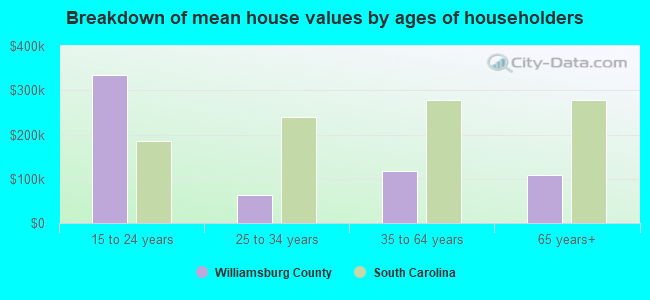
Estimated median house or condo value in 2022: $102,335 (it was $49,100 in 2000)
| Williamsburg: | $102,335 |
| South Carolina: | $254,600 |
Median monthly housing costs for homes and condos with a mortgage: $1,041
Median monthly housing costs for units without a mortgage: $397
Institutionalized population: 1,411
Crime in 2021 (reported by the sheriff's office or county police, not the county total):
- Murders: 0
- Rapes: 10
- Robberies: 8
- Assaults: 108
- Burglaries: 96
- Thefts: 256
- Auto thefts: 65
Crime in 2019 (reported by the sheriff's office or county police, not the county total):
- Murders: 9
- Rapes: 8
- Robberies: 4
- Assaults: 83
- Burglaries: 88
- Thefts: 184
- Auto thefts: 41
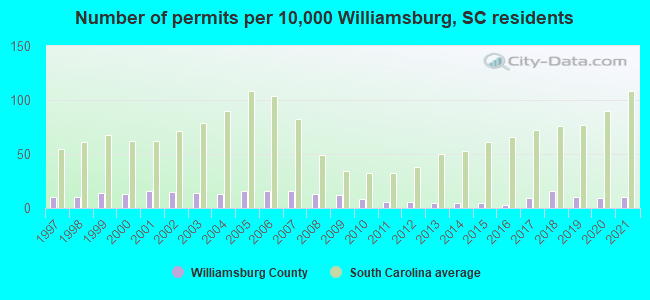
Single-family new house construction building permits:
- 2022: 38 buildings, average cost: $168,900
- 2021: 39 buildings, average cost: $168,400
- 2020: 33 buildings, average cost: $166,700
- 2019: 37 buildings, average cost: $170,800
- 2018: 61 buildings, average cost: $141,100
- 2017: 35 buildings, average cost: $150,300
- 2016: 13 buildings, average cost: $249,600
- 2015: 20 buildings, average cost: $181,600
- 2014: 17 buildings, average cost: $128,100
- 2013: 18 buildings, average cost: $203,600
- 2012: 24 buildings, average cost: $133,200
- 2011: 24 buildings, average cost: $23,600
- 2010: 30 buildings, average cost: $135,100
- 2009: 43 buildings, average cost: $104,600
- 2008: 49 buildings, average cost: $115,300
- 2007: 59 buildings, average cost: $112,500
- 2006: 59 buildings, average cost: $109,300
- 2005: 61 buildings, average cost: $107,000
- 2004: 49 buildings, average cost: $110,000
- 2003: 51 buildings, average cost: $21,400
- 2002: 55 buildings, average cost: $86,000
- 2001: 58 buildings, average cost: $92,800
- 2000: 50 buildings, average cost: $14,300
- 1999: 51 buildings, average cost: $80,800
- 1998: 38 buildings, average cost: $69,200
- 1997: 38 buildings, average cost: $69,800

Median real estate property taxes paid for housing units with mortgages in 2022: $919 (0.7%)
Median real estate property taxes paid for housing units with no mortgage in 2022: $541 (0.7%)
| Williamsburg County: | 22.9% |
| South Carolina: | 14.0% |
Median age of residents in 2022: 43.7 years old
(Males: 40.7 years old, Females: 46.9 years old)
(Median age for: White residents: 49.2 years old, Black residents: 42.4 years old, American Indian residents: 16.7 years old, Asian residents: 37.6 years old, Hispanic or Latino residents: 39.5 years old, Other race residents: 39.2 years old)
Fair market rent in 2006 for a 1-bedroom apartment in Williamsburg County is $420 a month.
Fair market rent for a 2-bedroom apartment is $504 a month.
Fair market rent for a 3-bedroom apartment is $604 a month.
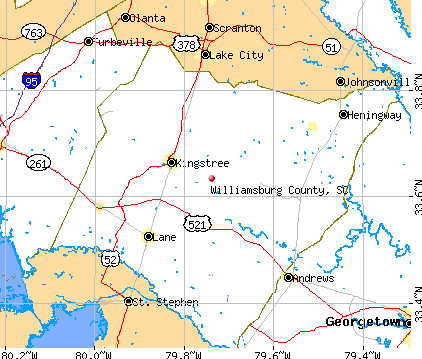
Cities in this county include: Nesmith, Kingstree, Andrews, Cades, Trio, Indian, Lane, Hemingway, Greeleyville, Stuckey.
Neighboring counties: Calhoun County, Mississippi  , Clay County, Alabama , Little River County, Arkansas , Nevada County, Arkansas , Heard County, Georgia , Hunt County, Texas .
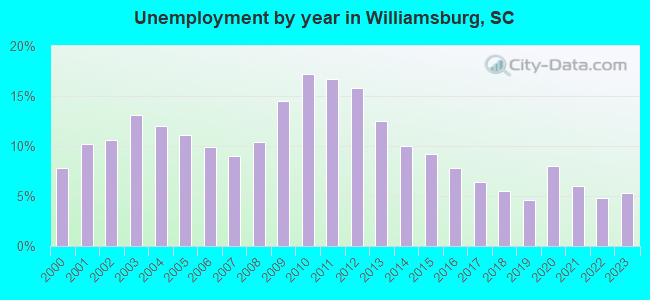
| Here: | 5.1% |
| South Carolina: | 3.1% |

Current college students: 1,289
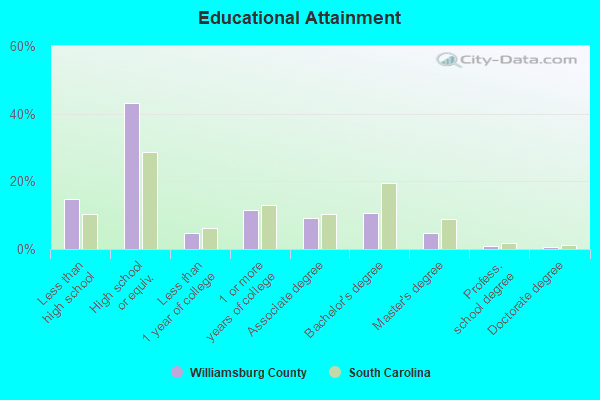
People 25 years of age or older with a high school degree or higher: 82.9%
People 25 years of age or older with a bachelor's degree or higher: 15.2%
Number of foreign born residents: 1,013 (15.3% naturalized citizens)
| Williamsburg County: | 3.2% |
| Whole state: | 5.2% |
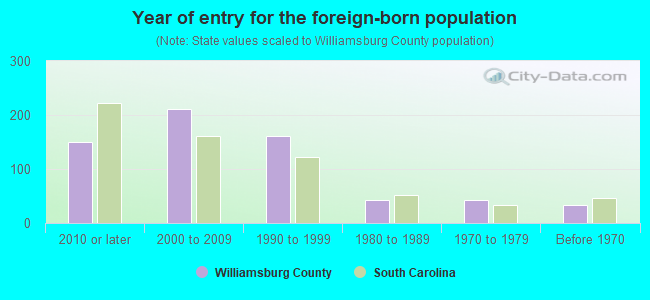
- Year of entry for the foreign-born population
- 2342010 or later
- 4632000 to 2009
- 2001990 to 1999
- 421980 to 1989
- 421970 to 1979
- 33Before 1970
Mean travel time to work (commute): minutes
Percentage of county residents living and working in this county: 98.2%
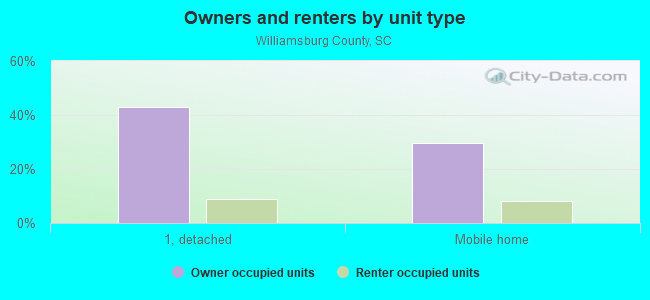
Housing units in structures:
- One, detached: 7,790
- One, attached: 59
- Two: 195
- 3 or 4: 425
- 5 to 9: 294
- 10 to 19: 36
- 20 or more: 28
- Mobile homes: 6,159
- Boats, RVs, vans, etc.: 54
Housing units in Williamsburg County with a mortgage: 3,175 (115 second mortgage, 2 home equity loan, 64 both second mortgage and home equity loan)
Houses without a mortgage: 95
| Here: | 3.1% with mortgage |
| State: | 97.3% with mortgage |
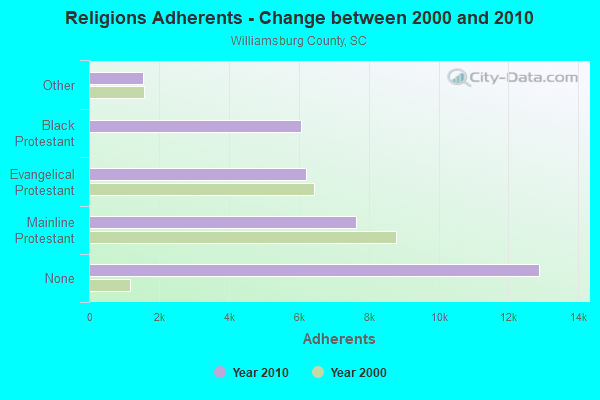
Religion statistics for Williamsburg County
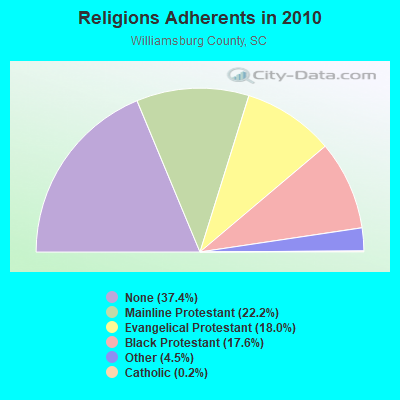
| Religion | Adherents | Congregations |
|---|---|---|
| Mainline Protestant | 7,632 | 43 |
| Evangelical Protestant | 6,201 | 47 |
| Black Protestant | 6,067 | 30 |
| Other | 1,550 | 2 |
| Catholic | 85 | 1 |
| None | 12,888 | - |
Source: Clifford Grammich, Kirk Hadaway, Richard Houseal, Dale E.Jones, Alexei Krindatch, Richie Stanley and Richard H.Taylor. 2012. 2010 U.S.Religion Census: Religious Congregations & Membership Study. Association of Statisticians of American Religious Bodies. Jones, Dale E., et al. 2002. Congregations and Membership in the United States 2000. Nashville, TN: Glenmary Research Center.
Food Environment Statistics:
| Williamsburg County: | 2.26 / 10,000 pop. |
| State: | 1.99 / 10,000 pop. |
| This county: | 1.41 / 10,000 pop. |
| South Carolina: | 0.85 / 10,000 pop. |
| Williamsburg County: | 5.94 / 10,000 pop. |
| South Carolina: | 5.38 / 10,000 pop. |
| This county: | 3.39 / 10,000 pop. |
| State: | 7.75 / 10,000 pop. |
| Williamsburg County: | 13.2% |
| South Carolina: | 10.6% |
| Williamsburg County: | 39.5% |
| State: | 29.4% |
| Here: | 13.7% |
| State: | 13.4% |
Agriculture in Williamsburg County:
Average size of farms: 302 acresAverage value of agricultural products sold per farm: $40,594
Average value of crops sold per acre for harvested cropland: $361.61
The value of nursery, greenhouse, floriculture, and sod as a percentage of the total market value of agricultural products sold: 9.94%
The value of livestock, poultry, and their products as a percentage of the total market value of agricultural products sold: 19.09%
Average total farm production expenses per farm: $52,757
Harvested cropland as a percentage of land in farms: 30.04%
Irrigated harvested cropland as a percentage of land in farms: 1.18%
Average market value of all machinery and equipment per farm: $61,329
The percentage of farms operated by a family or individual: 91.04%
Average age of principal farm operators: 58 years
Average number of cattle and calves per 100 acres of all land in farms: 2.36
Milk cows as a percentage of all cattle and calves: 0.12%
Corn for grain: 12235 harvested acres
All wheat for grain: 4145 harvested acres
Upland cotton: 20949 harvested acres
Soybeans for beans: 17674 harvested acres
Vegetables: 917 harvested acres
Land in orchards: 23 acres
Earthquake activity:
Williamsburg County-area historical earthquake activity is significantly above South Carolina state average. It is 48% smaller than the overall U.S. average.On 11/22/1974 at 05:25:55, a magnitude 4.7 (4.7 MB, Class: Light, Intensity: IV - V) earthquake occurred 55.8 miles away from Williamsburg County center
On 8/23/2011 at 17:51:04, a magnitude 5.8 (5.8 MW, Depth: 3.7 mi, Class: Moderate, Intensity: VI - VII) earthquake occurred 312.7 miles away from the county center
On 8/21/1992 at 16:31:55, a magnitude 4.4 (4.1 MB, 4.1 LG, 4.4 LG, Depth: 6.2 mi) earthquake occurred 45.8 miles away from the county center
On 8/2/1974 at 08:52:09, a magnitude 4.9 (4.3 MB, 4.9 LG) earthquake occurred 158.9 miles away from the county center
On 8/9/2020 at 12:07:37, a magnitude 5.1 (5.1 MW, Depth: 4.7 mi) earthquake occurred 211.0 miles away from Williamsburg County center
On 4/17/1995 at 13:45:57, a magnitude 3.9 (3.9 LG, Depth: 6.2 mi, Class: Light, Intensity: II - III) earthquake occurred 51.1 miles away from the county center
Magnitude types: regional Lg-wave magnitude (LG), body-wave magnitude (MB), moment magnitude (MW)
Most recent natural disasters:
- South Carolina Covid-19 Pandemic, Incident Period: January 20, 2020, FEMA Id: 4492, Natural disaster type: Other
- South Carolina Hurricane Dorian, Incident Period: August 31, 2019 - September 6, 2019, FEMA Id: 4464, Natural disaster type: Hurricane
- South Carolina Hurricane Florence, Incident Period: September 8, 2018 - October 8, 2018, FEMA Id: 4394, Natural disaster type: Hurricane
- South Carolina Hurricane Irma, Incident Period: September 6, 2017 - September 13, 2017, FEMA Id: 4346, Natural disaster type: Hurricane
- South Carolina Hurricane Matthew, Incident Period: October 04, 2016 to October 30, 2016, Emergency Declared EM-3378: October 06, 2016, FEMA Id: 3378, Natural disaster type: Hurricane
- South Carolina Hurricane Matthew, Incident Period: October 04, 2016 to October 30, 2016, Major Disaster (Presidential) Declared DR-4286: October 11, 2016, FEMA Id: 4286, Natural disaster type: Hurricane
- South Carolina Severe Storms and Flooding, Incident Period: October 01, 2015 to October 23, 2015, Emergency Declared EM-3373: October 03, 2015, FEMA Id: 3373, Natural disaster type: Storm, Flood
- South Carolina Severe Storms and Flooding, Incident Period: October 01, 2015 to October 23, 2015, Major Disaster (Presidential) Declared DR-4241: October 05, 2015, FEMA Id: 4241, Natural disaster type: Storm, Flood
- South Carolina Severe Winter Storm, Incident Period: February 10, 2014 to February 19, 2014, Emergency Declared EM-3369: February 12, 2014, FEMA Id: 3369, Natural disaster type: Winter Storm
- South Carolina Severe Winter Storm, Incident Period: February 10, 2014 to February 15, 2014, Major Disaster (Presidential) Declared DR-4166: March 12, 2014, FEMA Id: 4166, Natural disaster type: Winter Storm
- 9 other natural disasters have been reported since 1953.
The number of natural disasters in Williamsburg County (19) is greater than the US average (15).
Major Disasters (Presidential) Declared: 10
Emergencies Declared: 5
Causes of natural disasters: Hurricanes: 10, Winter Storms: 3, Floods: 2, Storms: 2, Tropical Storms: 2, Ice Storm: 1, Other: 1 (Note: some incidents may be assigned to more than one category).
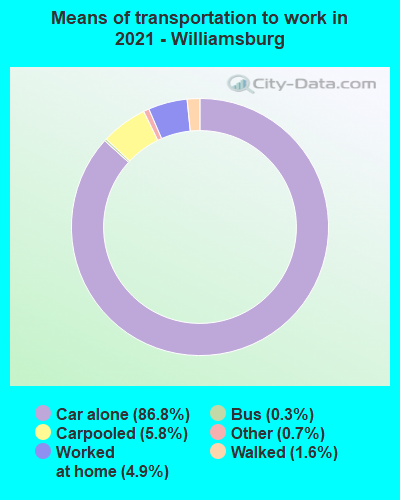
Means of transportation to work:
- Drove a car alone: 8,498 (82.5%)
- Carpooled: 565 (5.5%)
- Bus: 13 (0.1%)
- Taxicab, motorcycle, or other means: 105 (1.0%)
- Walked: 120 (1.2%)
- Worked at home: 901 (8.7%)

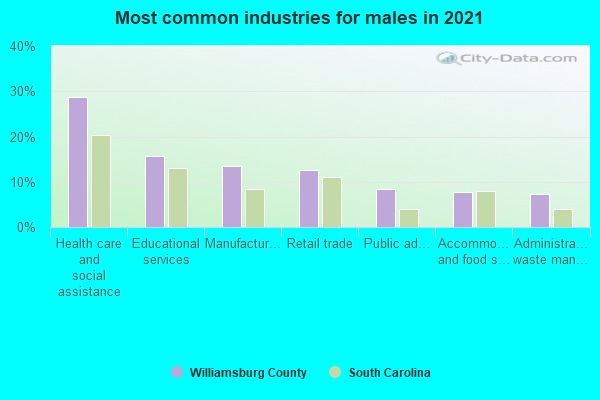
- Health care and social assistance (28%)
- Educational services (15%)
- Retail trade (13%)
- Manufacturing (10%)
- Administrative and support and waste management services (7%)
- Accommodation and food services (6%)
- Public administration (6%)
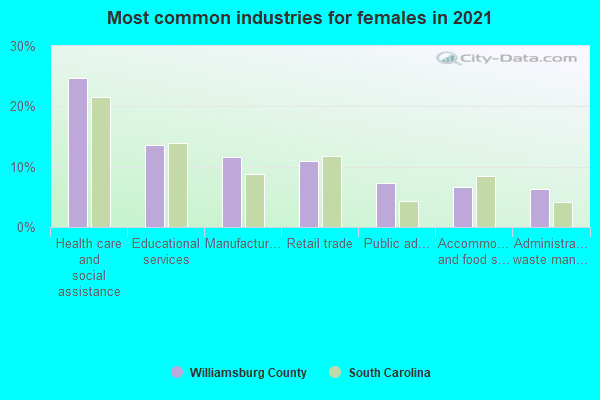
- Health care and social assistance (26%)
- Educational services (14%)
- Retail trade (12%)
- Manufacturing (10%)
- Administrative and support and waste management services (7%)
- Accommodation and food services (6%)
- Public administration (6%)
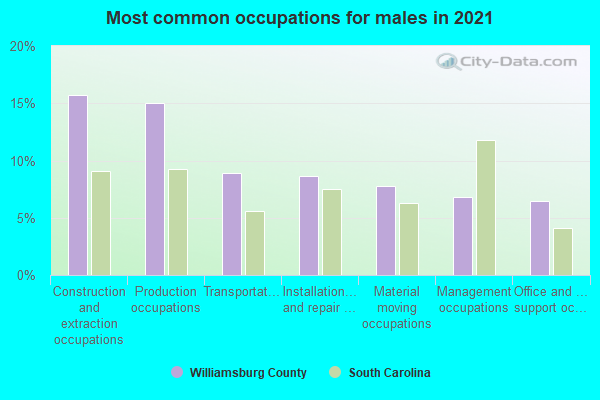
- Production occupations (17%)
- Construction and extraction occupations (13%)
- Transportation occupations (12%)
- Office and administrative support occupations (7%)
- Management occupations (7%)
- Installation, maintenance, and repair occupations (7%)
- Material moving occupations (6%)
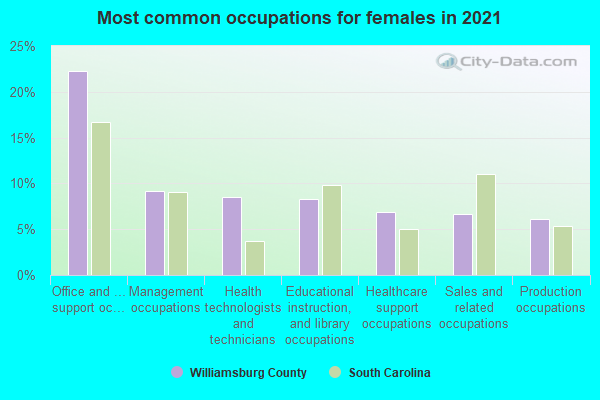
- Office and administrative support occupations (25%)
- Educational instruction, and library occupations (10%)
- Health technologists and technicians (8%)
- Management occupations (8%)
- Healthcare support occupations (7%)
- Sales and related occupations (7%)
- Building and grounds cleaning and maintenance occupations (5%)
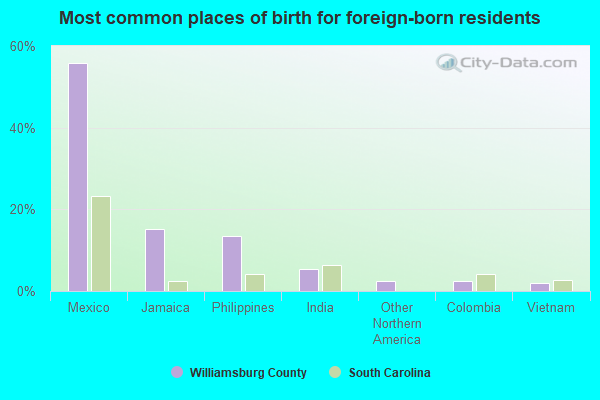
- Mexico (59%)
- Philippines (12%)
- Jamaica (7%)
- India (6%)
- Dominican Republic (2%)
- Bahamas (2%)
- El Salvador (1%)
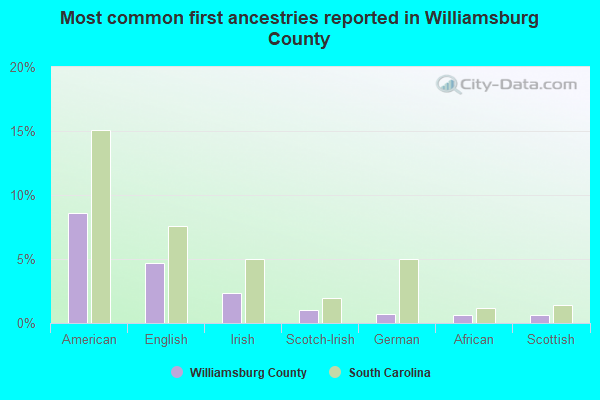
- American (9%)
- English (4%)
- Irish (3%)
- Scotch-Irish (2%)
- African (1%)
- German (1%)
- Eastern European (1%)
People in group quarters in Williamsburg County, South Carolina in 2010:
- 1,162 people in federal prisons
- 177 people in nursing facilities/skilled-nursing facilities
- 72 people in federal detention centers
- 37 people in residential treatment centers for adults
- 19 people in group homes intended for adults
- 6 people in other noninstitutional facilities
- 3 people in emergency and transitional shelters (with sleeping facilities) for people experiencing homelessness
People in group quarters in Williamsburg County, South Carolina in 2000:
- 172 people in nursing homes
- 75 people in local jails and other confinement facilities (including police lockups)
- 39 people in other noninstitutional group quarters
- 17 people in mental (psychiatric) hospitals or wards
- 17 people in homes for the mentally ill
- 15 people in wards in general hospitals for patients who have no usual home elsewhere
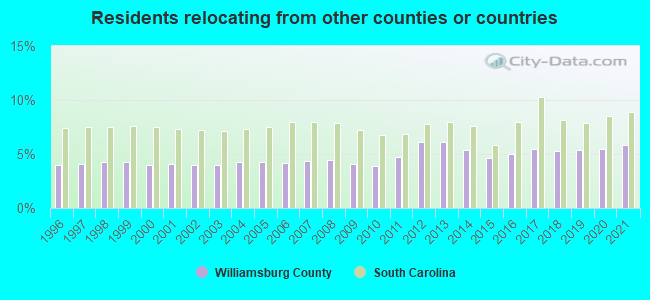
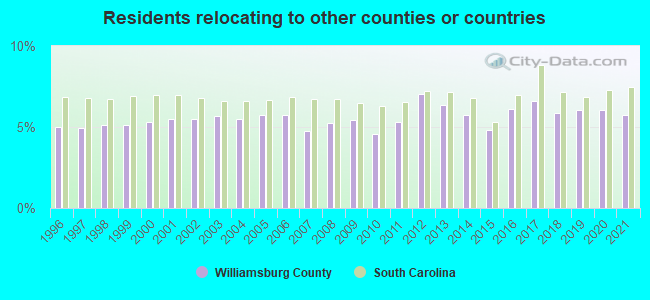
5.87% of this county's 2021 resident taxpayers lived in other counties in 2020 ($33,720 average adjusted gross income)
| Here: | 5.87% |
| South Carolina average: | 8.89% |
10 or fewer of this county's residents moved from foreign countries.
4.11% relocated from other counties in South Carolina ($25,658 average AGI)
1.76% relocated from other states ($8,062 average AGI)
Williamsburg County: 1.76% South Carolina average: 4.96%
Top counties from which taxpayers relocated into this county between 2020 and 2021:
| from Florence County, SC | |
| from Georgetown County, SC | |
| from Horry County, SC | |
| from Clarendon County, SC | |
| from Berkeley County, SC | |
| from Richland County, SC |
5.76% of this county's 2020 resident taxpayers moved to other counties in 2021 ($32,641 average adjusted gross income)
| Here: | 5.76% |
| South Carolina average: | 7.46% |
10 or fewer of this county's residents moved to foreign countries.
4.38% relocated to other counties in South Carolina ($25,438 average AGI)
1.38% relocated to other states ($7,203 average AGI)
Williamsburg County: 1.38% South Carolina average: 3.47%
Top counties to which taxpayers relocated from this county between 2020 and 2021:
| to Florence County, SC | |
| to Georgetown County, SC | |
| to Horry County, SC | |
| to Clarendon County, SC | |
| to Richland County, SC | |
| to Charleston County, SC | |
| to Berkeley County, SC |
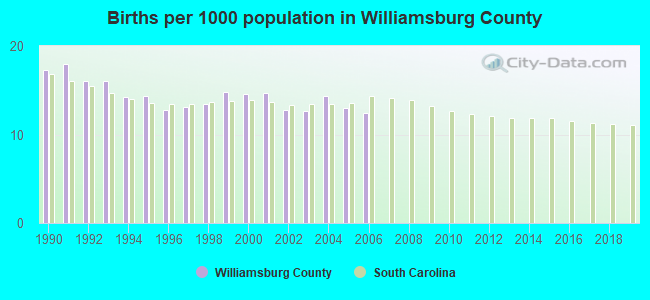
Births per 1000 population from 1990 to 1999: 15.0
Births per 1000 population from 2000 to 2006: 13.5
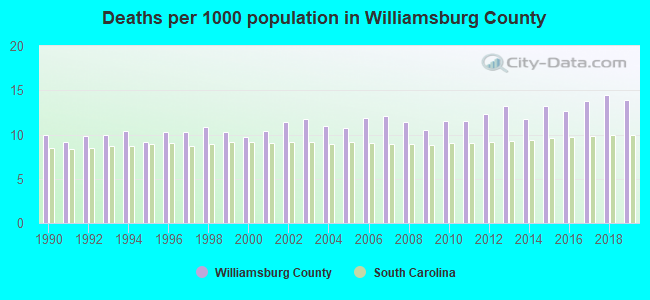
Deaths per 1000 population from 1990 to 1999: 10.0
Deaths per 1000 population from 2000 to 2009: 11.1
Deaths per 1000 population from 2010 to 2020: 13.4
Infant deaths per 1000 live births from 1990 to 1999: 15.9
Infant deaths per 1000 live births from 2000 to 2006: 15.2

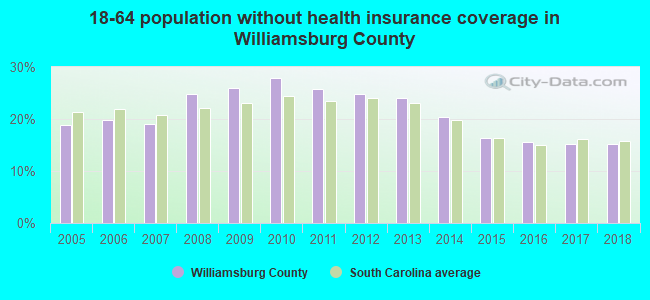
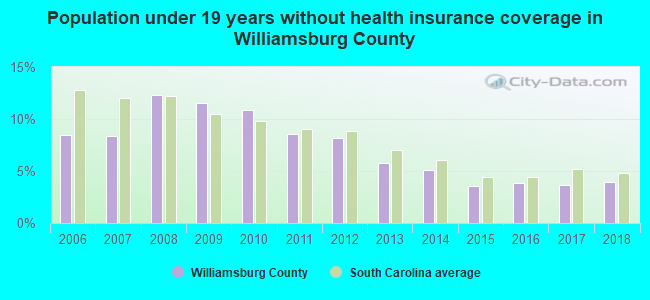
Persons under 19 years old without health insurance coverage in 2018: 3.9%


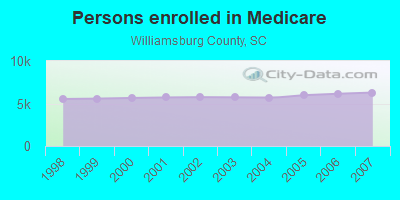
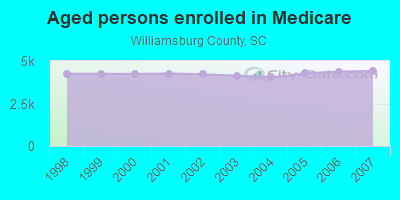
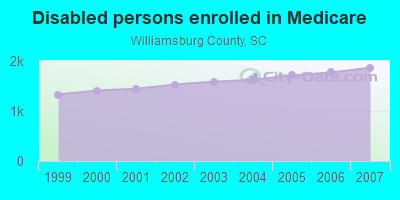
Persons enrolled in hospital insurance and/or supplemental medical insurance (Medicare) in July 1, 2007: 6,289 (4,420 aged, 1,869 disabled)
Children under 18 without health insurance coverage in 2007: 631 (7%)
Most common underlying causes of death in Williamsburg County, South Carolina in 1999 - 2019:
- Bronchus or lung, unspecified - Malignant neoplasms (486)
- Acute myocardial infarction, unspecified (454)
- Atherosclerotic heart disease (328)
- Stroke, not specified as haemorrhage or infarction (286)
- Unspecified diabetes mellitus, without complications (276)
- Congestive heart failure (196)
- Unspecified dementia (134)
- Alzheimer disease, unspecified (125)
- Septicaemia, unspecified (118)
- Chronic obstructive pulmonary disease, unspecified (88)
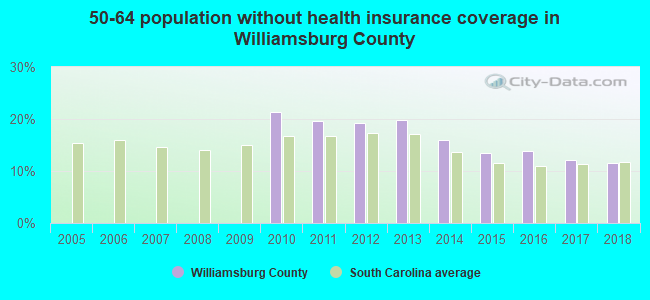
Population without health insurance coverage in 2000: 21%
Children under 18 without health insurance coverage in 2000: 16%
Short term general hospital admissions per 100,000 population in 2004: 4,241
Short term general hospital beds per 100,000 population in 2004: 96
Emergency room visits per 100,000 population in 2004: 35,726
General practice office based MDs per 100,000 population in 2005: 1,582
Medical specialist MDs per 100,000 population in 2005: 1,144
Dentists per 100,000 population in 1998: 6
Total births per 100,000 population, July 2005 - July 2006 : 11
Total deaths per 100,000 population, July 2005 - July 2006: 20
Crimes per 100,000 population in 1996: 1
Homicides per 1,000,000 population from 2000 to 2006: 119.8. This is more than state average.

- Firearm - 91.8
- Other - 27.9
Household type by relationship:
Households: 31,718- Male householders: 5,144 (1,790 living alone), Female householders: 7,547 (2,791 living alone)
4,856 spouses (4,856 opposite-sex spouses), 380 unmarried partners, (365 opposite-sex unmarried partners), 8,905 children (8,347 natural, 260 adopted, 292 stepchildren), 1,553 grandchildren, 438 brothers or sisters, 375 parents, 154 foster children, 476 other relatives, 309 non-relatives
- In group quarters: 1,569
Size of family households: 3,572 2-persons, 1,961 3-persons, 1,090 4-persons, 699 5-persons, 243 6-persons, 134 7-or-more-persons.
Size of nonfamily households: 4,585 1-person, 352 2-persons, 7 5-persons.
2,926 married couples with children.
1,548 single-parent households (225 men, 1,323 women).
96.4% of residents of Williamsburg speak English at home.
2.7% of residents speak Spanish at home (32% speak English very well, 19% speak English well, 46% speak English not well, 3% don't speak English at all).
0.4% of residents speak other Indo-European language at home (84% speak English very well, 16% speak English not well).
0.4% of residents speak Asian or Pacific Island language at home (53% speak English very well, 47% speak English well).
0.1% of residents speak other language at home (100% speak English very well).
In fiscal year 2004:
Federal Government expenditure: $256,028,000 ($7,238 per capita)
Department of Defense expenditure: $9,536,000
Federal direct payments to individuals for retirement and disability: $85,642,000
Federal other direct payments to individuals: $49,794,000
Federal direct payments not to individuals: $8,019,000
Federal grants: $91,102,000
Federal procurement contracts: $10,145,000 ($93,000 Department of Defense)
Federal salaries and wages: $11,326,000 ($6,051,000 Department of Defense)
Federal Government direct loans: $1,811,000
Federal guaranteed/insured loans: $39,818,000
Federal Government insurance: $24,272,000
Population change from April 1, 2000 to July 1, 2005:
Births: 2,664| Here: | 75 per 1000 residents |
| State: | 69 per 1000 residents |
Deaths: 2,118
| Here: | 60 per 1000 residents |
| State: | 46 per 1000 residents |
Net international migration: +41
| Here: | +1 per 1000 residents |
| State: | +9 per 1000 residents |
Net internal migration: -2,337
| Here: | |
| State: |
Total withdrawal of fresh water for public supply: 1.64 millions of gallons per day (all from ground)
| Here: | 6.2 |
| State: | 6.4 |
| Here: | 4.6 |
| State: | 4.5 |
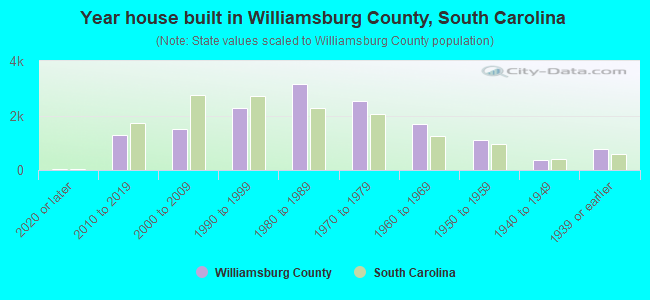
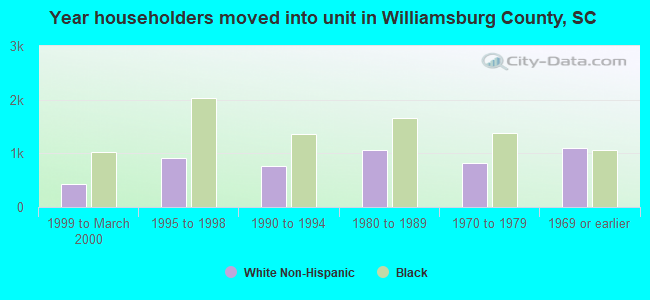
- Year house built in Williamsburg County, South Carolina
- 602020 or later
- 1,3822010 to 2019
- 1,8352000 to 2009
- 2,3051990 to 1999
- 3,1511980 to 1989
- 2,2641970 to 1979
- 1,4381960 to 1969
- 1,1401950 to 1959
- 3711940 to 1949
- 7571939 or earlier
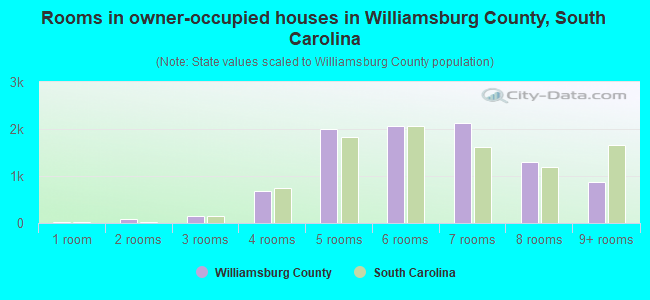
- Rooms in owner-occupied houses in Williamsburg County, South Carolina
- 341 room
- 872 rooms
- 1113 rooms
- 6344 rooms
- 2,3795 rooms
- 1,9966 rooms
- 2,0747 rooms
- 1,3038 rooms
- 8449+ rooms

- Rooms in renter-occupied apartments in Williamsburg County, South Carolina
- 401 room
- 1182 rooms
- 5643 rooms
- 8824 rooms
- 6675 rooms
- 4036 rooms
- 2347 rooms
- 878 rooms
- 1719+ rooms
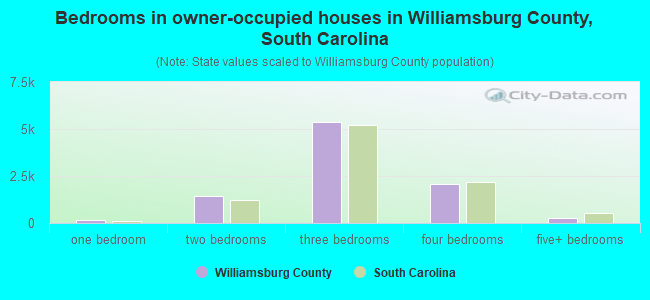
- Bedrooms in owner-occupied houses in Williamsburg County, South Carolina
- 33no bedroom
- 1481 bedroom
- 1,3222 bedrooms
- 5,5733 bedrooms
- 2,0894 bedrooms
- 3265+ bedrooms
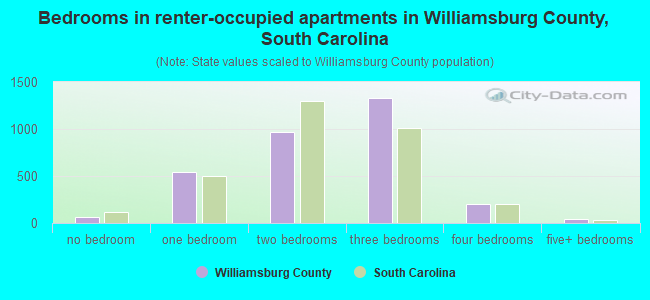
- Bedrooms in renter-occupied apartments in Williamsburg County, South Carolina
- 41no bedroom
- 6461 bedroom
- 1,0812 bedrooms
- 1,1833 bedrooms
- 1694 bedrooms
- 585+ bedrooms
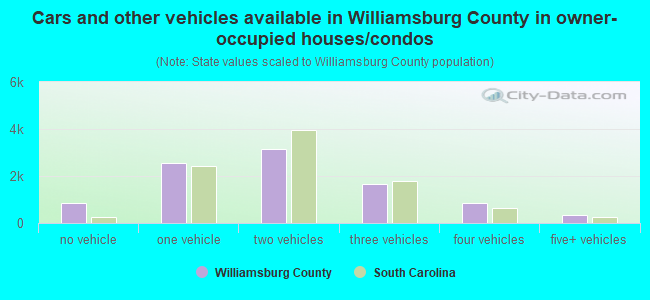
- Cars and other vehicles available in Williamsburg County in owner-occupied houses/condos
- 770no vehicle
- 2,7061 vehicle
- 3,1242 vehicles
- 1,5883 vehicles
- 8654 vehicles
- 4295+ vehicles
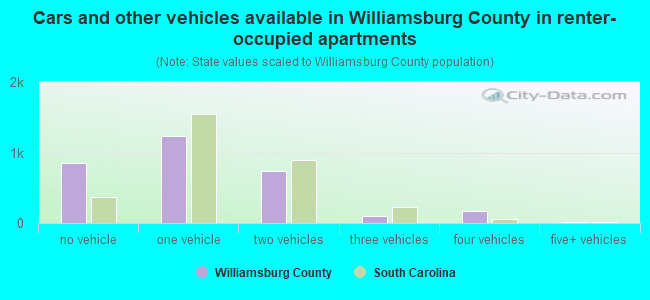
- Cars and other vehicles available in Williamsburg County in renter-occupied apartments
- 934no vehicle
- 1,2751 vehicle
- 7682 vehicles
- 563 vehicles
- 1024 vehicles
- 05+ vehicles
91.8% of Williamsburg County residents lived in the same house 1 years ago.
Out of people who lived in different houses, 30% lived in this county.
Out of people who lived in different counties, 75% lived in South Carolina.
| Williamsburg County: | 91.8% |
| State average: | 86.5% |
Place of birth for U.S.-born residents:
- This state: 25,057
- Other state: 4,887
- Northeast: 1,919
- Midwest: 476
- South: 2,244
- West: 237
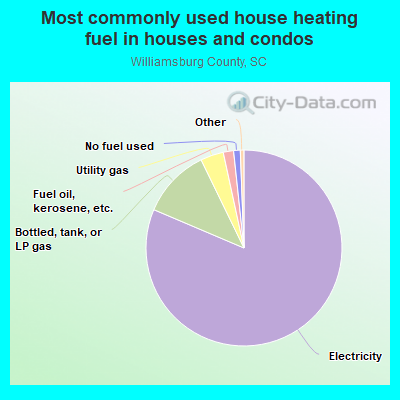
- 82.6%Electricity
- 10.6%Bottled, tank, or LP gas
- 3.7%Utility gas
- 1.6%Fuel oil, kerosene, etc.
- 1.1%No fuel used
- 0.2%Wood
- 0.2%Other fuel
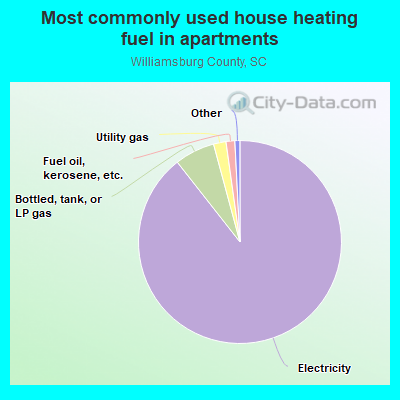
- 89.7%Electricity
- 7.1%Bottled, tank, or LP gas
- 1.6%Fuel oil, kerosene, etc.
- 1.2%Utility gas
- 0.3%No fuel used
- 0.1%Wood
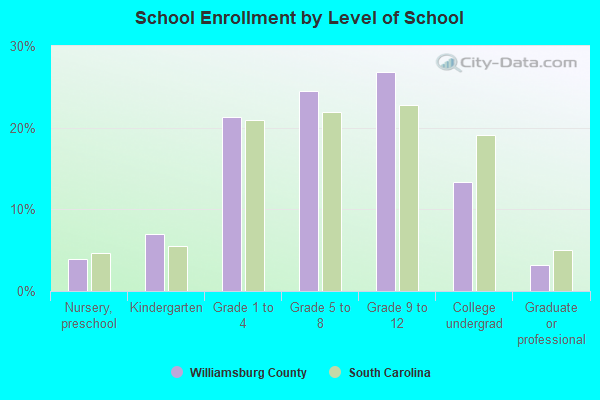
Private vs. public school enrollment:
| Here: | 7.9% |
| South Carolina: | 14.4% |
| Here: | 8.1% |
| South Carolina: | 11.1% |
| Here: | 21.5% |
| South Carolina: | 21.9% |


Williamsburg County government finances - Expenditure in 2018:
- Charges - Other: $3,933,000
Regular Highways: $913,000
Sewerage: $507,000
- Construction - General - Other: $1,406,000
- Current Operations - General - Other: $8,077,000
Police Protection: $2,985,000
Solid Waste Management: $2,924,000
Health - Other: $2,880,000
Correctional Institutions: $2,294,000
Transit Utilities: $1,810,000
Judicial and Legal Services: $1,594,000
Regular Highways: $1,459,000
Local Fire Protection: $1,288,000
Financial Administration: $1,192,000
Central Staff Services: $954,000
General Public Buildings: $832,000
Libraries: $706,000
Parks and Recreation: $548,000
Water Utilities: $495,000
Public Welfare - Other: $494,000
Sewerage: $394,000
Protective Inspection and Regulation - Other: $208,000
- Federal Intergovernmental - Other: $1,103,000
Water Utilities: $24,000
- General - Interest on Debt: $1,574,000
- Long Term Debt - Beginning Outstanding - Public Debt for Private Purpose: $29,110,000
Outstanding Nonguaranteed - Industrial Revenue: $28,735,000
Beginning Outstanding - Unspecified Public Purpose: $22,273,000
Outstanding Unspecified Public Purpose: $21,611,000
Retired Unspecified Public Purpose: $662,000
Retired Nonguaranteed - Public Debt for Private Purpose: $375,000
- Miscellaneous - General Revenue - Other: $1,493,000
Fines and Forfeits: $535,000
Interest Earnings: $2,000
- Other Capital Outlay - General - Other: $650,000
Transit Utilities: $221,000
Solid Waste Management: $147,000
Water Utilities: $144,000
Local Fire Protection: $45,000
Sewerage: $42,000
Police Protection: $10,000
Health - Other: $7,000
- Other Funds - Cash and Securities: $5,187,000
- Revenue - Water Utilities: $1,578,000
Transit Utilities: $809,000
- Sinking Funds - Cash and Securities: $32,802,000
- State Intergovernmental - Other: $2,908,000
Highways: $2,850,000
General Local Government Support: $1,818,000
Water Utilities: $1,419,000
Transit Utilities: $979,000
- Tax - Property: $15,900,000
General Sales and Gross Receipts: $2,094,000
Other License: $612,000
Other Selective Sales: $36,000
- Total Salaries and Wages: $1,347,000
- Water Utilities - Interest on Debt: $482,000
Williamsburg County government finances - Revenue in 2018:
- Charges - Other: $3,933,000
Regular Highways: $913,000
Sewerage: $507,000
- Construction - General - Other: $1,406,000
- Current Operations - General - Other: $8,077,000
Police Protection: $2,985,000
Solid Waste Management: $2,924,000
Health - Other: $2,880,000
Correctional Institutions: $2,294,000
Transit Utilities: $1,810,000
Judicial and Legal Services: $1,594,000
Regular Highways: $1,459,000
Local Fire Protection: $1,288,000
Financial Administration: $1,192,000
Central Staff Services: $954,000
General Public Buildings: $832,000
Libraries: $706,000
Parks and Recreation: $548,000
Water Utilities: $495,000
Public Welfare - Other: $494,000
Sewerage: $394,000
Protective Inspection and Regulation - Other: $208,000
- Federal Intergovernmental - Other: $1,103,000
Water Utilities: $24,000
- General - Interest on Debt: $1,574,000
- Long Term Debt - Beginning Outstanding - Public Debt for Private Purpose: $29,110,000
Outstanding Nonguaranteed - Industrial Revenue: $28,735,000
Beginning Outstanding - Unspecified Public Purpose: $22,273,000
Outstanding Unspecified Public Purpose: $21,611,000
Retired Unspecified Public Purpose: $662,000
Retired Nonguaranteed - Public Debt for Private Purpose: $375,000
- Miscellaneous - General Revenue - Other: $1,493,000
Fines and Forfeits: $535,000
Interest Earnings: $2,000
- Other Capital Outlay - General - Other: $650,000
Transit Utilities: $221,000
Solid Waste Management: $147,000
Water Utilities: $144,000
Local Fire Protection: $45,000
Sewerage: $42,000
Police Protection: $10,000
Health - Other: $7,000
- Other Funds - Cash and Securities: $5,187,000
- Revenue - Water Utilities: $1,578,000
Transit Utilities: $809,000
- Sinking Funds - Cash and Securities: $32,802,000
- State Intergovernmental - Other: $2,908,000
Highways: $2,850,000
General Local Government Support: $1,818,000
Water Utilities: $1,419,000
Transit Utilities: $979,000
- Tax - Property: $15,900,000
General Sales and Gross Receipts: $2,094,000
Other License: $612,000
Other Selective Sales: $36,000
- Total Salaries and Wages: $1,347,000
- Water Utilities - Interest on Debt: $482,000
Williamsburg County government finances - Debt in 2018:
- Charges - Other: $3,933,000
Regular Highways: $913,000
Sewerage: $507,000
- Construction - General - Other: $1,406,000
- Current Operations - General - Other: $8,077,000
Police Protection: $2,985,000
Solid Waste Management: $2,924,000
Health - Other: $2,880,000
Correctional Institutions: $2,294,000
Transit Utilities: $1,810,000
Judicial and Legal Services: $1,594,000
Regular Highways: $1,459,000
Local Fire Protection: $1,288,000
Financial Administration: $1,192,000
Central Staff Services: $954,000
General Public Buildings: $832,000
Libraries: $706,000
Parks and Recreation: $548,000
Water Utilities: $495,000
Public Welfare - Other: $494,000
Sewerage: $394,000
Protective Inspection and Regulation - Other: $208,000
- Federal Intergovernmental - Other: $1,103,000
Water Utilities: $24,000
- General - Interest on Debt: $1,574,000
- Long Term Debt - Beginning Outstanding - Public Debt for Private Purpose: $29,110,000
Outstanding Nonguaranteed - Industrial Revenue: $28,735,000
Beginning Outstanding - Unspecified Public Purpose: $22,273,000
Outstanding Unspecified Public Purpose: $21,611,000
Retired Unspecified Public Purpose: $662,000
Retired Nonguaranteed - Public Debt for Private Purpose: $375,000
- Miscellaneous - General Revenue - Other: $1,493,000
Fines and Forfeits: $535,000
Interest Earnings: $2,000
- Other Capital Outlay - General - Other: $650,000
Transit Utilities: $221,000
Solid Waste Management: $147,000
Water Utilities: $144,000
Local Fire Protection: $45,000
Sewerage: $42,000
Police Protection: $10,000
Health - Other: $7,000
- Other Funds - Cash and Securities: $5,187,000
- Revenue - Water Utilities: $1,578,000
Transit Utilities: $809,000
- Sinking Funds - Cash and Securities: $32,802,000
- State Intergovernmental - Other: $2,908,000
Highways: $2,850,000
General Local Government Support: $1,818,000
Water Utilities: $1,419,000
Transit Utilities: $979,000
- Tax - Property: $15,900,000
General Sales and Gross Receipts: $2,094,000
Other License: $612,000
Other Selective Sales: $36,000
- Total Salaries and Wages: $1,347,000
- Water Utilities - Interest on Debt: $482,000
Williamsburg County government finances - Cash and Securities in 2018:
- Charges - Other: $3,933,000
Regular Highways: $913,000
Sewerage: $507,000
- Construction - General - Other: $1,406,000
- Current Operations - General - Other: $8,077,000
Police Protection: $2,985,000
Solid Waste Management: $2,924,000
Health - Other: $2,880,000
Correctional Institutions: $2,294,000
Transit Utilities: $1,810,000
Judicial and Legal Services: $1,594,000
Regular Highways: $1,459,000
Local Fire Protection: $1,288,000
Financial Administration: $1,192,000
Central Staff Services: $954,000
General Public Buildings: $832,000
Libraries: $706,000
Parks and Recreation: $548,000
Water Utilities: $495,000
Public Welfare - Other: $494,000
Sewerage: $394,000
Protective Inspection and Regulation - Other: $208,000
- Federal Intergovernmental - Other: $1,103,000
Water Utilities: $24,000
- General - Interest on Debt: $1,574,000
- Long Term Debt - Beginning Outstanding - Public Debt for Private Purpose: $29,110,000
Outstanding Nonguaranteed - Industrial Revenue: $28,735,000
Beginning Outstanding - Unspecified Public Purpose: $22,273,000
Outstanding Unspecified Public Purpose: $21,611,000
Retired Unspecified Public Purpose: $662,000
Retired Nonguaranteed - Public Debt for Private Purpose: $375,000
- Miscellaneous - General Revenue - Other: $1,493,000
Fines and Forfeits: $535,000
Interest Earnings: $2,000
- Other Capital Outlay - General - Other: $650,000
Transit Utilities: $221,000
Solid Waste Management: $147,000
Water Utilities: $144,000
Local Fire Protection: $45,000
Sewerage: $42,000
Police Protection: $10,000
Health - Other: $7,000
- Other Funds - Cash and Securities: $5,187,000
- Revenue - Water Utilities: $1,578,000
Transit Utilities: $809,000
- Sinking Funds - Cash and Securities: $32,802,000
- State Intergovernmental - Other: $2,908,000
Highways: $2,850,000
General Local Government Support: $1,818,000
Water Utilities: $1,419,000
Transit Utilities: $979,000
- Tax - Property: $15,900,000
General Sales and Gross Receipts: $2,094,000
Other License: $612,000
Other Selective Sales: $36,000
- Total Salaries and Wages: $1,347,000
- Water Utilities - Interest on Debt: $482,000
Supplemental Security Income (SSI) in 2006:
- Total number of recipients: 2,203
- Number of aged recipients: 337
- Number of blind and disabled recipients: 1,866
- Number of recipients under 18: 323
- Number of recipients between 18 and 64: 1,213
- Number of recipients older than 64: 667
- Number of recipients also receiving OASDI: 930
- Amount of payments (thousands of dollars): 905
| Most common first names in Williamsburg County, SC among deceased individuals | ||
| Name | Count | Lived (average) |
|---|---|---|
| James | 371 | 68.2 years |
| Mary | 305 | 76.2 years |
| John | 286 | 70.3 years |
| William | 280 | 70.9 years |
| Willie | 179 | 68.6 years |
| Robert | 164 | 68.4 years |
| George | 145 | 70.0 years |
| Annie | 131 | 76.9 years |
| Henry | 112 | 71.5 years |
| Thomas | 111 | 68.0 years |
| Most common last names in Williamsburg County, SC among deceased individuals | ||
| Last name | Count | Lived (average) |
|---|---|---|
| Brown | 276 | 72.3 years |
| Cooper | 190 | 71.3 years |
| Tisdale | 185 | 73.5 years |
| Scott | 166 | 72.3 years |
| Wilson | 164 | 69.5 years |
| Williams | 158 | 71.1 years |
| Fulton | 140 | 71.9 years |
| Davis | 130 | 73.9 years |
| Mcclary | 111 | 71.5 years |
| Johnson | 105 | 68.4 years |
| Businesses in Williamsburg County, SC | ||||
| Name | Count | Name | Count | |
|---|---|---|---|---|
| Advance Auto Parts | 3 | Lane Furniture | 2 | |
| AutoZone | 1 | MasterBrand Cabinets | 3 | |
| Burger King | 1 | McDonald's | 2 | |
| CVS | 3 | Pizza Hut | 1 | |
| Chevrolet | 2 | RadioShack | 1 | |
| FedEx | 2 | SONIC Drive-In | 1 | |
| Ford | 1 | Subway | 3 | |
| H&R Block | 2 | True Value | 2 | |
| Hardee's | 1 | U-Haul | 4 | |
| KFC | 2 | UPS | 2 | |