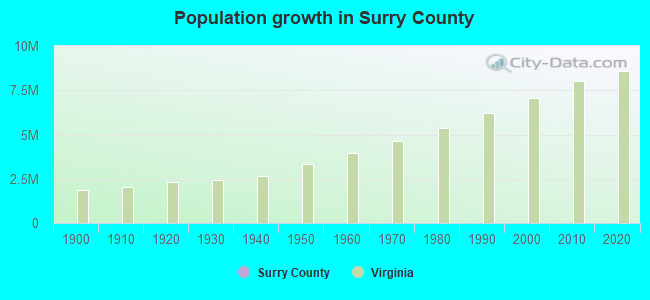
Surry County, Virginia (VA)
County owner-occupied free and clear houses and condos in 2010: 792
County owner-occupied houses and condos in 2000: 2,017
Renter-occupied apartments: 633 (it was 602 in 2000)
| % of renters here: | 23% |
| State: | 33% |
Land area: 279 sq. mi.
Water area: 31.2 sq. mi.
Population density: 24 people per square mile (low).
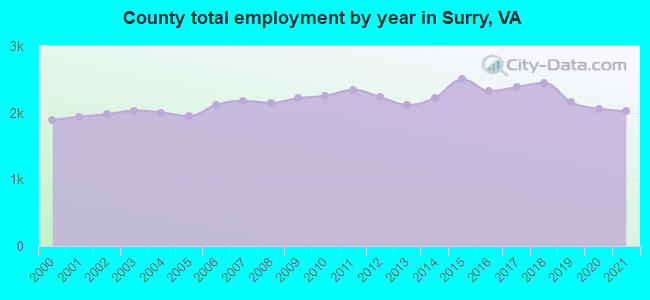
Industries providing employment: Educational, health and social services (24.4%), Manufacturing (11.9%).
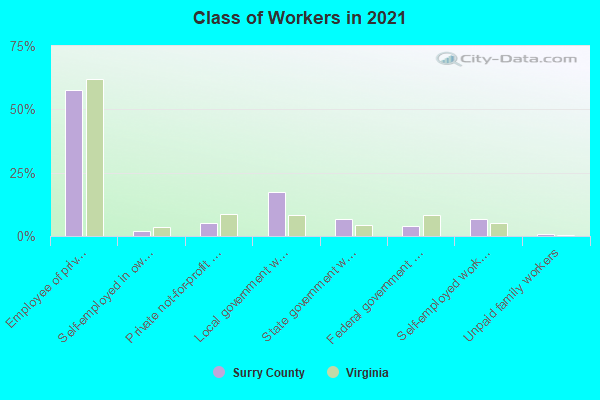
Type of workers:
- Private wage or salary: 68%
- Government: 27%
- Self-employed, not incorporated: 4%
- Unpaid family work: 0%
- OSM Map
- General Map
- Google Map
- MSN Map

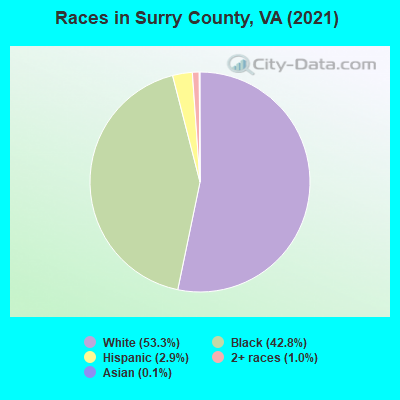
- 3,47553.4%White Non-Hispanic Alone
- 2,71641.7%Black Non-Hispanic Alone
- 1933.0%Hispanic or Latino
- 1111.7%Two or more races
- 80.1%Asian alone
- 30.05%American Indian and Alaska Native alone
| Median resident age: | 50.9 years |
| Virginia median age: | 39.0 years |
| Males: 3,308 | |
| Females: 3,282 |

 | Wash DC needs to annex Arlington and Alexandria back (95 replies) |
| VA Nuclear Plants (12 replies) |
| Richmond vs. DC (14 replies) |
| What Virginia city is Most Southern? (76 replies) |
| VA Pics (256 replies) |
| Things you might need to know moving to Virginia? (6 replies) |
| Surry County: | 2.0 people |
| Virginia: | 3 people |
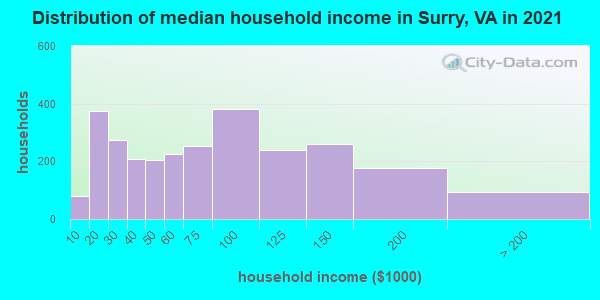
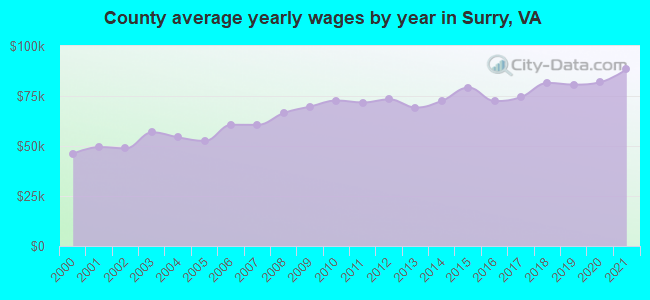
Estimated median household income in 2022: $67,572 ($37,558 in 1999)
| This county: | $67,572 |
| Virginia: | $85,873 |
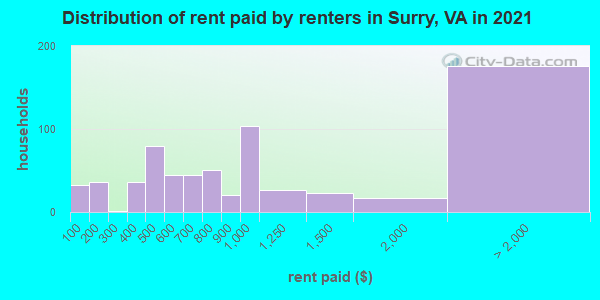
Median contract rent in 2022 for apartments: $681 (lower quartile is $432, upper quartile is $914)
| This county: | $681 |
| State: | $1270 |
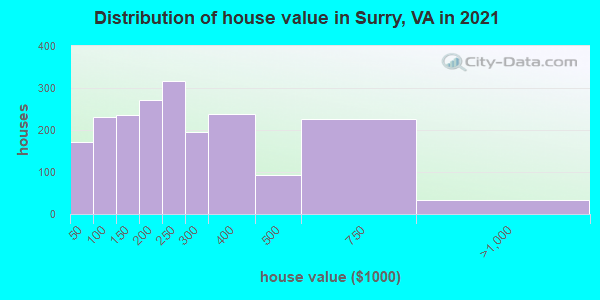
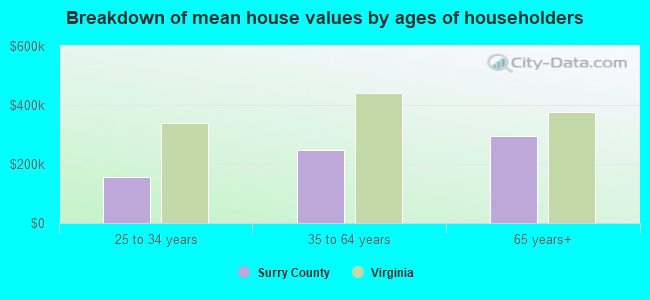
Estimated median house or condo value in 2022: $249,038 (it was $82,800 in 2000)
| Surry: | $249,038 |
| Virginia: | $365,700 |
Mean price in 2022:
Median monthly housing costs for homes and condos with a mortgage: $1,383Detached houses: $312,541
Here: $312,541 State: $472,865 Townhouses or other attached units: $268,668
Here: $268,668 State: $457,437 Mobile homes: $146,740
Here: $146,740 State: $100,736
Median monthly housing costs for units without a mortgage: $428
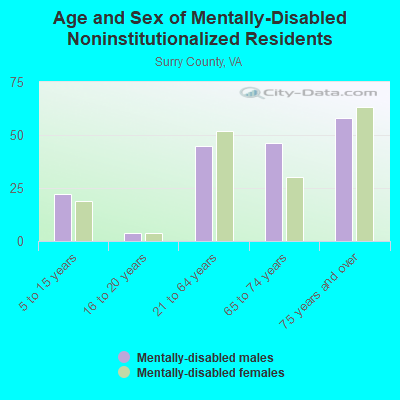
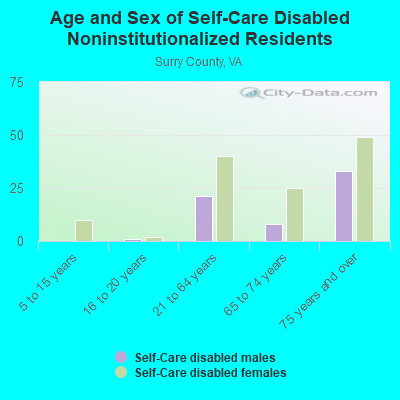
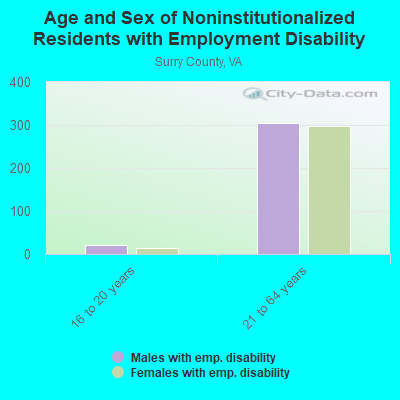
Institutionalized population: 0
Crime in 2021 (reported by the sheriff's office or county police, not the county total):
- Murders: 0
- Rapes: 1
- Robberies: 0
- Assaults: 4
- Burglaries: 5
- Thefts: 15
- Auto thefts: 1
Crime in 2020 (reported by the sheriff's office or county police, not the county total):
- Murders: 0
- Rapes: 1
- Robberies: 1
- Assaults: 2
- Burglaries: 5
- Thefts: 16
- Auto thefts: 6
Health of residents in Surry County based on CDC Behavioral Risk Factor Surveillance System Survey Questionnaires from 2013 to 2021:
General health status score of residents in this county from 1 (poor) to 5 (excellent) is 3.5. This is about average.73.3% of residents exercised in the past month. This is about average.
43.6% of residents smoked 100+ cigarettes in their lives. This is about average.
53.2% of adult residents drank alcohol in the past 30 days. This is less than average.
72.5% of residents visited a dentist within the past year. This is about average.
Average weight of males is 200 pounds. This is more than average.
Average weight of females is 167 pounds. This is more than average.
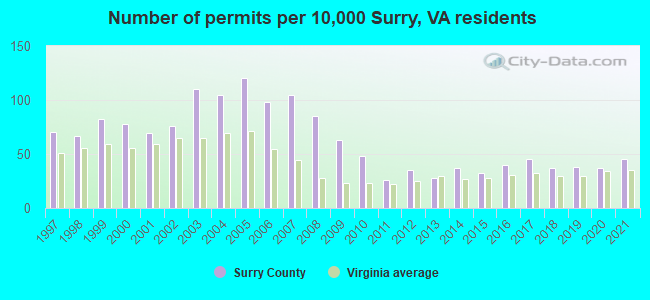
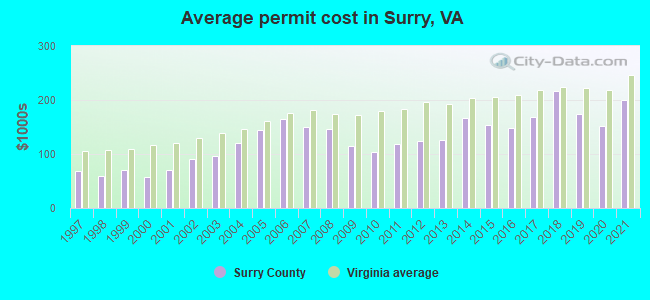
Single-family new house construction building permits:
- 2022: 37 buildings, average cost: $246,400
- 2021: 31 buildings, average cost: $200,300
- 2020: 25 buildings, average cost: $151,100
- 2019: 26 buildings, average cost: $175,000
- 2018: 25 buildings, average cost: $215,900
- 2017: 31 buildings, average cost: $169,300
- 2016: 27 buildings, average cost: $149,400
- 2015: 22 buildings, average cost: $153,100
- 2014: 25 buildings, average cost: $166,500
- 2013: 19 buildings, average cost: $125,500
- 2012: 24 buildings, average cost: $123,700
- 2011: 18 buildings, average cost: $119,100
- 2010: 33 buildings, average cost: $103,100
- 2009: 43 buildings, average cost: $113,900
- 2008: 58 buildings, average cost: $147,400
- 2007: 72 buildings, average cost: $149,800
- 2006: 67 buildings, average cost: $165,000
- 2005: 82 buildings, average cost: $145,000
- 2004: 72 buildings, average cost: $119,500
- 2003: 75 buildings, average cost: $96,500
- 2002: 52 buildings, average cost: $90,700
- 2001: 47 buildings, average cost: $70,800
- 2000: 53 buildings, average cost: $57,500
- 1999: 56 buildings, average cost: $71,200
- 1998: 46 buildings, average cost: $58,900
- 1997: 48 buildings, average cost: $68,400
Median real estate property taxes paid for housing units with mortgages in 2022: $1,498 (0.6%)
Median real estate property taxes paid for housing units with no mortgage in 2022: $1,289 (0.5%)
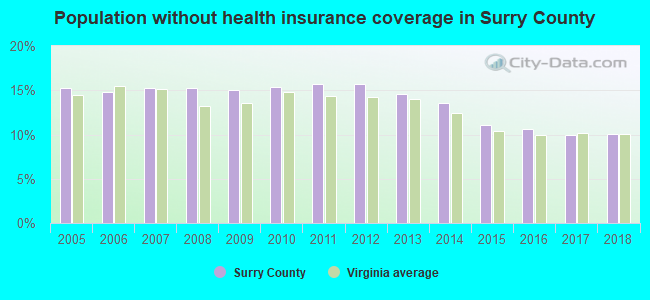
| Surry County: | 14.1% |
| Virginia: | 10.6% |
Median age of residents in 2022: 50.9 years old
(Males: 49.1 years old, Females: 52.3 years old)
(Median age for: White residents: 51.8 years old, Black residents: 52.7 years old, Asian residents: 13.2 years old, Hispanic or Latino residents: 32.2 years old, Other race residents: 31.5 years old)
Area name: Virginia Beach-Norfolk-Newport News, VA-NC MSA
Fair market rent in 2006 for a 1-bedroom apartment in Surry County is $706 a month.
Fair market rent for a 2-bedroom apartment is $811 a month.
Fair market rent for a 3-bedroom apartment is $1118 a month.
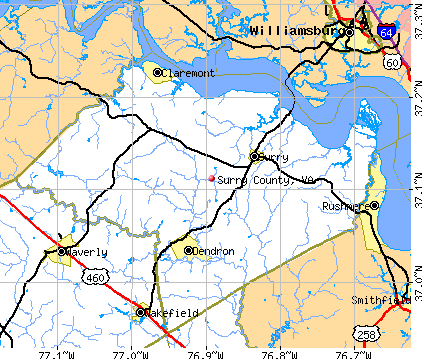
Cities in this county include: Claremont, Dendron, Surry, Scotland.
Neighboring counties: Bland County  , Hopkins County, Kentucky , Letcher County, Kentucky , Salem city .
| Here: | 2.8% |
| Virginia: | 2.7% |

Current college students: 211
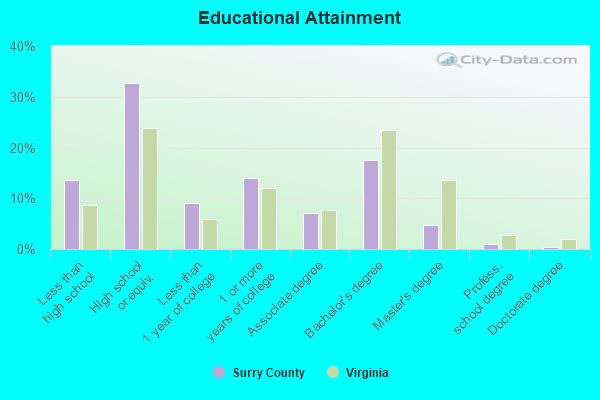
People 25 years of age or older with a high school degree or higher: 87.6%
People 25 years of age or older with a bachelor's degree or higher: 23.5%
Number of foreign born residents: 131 (58.8% naturalized citizens)
| Surry County: | 2.0% |
| Whole state: | 12.7% |
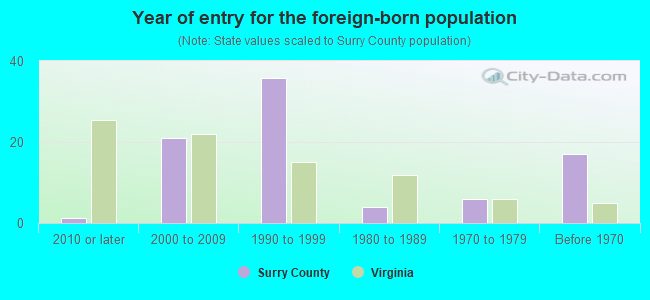
- Year of entry for the foreign-born population
- 02010 or later
- 132000 to 2009
- 561990 to 1999
- 41980 to 1989
- 61970 to 1979
- 17Before 1970
Mean travel time to work (commute): ' minutes
Percentage of county residents living and working in this county: 101.0%
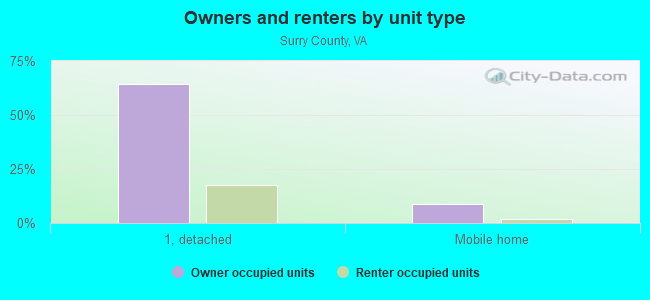
Housing units in structures:
- One, detached: 2,726
- One, attached: 25
- Two: 17
- 3 or 4: 29
- 5 to 9: 81
- 10 to 19: 14
- 50 or more: 7
- Mobile homes: 549
Housing units in Surry County with a mortgage: 1,227 (99 second mortgage, 2 home equity loan, 89 both second mortgage and home equity loan)
Houses without a mortgage: 18
| Here: | 5.3% with mortgage |
| State: | 97.2% with mortgage |
Religion statistics for Surry County
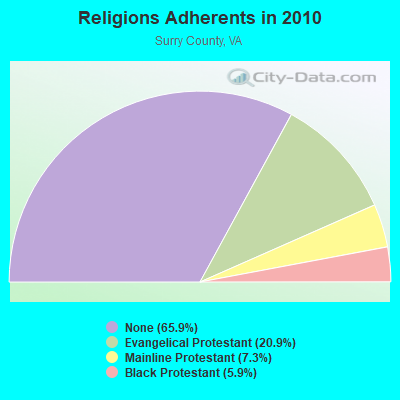
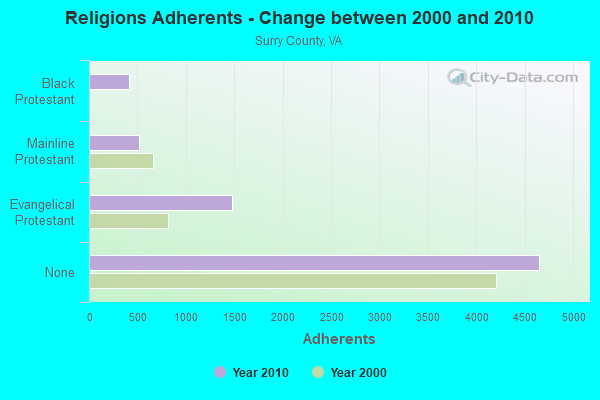
| Religion | Adherents | Congregations |
|---|---|---|
| Evangelical Protestant | 1,478 | 10 |
| Mainline Protestant | 513 | 10 |
| Black Protestant | 414 | 3 |
| Other | 1 | - |
| Catholic | - | - |
| None | 4,652 | - |
Source: Clifford Grammich, Kirk Hadaway, Richard Houseal, Dale E.Jones, Alexei Krindatch, Richie Stanley and Richard H.Taylor. 2012. 2010 U.S.Religion Census: Religious Congregations & Membership Study. Association of Statisticians of American Religious Bodies. Jones, Dale E., et al. 2002. Congregations and Membership in the United States 2000. Nashville, TN: Glenmary Research Center.
Food Environment Statistics:
| Surry County: | 1.41 / 10,000 pop. |
| State: | 2.03 / 10,000 pop. |
| This county: | 2.82 / 10,000 pop. |
| Virginia: | 1.43 / 10,000 pop. |
| Surry County: | 2.82 / 10,000 pop. |
| Virginia: | 4.03 / 10,000 pop. |
| This county: | 2.82 / 10,000 pop. |
| State: | 7.65 / 10,000 pop. |
| Surry County: | 12.4% |
| Virginia: | 9.3% |
| Surry County: | 31.6% |
| State: | 26.7% |
| Here: | 9.2% |
| State: | 18.6% |
Agriculture in Surry County:
Average size of farms: 394 acresAverage value of agricultural products sold per farm: $156,006
Average total farm production expenses per farm: $159,020
Harvested cropland as a percentage of land in farms: 73.97%
Irrigated harvested cropland as a percentage of land in farms: 4.12%
Average market value of all machinery and equipment per farm: $86,615
The percentage of farms operated by a family or individual: 83.47%
Average age of principal farm operators: 52 years
Average number of cattle and calves per 100 acres of all land in farms: 2.33
Corn for grain: 6720 harvested acres
All wheat for grain: 7037 harvested acres
Upland cotton: 3840 harvested acres
Soybeans for beans: 14863 harvested acres
Vegetables: 33 harvested acres
Tornado activity:
Surry County historical area-adjusted tornado activity is significantly below Virginia state average. It is 1707319.9 times below overall U.S. average.Tornadoes in this county have caused 4 fatalities and 246 injuries recorded between 1950 and 2004.
On 8/6/1993, a category 4 (max. wind speeds 207-260 mph) tornado killed 4 people and injured 246 people and caused between $5,000,000 and $50,000,000 in damages.
Earthquake activity:
Surry County-area historical earthquake activity is significantly above Virginia state average. It is 59% smaller than the overall U.S. average.On 8/23/2011 at 17:51:04, a magnitude 5.8 (5.8 MW, Depth: 3.7 mi, Class: Moderate, Intensity: VI - VII) earthquake occurred 79.5 miles away from Surry County center
On 12/9/2003 at 20:59:14, a magnitude 4.5 (4.5 MB, 4.5 LG, Class: Light, Intensity: IV - V) earthquake occurred 64.5 miles away from the county center
On 12/9/2003 at 20:59:18, a magnitude 4.5 (4.5 ML, Depth: 6.2 mi) earthquake occurred 80.5 miles away from the county center
On 8/25/2011 at 05:07:52, a magnitude 4.5 (4.5 ML, Depth: 4.2 mi) earthquake occurred 82.5 miles away from the county center
On 8/9/2020 at 12:07:37, a magnitude 5.1 (5.1 MW, Depth: 4.7 mi) earthquake occurred 236.7 miles away from Surry County center
On 8/24/2011 at 00:04:36, a magnitude 4.2 (4.2 ML) earthquake occurred 80.5 miles away from the county center
Magnitude types: regional Lg-wave magnitude (LG), body-wave magnitude (MB), local magnitude (ML), moment magnitude (MW)
Most recent natural disasters:
- Virginia Covid-19 Pandemic, Incident Period: January 20, 2020, Major Disaster (Presidential) Declared DR-4512-VA: April 2, 2020, FEMA Id: 4512, Natural disaster type: Other
- Virginia Hurricane Sandy, Incident Period: October 26, 2012 to November 01, 2012, Emergency Declared EM-3359: October 29, 2012, FEMA Id: 3359, Natural disaster type: Hurricane
- Virginia Hurricane Irene, Incident Period: August 26, 2011 to September 04, 2011, Emergency Declared EM-3329: August 26, 2011, FEMA Id: 3329, Natural disaster type: Hurricane
- Virginia Hurricane Irene, Incident Period: August 26, 2011 to August 28, 2011, Major Disaster (Presidential) Declared DR-4024: September 03, 2011, FEMA Id: 4024, Natural disaster type: Hurricane
- Virginia Severe Storms and Flooding Associated with Tropical Depression Ida and a Nor'easter, Incident Period: November 11, 2009 to November 16, 2009, Major Disaster (Presidential) Declared DR-1862: December 09, 2009, FEMA Id: 1862, Natural disaster type: Storm, Flood, Tropical Depression
- Virginia Severe Storms and Flooding, Including Severe Storms and Flooding Associated with Tropical Depression Ernesto, Incident Period: August 29, 2006 to September 07, 2006, Major Disaster (Presidential) Declared DR-1661: September 22, 2006, FEMA Id: 1661, Natural disaster type: Storm, Flood, Tropical Depression
- Virginia Hurricane Katrina Evacuation, Incident Period: August 29, 2005 to October 01, 2005, Emergency Declared EM-3240: September 12, 2005, FEMA Id: 3240, Natural disaster type: Hurricane
- Virginia Hurricane Isabel, Incident Period: September 18, 2003 to October 01, 2003, Major Disaster (Presidential) Declared DR-1491: September 18, 2003, FEMA Id: 1491, Natural disaster type: Hurricane
- Virginia Winter Storm, Incident Period: January 25, 2000 to January 30, 2000, Major Disaster (Presidential) Declared DR-1318: February 28, 2000, FEMA Id: 1318, Natural disaster type: Winter Storm
- Virginia Hurricane Floyd, Incident Period: September 13, 1999 to September 26, 1999, Major Disaster (Presidential) Declared DR-1293: September 18, 1999, FEMA Id: 1293, Natural disaster type: Hurricane
- 6 other natural disasters have been reported since 1953.
The number of natural disasters in Surry County (16) is near the US average (15).
Major Disasters (Presidential) Declared: 12
Emergencies Declared: 4
Causes of natural disasters: Hurricanes: 7, Floods: 4, Storms: 4, Tropical Depressions: 2, Winter Storms: 2, Blizzard: 1, Ice Storm: 1, Tropical Storm: 1, Other: 1 (Note: some incidents may be assigned to more than one category).

Means of transportation to work:
- Drove a car alone: 1,527 (77.2%)
- Carpooled: 135 (6.8%)
- Bus: 5 (0.3%)
- Ferryboat: 20 (1.0%)
- Taxicab, motorcycle, or other means: 88 (4.5%)
- Walked: 12 (0.6%)
- Worked at home: 151 (7.6%)
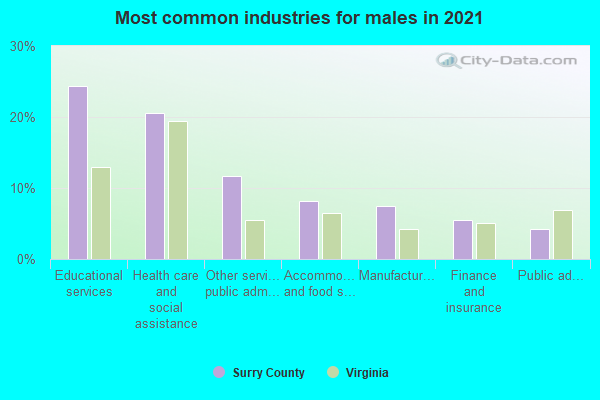
- Educational services (21%)
- Health care and social assistance (20%)
- Other services, except public administration (12%)
- Finance and insurance (7%)
- Accommodation and food services (6%)
- Manufacturing (6%)
- Public administration (5%)
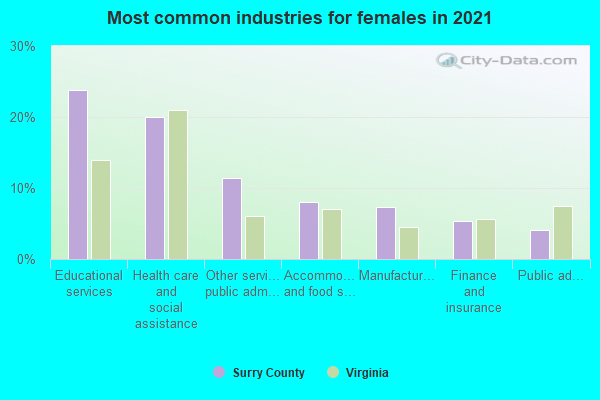
- Educational services (21%)
- Health care and social assistance (20%)
- Other services, except public administration (12%)
- Finance and insurance (7%)
- Accommodation and food services (6%)
- Manufacturing (6%)
- Public administration (5%)

- Installation, maintenance, and repair occupations (15%)
- Transportation occupations (14%)
- Material moving occupations (9%)
- Building and grounds cleaning and maintenance occupations (9%)
- Management occupations (8%)
- Construction and extraction occupations (8%)
- Architecture and engineering occupations (6%)
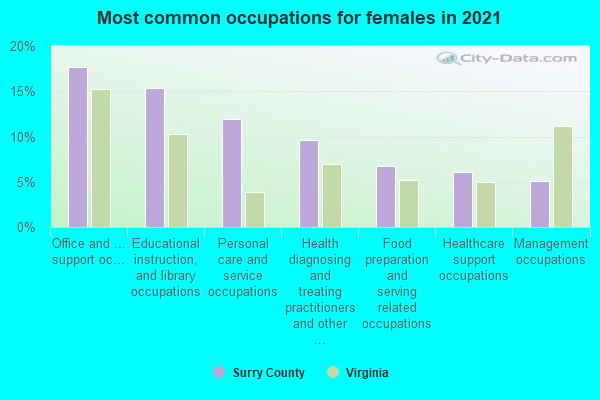
- Office and administrative support occupations (18%)
- Educational instruction, and library occupations (14%)
- Personal care and service occupations (12%)
- Health diagnosing and treating practitioners and other technical occupations (9%)
- Sales and related occupations (6%)
- Management occupations (6%)
- Healthcare support occupations (6%)
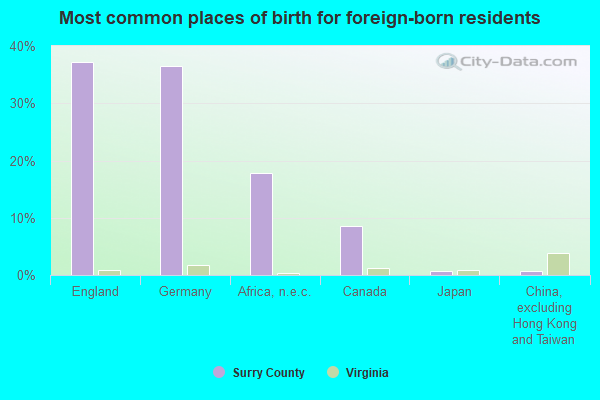
- England (27%)
- Germany (19%)
- Mexico (19%)
- Africa, n.e.c. (11%)
- Spain (7%)
- Canada (5%)
- China, excluding Hong Kong and Taiwan (2%)
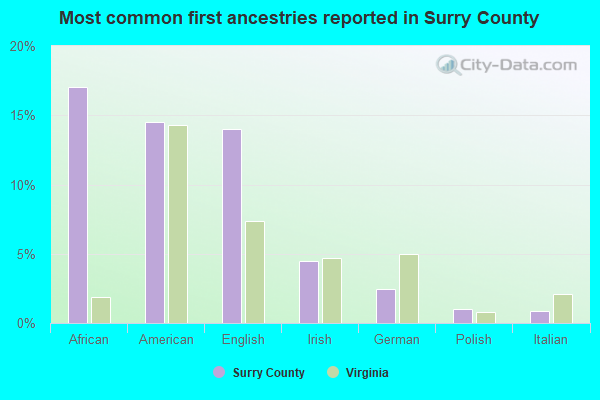
- African (20%)
- English (15%)
- American (11%)
- Irish (5%)
- German (2%)
- Polish (1%)
- Italian (1%)
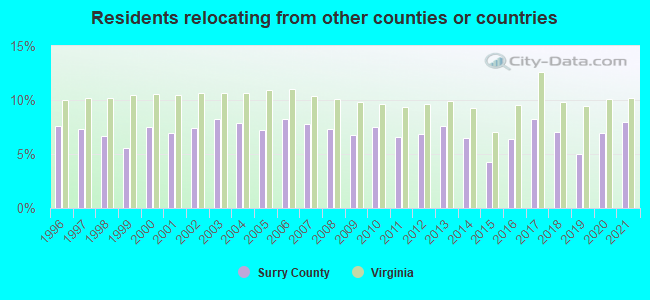
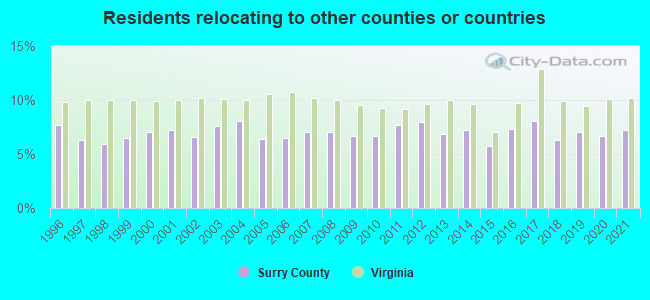
7.99% of this county's 2021 resident taxpayers lived in other counties in 2020 ($51,454 average adjusted gross income)
| Here: | 7.99% |
| Virginia average: | 10.16% |
10 or fewer of this county's residents moved from foreign countries.
7.05% relocated from other counties in Virginia ($44,556 average AGI)
0.94% relocated from other states ($6,898 average AGI)
Surry County: 0.94% Virginia average: 3.91%
Top counties from which taxpayers relocated into this county between 2020 and 2021:
| from Isle of Wight County, VA | |
| from Newport News city, VA |
7.27% of this county's 2020 resident taxpayers moved to other counties in 2021 ($49,319 average adjusted gross income)
| Here: | 7.27% |
| Virginia average: | 10.20% |
10 or fewer of this county's residents moved to foreign countries.
5.73% relocated to other counties in Virginia ($38,859 average AGI)
1.53% relocated to other states ($10,459 average AGI)
Surry County: 1.53% Virginia average: 3.98%
Top counties to which taxpayers relocated from this county between 2020 and 2021:
| to Isle of Wight County, VA |
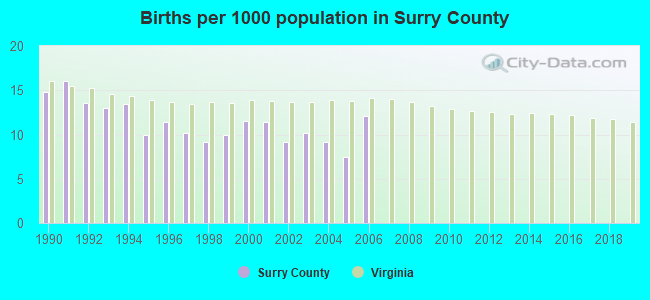
Births per 1000 population from 1990 to 1999: 12.2
Births per 1000 population from 2000 to 2006: 10.2
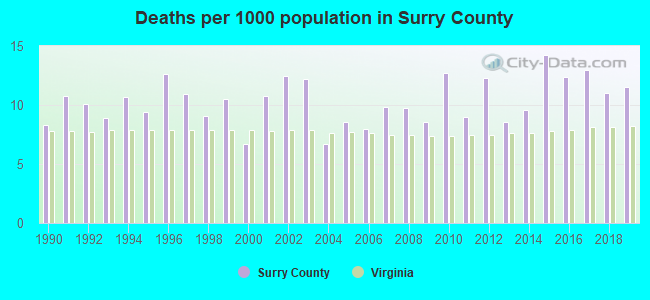
Deaths per 1000 population from 1990 to 1999: 10.1
Deaths per 1000 population from 2000 to 2009: 9.4
Deaths per 1000 population from 2010 to 2020: 11.6
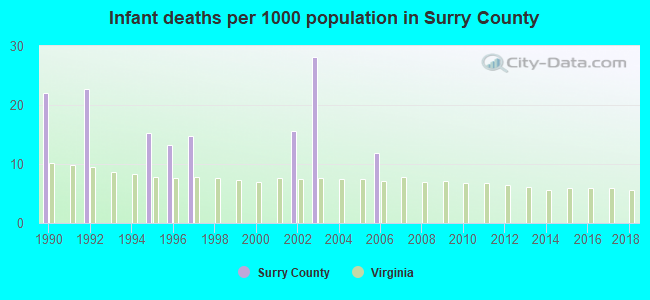
Infant deaths per 1000 live births from 1990 to 1999: 8.8
Infant deaths per 1000 live births from 2000 to 2006: 7.9
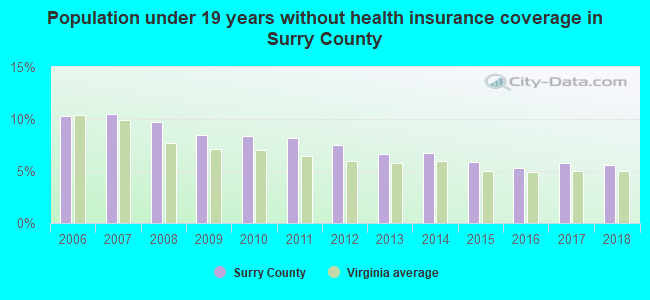
Persons under 19 years old without health insurance coverage in 2018: 5.6%
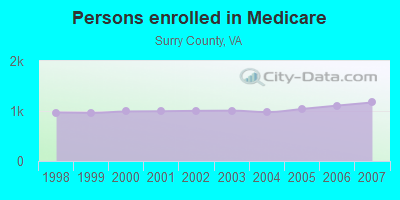
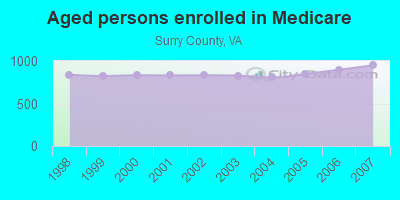
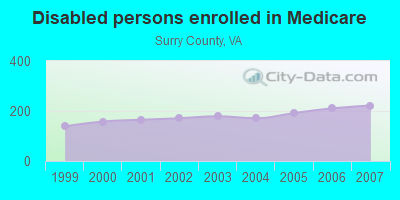
Persons enrolled in hospital insurance and/or supplemental medical insurance (Medicare) in July 1, 2007: 1,171 (949 aged, 222 disabled)
Children under 18 without health insurance coverage in 2007: 152 (10%)
Most common underlying causes of death in Surry County, Virginia in 1999 - 2019:
- Bronchus or lung, unspecified - Malignant neoplasms (11)
Population without health insurance coverage in 2000: 14%
Children under 18 without health insurance coverage in 2000: 11%
Medical specialist MDs per 100,000 population in 2005: 799
Household type by relationship:
Households: 6,590- Male householders: 1,422 (341 living alone), Female householders: 1,397 (426 living alone)
1,414 spouses (1,375 opposite-sex spouses), 126 unmarried partners, (126 opposite-sex unmarried partners), 1,788 children (1,644 natural, 51 adopted, 89 stepchildren), 139 grandchildren, 61 brothers or sisters, 36 parents, 5 foster children, 94 other relatives, 113 non-relatives
Size of family households: 1,022 2-persons, 483 3-persons, 307 4-persons, 81 5-persons, 6 6-persons, 40 7-or-more-persons.
Size of nonfamily households: 767 1-person, 103 2-persons, 4 3-persons.
641 married couples with children.
310 single-parent households (13 men, 297 women).
98.5% of residents of Surry speak English at home.
1.3% of residents speak Spanish at home (82% speak English very well, 4% speak English well, 14% speak English not well).
0.1% of residents speak Asian or Pacific Island language at home (60% speak English well, 40% speak English not well).
In fiscal year 2004:
Federal Government expenditure: $38,783,000 ($5,564 per capita)
Department of Defense expenditure: $1,665,000
Federal direct payments to individuals for retirement and disability: $18,731,000
Federal other direct payments to individuals: $7,961,000
Federal direct payments not to individuals: $4,010,000
Federal grants: $5,958,000
Federal procurement contracts: $772,000 ($25,000 Department of Defense)
Federal salaries and wages: $1,351,000 ($0,000 Department of Defense)
Federal Government direct loans: $1,569,000
Federal guaranteed/insured loans: $2,944,000
Federal Government insurance: $7,637,000
Population change from April 1, 2000 to July 1, 2005:
Births: 393| Here: | 56 per 1000 residents |
| State: | 70 per 1000 residents |
Deaths: 408
| Here: | 58 per 1000 residents |
| State: | 40 per 1000 residents |
Net international migration: 0
| Here: | 0 per 1000 residents |
| State: | +18 per 1000 residents |
Net internal migration: +210
| Here: | +30 per 1000 residents |
| State: | +14 per 1000 residents |
Total withdrawal of fresh water for public supply: 0.13 millions of gallons per day (all from ground)
| Here: | 6.4 |
| State: | 7.0 |
| Here: | 5.0 |
| State: | 4.3 |
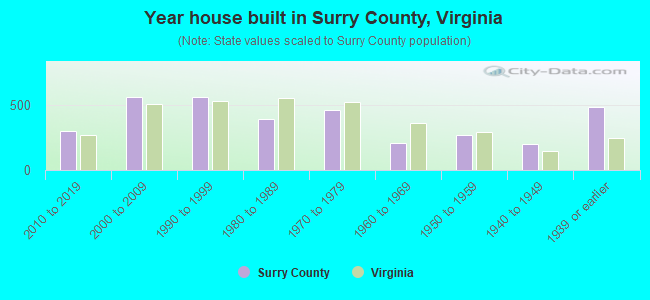
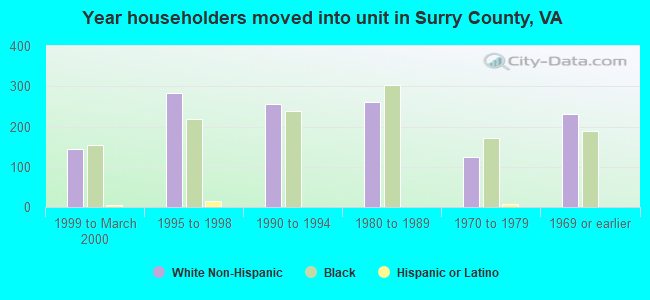
- Year house built in Surry County, Virginia
- 02020 or later
- 3182010 to 2019
- 5252000 to 2009
- 5741990 to 1999
- 4051980 to 1989
- 4481970 to 1979
- 2181960 to 1969
- 2821950 to 1959
- 1721940 to 1949
- 4921939 or earlier
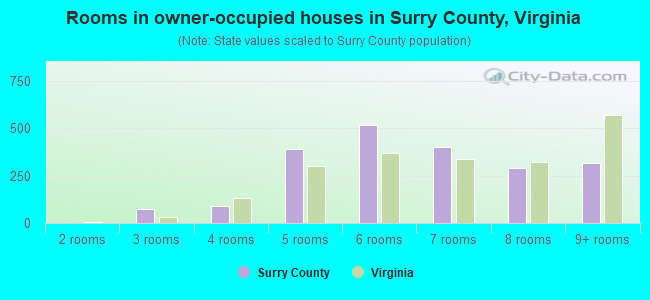
- Rooms in owner-occupied houses in Surry County, Virginia
- 01 room
- 02 rooms
- 813 rooms
- 1424 rooms
- 4305 rooms
- 5106 rooms
- 3967 rooms
- 2958 rooms
- 3529+ rooms
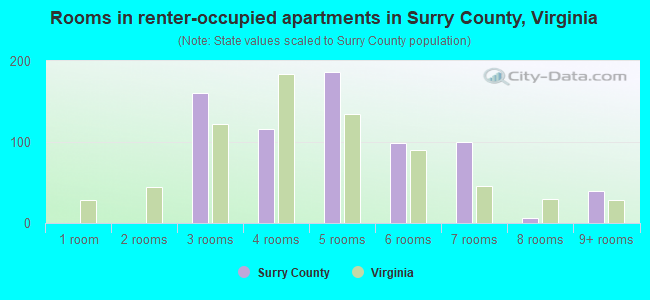
- Rooms in renter-occupied apartments in Surry County, Virginia
- 01 room
- 02 rooms
- 1143 rooms
- 854 rooms
- 1645 rooms
- 736 rooms
- 997 rooms
- 308 rooms
- 389+ rooms
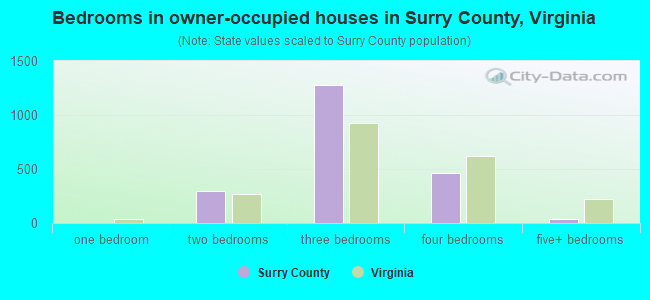
- Bedrooms in owner-occupied houses in Surry County, Virginia
- 0no bedroom
- 91 bedroom
- 3472 bedrooms
- 1,2383 bedrooms
- 5754 bedrooms
- 345+ bedrooms
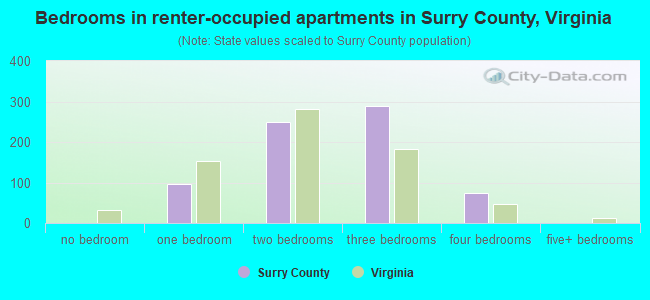
- Bedrooms in renter-occupied apartments in Surry County, Virginia
- 0no bedroom
- 751 bedroom
- 2432 bedrooms
- 1993 bedrooms
- 884 bedrooms
- 05+ bedrooms
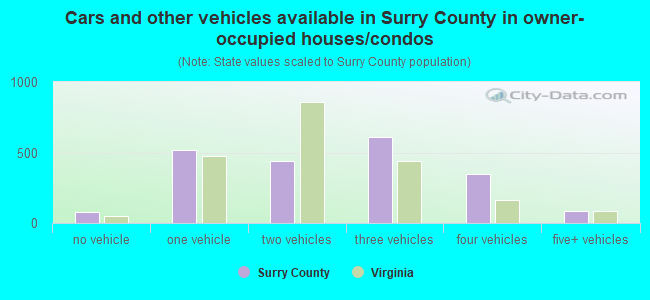
- Cars and other vehicles available in Surry County in owner-occupied houses/condos
- 95no vehicle
- 5221 vehicle
- 5292 vehicles
- 6423 vehicles
- 3074 vehicles
- 1085+ vehicles

- Cars and other vehicles available in Surry County in renter-occupied apartments
- 56no vehicle
- 3271 vehicle
- 1622 vehicles
- 323 vehicles
- 154 vehicles
- 245+ vehicles
94.3% of Surry County residents lived in the same house 1 years ago.
Out of people who lived in different houses, 9% lived in this county.
Out of people who lived in different counties, 88% lived in Virginia.
| Surry County: | 94.3% |
| State average: | 86.6% |
Place of birth for U.S.-born residents:
- This state: 5,015
- Other state: 1,363
- Northeast: 420
- Midwest: 205
- South: 620
- West: 114

- 62.5%Electricity
- 18.8%Fuel oil, kerosene, etc.
- 13.9%Bottled, tank, or LP gas
- 2.3%Wood
- 2.1%Utility gas
- 0.3%Other fuel
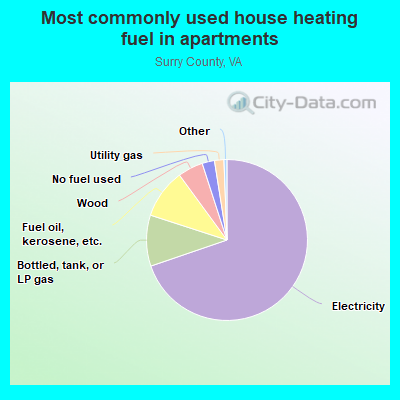
- 69.3%Electricity
- 10.6%Bottled, tank, or LP gas
- 9.1%Fuel oil, kerosene, etc.
- 6.8%Wood
- 3.3%Utility gas
- 1.0%No fuel used
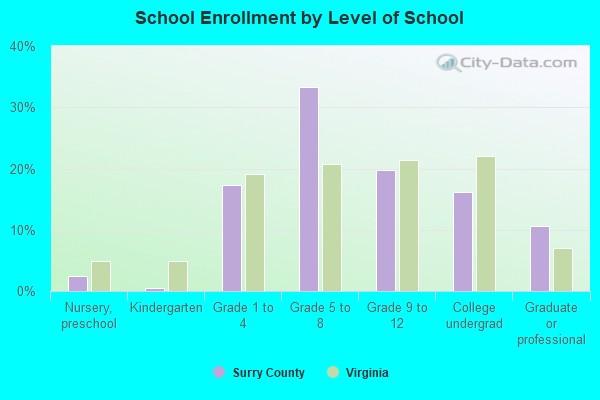
Private vs. public school enrollment:
| Here: | 16.3% |
| Virginia: | 13.2% |
| Here: | 16.5% |
| Virginia: | 10.2% |
| Here: | 15.1% |
| Virginia: | 18.7% |


Surry County government finances - Expenditure in 2017:
- Bond Funds - Cash and Securities: $2,403,000
- Charges - Elementary and Secondary Education School Lunch: $258,000
Solid Waste Management: $51,000
Other: $38,000
Sewerage: $31,000
Parks and Recreation: $30,000
- Construction - Elementary and Secondary Education: $70,000
- Current Operations - Elementary and Secondary Education: $18,614,000
Public Welfare - Other: $2,391,000
Police Protection: $1,576,000
Central Staff Services: $838,000
Financial Administration: $829,000
Local Fire Protection: $681,000
General Public Buildings: $675,000
General - Other: $569,000
Judicial and Legal Services: $545,000
Solid Waste Management: $490,000
Parks and Recreation: $462,000
Health - Other: $396,000
Housing and Community Development: $382,000
Correctional Institutions: $286,000
Sewerage: $121,000
Protective Inspection and Regulation - Other: $120,000
Water Utilities: $105,000
Libraries: $103,000
Natural Resources - Other: $85,000
- Federal Intergovernmental - Public Welfare: $400,000
Education: $117,000
Other: $70,000
Housing and Community Development: $37,000
- General - Interest on Debt: $753,000
- Intergovernmental to Local - Other - Elementary and Secondary Education: $82,000
Other - Other Higher Education: $1,000
- Local Intergovernmental - Education: $77,000
- Long Term Debt - Beginning Outstanding - Unspecified Public Purpose: $14,957,000
Outstanding Unspecified Public Purpose: $13,964,000
Retired Unspecified Public Purpose: $993,000
- Miscellaneous - Interest Earnings: $639,000
General Revenue - Other: $113,000
Rents: $59,000
Fines and Forfeits: $16,000
Donations From Private Sources: $3,000
Sale of Property: $1,000
- Other Capital Outlay - Elementary and Secondary Education: $1,015,000
Solid Waste Management: $114,000
Financial Administration: $87,000
Parks and Recreation: $26,000
General Public Building: $21,000
General - Other: $18,000
- Other Funds - Cash and Securities: $14,315,000
- Revenue - Water Utilities: $30,000
- State Intergovernmental - Education: $4,475,000
Other: $1,012,000
General Local Government Support: $795,000
Public Welfare: $385,000
- Tax - Property: $24,863,000
General Sales and Gross Receipts: $736,000
Motor Vehicle License: $164,000
Occupation and Business License - Other: $116,000
Other License: $64,000
Death and Gift: $55,000
Public Utilities Sales: $23,000
- Total Salaries and Wages: $12,723,000
Surry County government finances - Revenue in 2017:
- Bond Funds - Cash and Securities: $2,403,000
- Charges - Elementary and Secondary Education School Lunch: $258,000
Solid Waste Management: $51,000
Other: $38,000
Sewerage: $31,000
Parks and Recreation: $30,000
- Construction - Elementary and Secondary Education: $70,000
- Current Operations - Elementary and Secondary Education: $18,614,000
Public Welfare - Other: $2,391,000
Police Protection: $1,576,000
Central Staff Services: $838,000
Financial Administration: $829,000
Local Fire Protection: $681,000
General Public Buildings: $675,000
General - Other: $569,000
Judicial and Legal Services: $545,000
Solid Waste Management: $490,000
Parks and Recreation: $462,000
Health - Other: $396,000
Housing and Community Development: $382,000
Correctional Institutions: $286,000
Sewerage: $121,000
Protective Inspection and Regulation - Other: $120,000
Water Utilities: $105,000
Libraries: $103,000
Natural Resources - Other: $85,000
- Federal Intergovernmental - Public Welfare: $400,000
Education: $117,000
Other: $70,000
Housing and Community Development: $37,000
- General - Interest on Debt: $753,000
- Intergovernmental to Local - Other - Elementary and Secondary Education: $82,000
Other - Other Higher Education: $1,000
- Local Intergovernmental - Education: $77,000
- Long Term Debt - Beginning Outstanding - Unspecified Public Purpose: $14,957,000
Outstanding Unspecified Public Purpose: $13,964,000
Retired Unspecified Public Purpose: $993,000
- Miscellaneous - Interest Earnings: $639,000
General Revenue - Other: $113,000
Rents: $59,000
Fines and Forfeits: $16,000
Donations From Private Sources: $3,000
Sale of Property: $1,000
- Other Capital Outlay - Elementary and Secondary Education: $1,015,000
Solid Waste Management: $114,000
Financial Administration: $87,000
Parks and Recreation: $26,000
General Public Building: $21,000
General - Other: $18,000
- Other Funds - Cash and Securities: $14,315,000
- Revenue - Water Utilities: $30,000
- State Intergovernmental - Education: $4,475,000
Other: $1,012,000
General Local Government Support: $795,000
Public Welfare: $385,000
- Tax - Property: $24,863,000
General Sales and Gross Receipts: $736,000
Motor Vehicle License: $164,000
Occupation and Business License - Other: $116,000
Other License: $64,000
Death and Gift: $55,000
Public Utilities Sales: $23,000
- Total Salaries and Wages: $12,723,000
Surry County government finances - Debt in 2017:
- Bond Funds - Cash and Securities: $2,403,000
- Charges - Elementary and Secondary Education School Lunch: $258,000
Solid Waste Management: $51,000
Other: $38,000
Sewerage: $31,000
Parks and Recreation: $30,000
- Construction - Elementary and Secondary Education: $70,000
- Current Operations - Elementary and Secondary Education: $18,614,000
Public Welfare - Other: $2,391,000
Police Protection: $1,576,000
Central Staff Services: $838,000
Financial Administration: $829,000
Local Fire Protection: $681,000
General Public Buildings: $675,000
General - Other: $569,000
Judicial and Legal Services: $545,000
Solid Waste Management: $490,000
Parks and Recreation: $462,000
Health - Other: $396,000
Housing and Community Development: $382,000
Correctional Institutions: $286,000
Sewerage: $121,000
Protective Inspection and Regulation - Other: $120,000
Water Utilities: $105,000
Libraries: $103,000
Natural Resources - Other: $85,000
- Federal Intergovernmental - Public Welfare: $400,000
Education: $117,000
Other: $70,000
Housing and Community Development: $37,000
- General - Interest on Debt: $753,000
- Intergovernmental to Local - Other - Elementary and Secondary Education: $82,000
Other - Other Higher Education: $1,000
- Local Intergovernmental - Education: $77,000
- Long Term Debt - Beginning Outstanding - Unspecified Public Purpose: $14,957,000
Outstanding Unspecified Public Purpose: $13,964,000
Retired Unspecified Public Purpose: $993,000
- Miscellaneous - Interest Earnings: $639,000
General Revenue - Other: $113,000
Rents: $59,000
Fines and Forfeits: $16,000
Donations From Private Sources: $3,000
Sale of Property: $1,000
- Other Capital Outlay - Elementary and Secondary Education: $1,015,000
Solid Waste Management: $114,000
Financial Administration: $87,000
Parks and Recreation: $26,000
General Public Building: $21,000
General - Other: $18,000
- Other Funds - Cash and Securities: $14,315,000
- Revenue - Water Utilities: $30,000
- State Intergovernmental - Education: $4,475,000
Other: $1,012,000
General Local Government Support: $795,000
Public Welfare: $385,000
- Tax - Property: $24,863,000
General Sales and Gross Receipts: $736,000
Motor Vehicle License: $164,000
Occupation and Business License - Other: $116,000
Other License: $64,000
Death and Gift: $55,000
Public Utilities Sales: $23,000
- Total Salaries and Wages: $12,723,000
Surry County government finances - Cash and Securities in 2017:
- Bond Funds - Cash and Securities: $2,403,000
- Charges - Elementary and Secondary Education School Lunch: $258,000
Solid Waste Management: $51,000
Other: $38,000
Sewerage: $31,000
Parks and Recreation: $30,000
- Construction - Elementary and Secondary Education: $70,000
- Current Operations - Elementary and Secondary Education: $18,614,000
Public Welfare - Other: $2,391,000
Police Protection: $1,576,000
Central Staff Services: $838,000
Financial Administration: $829,000
Local Fire Protection: $681,000
General Public Buildings: $675,000
General - Other: $569,000
Judicial and Legal Services: $545,000
Solid Waste Management: $490,000
Parks and Recreation: $462,000
Health - Other: $396,000
Housing and Community Development: $382,000
Correctional Institutions: $286,000
Sewerage: $121,000
Protective Inspection and Regulation - Other: $120,000
Water Utilities: $105,000
Libraries: $103,000
Natural Resources - Other: $85,000
- Federal Intergovernmental - Public Welfare: $400,000
Education: $117,000
Other: $70,000
Housing and Community Development: $37,000
- General - Interest on Debt: $753,000
- Intergovernmental to Local - Other - Elementary and Secondary Education: $82,000
Other - Other Higher Education: $1,000
- Local Intergovernmental - Education: $77,000
- Long Term Debt - Beginning Outstanding - Unspecified Public Purpose: $14,957,000
Outstanding Unspecified Public Purpose: $13,964,000
Retired Unspecified Public Purpose: $993,000
- Miscellaneous - Interest Earnings: $639,000
General Revenue - Other: $113,000
Rents: $59,000
Fines and Forfeits: $16,000
Donations From Private Sources: $3,000
Sale of Property: $1,000
- Other Capital Outlay - Elementary and Secondary Education: $1,015,000
Solid Waste Management: $114,000
Financial Administration: $87,000
Parks and Recreation: $26,000
General Public Building: $21,000
General - Other: $18,000
- Other Funds - Cash and Securities: $14,315,000
- Revenue - Water Utilities: $30,000
- State Intergovernmental - Education: $4,475,000
Other: $1,012,000
General Local Government Support: $795,000
Public Welfare: $385,000
- Tax - Property: $24,863,000
General Sales and Gross Receipts: $736,000
Motor Vehicle License: $164,000
Occupation and Business License - Other: $116,000
Other License: $64,000
Death and Gift: $55,000
Public Utilities Sales: $23,000
- Total Salaries and Wages: $12,723,000
Supplemental Security Income (SSI) in 2006:
- Total number of recipients: 172
- Number of aged recipients: 25
- Number of blind and disabled recipients: 147
- Number of recipients under 18: 29
- Number of recipients between 18 and 64: 98
- Number of recipients older than 64: 45
- Number of recipients also receiving OASDI: 72
- Amount of payments (thousands of dollars): 73
| Most common first names in Surry County, VA among deceased individuals | ||
| Name | Count | Lived (average) |
|---|---|---|
| William | 41 | 75.2 years |
| John | 37 | 74.8 years |
| James | 32 | 74.0 years |
| Robert | 28 | 69.9 years |
| Mary | 28 | 81.5 years |
| Joseph | 22 | 74.8 years |
| George | 19 | 72.8 years |
| Thomas | 18 | 73.6 years |
| Willie | 17 | 75.6 years |
| Virginia | 14 | 78.6 years |
| Most common last names in Surry County, VA among deceased individuals | ||
| Last name | Count | Lived (average) |
|---|---|---|
| Jones | 27 | 75.4 years |
| Johnson | 25 | 75.1 years |
| Lane | 19 | 72.9 years |
| Bailey | 19 | 77.2 years |
| Berryman | 19 | 78.8 years |
| Brown | 18 | 71.5 years |
| Spratley | 18 | 79.6 years |
| Judkins | 15 | 74.3 years |
| Edwards | 15 | 77.1 years |
| Poole | 14 | 78.8 years |
Businesses in Surry County, VA
- 7-Eleven: 1