Pike County, Ohio (OH)
County owner-occupied free and clear houses and condos in 2010: 3,351
County owner-occupied houses and condos in 2000: 7,324
Renter-occupied apartments: 3,471 (it was 3,120 in 2000)
| % of renters here: | 30% |
| State: | 32% |
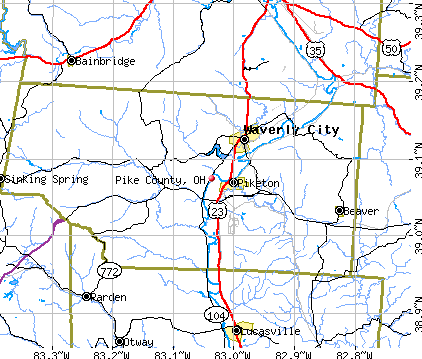
Land area: 441 sq. mi.
Water area: 2.5 sq. mi.
Population density: 61 people per square mile (average).
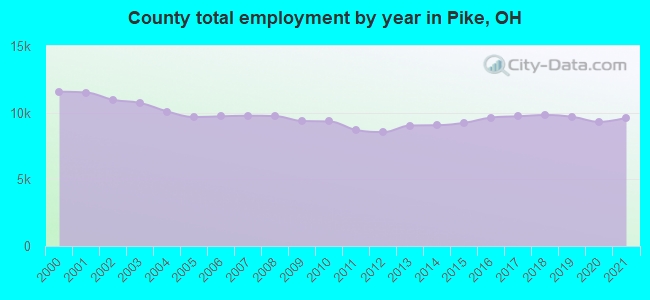
Industries providing employment: Educational, health and social services (27.3%), Retail trade (12.9%), Manufacturing (12.4%), Arts, entertainment, recreation, accommodation and food services (10.2%).
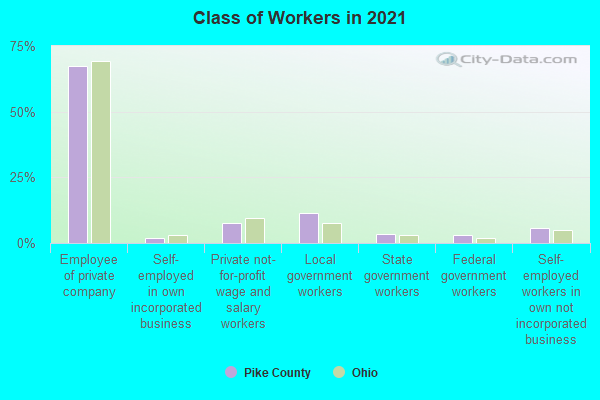
Type of workers:
- Private wage or salary: 77%
- Government: 18%
- Self-employed, not incorporated: 5%
- Unpaid family work: 0%
- OSM Map
- General Map
- Google Map
- MSN Map

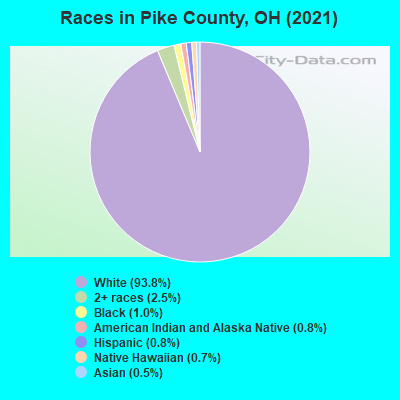
- 25,24893.8%White Non-Hispanic Alone
- 8353.1%Two or more races
- 2881.1%Black Non-Hispanic Alone
- 2390.9%Hispanic or Latino
- 1040.4%American Indian and Alaska Native alone
- 990.4%Native Hawaiian and Other
Pacific Islander alone - 860.3%Asian alone
- 200.07%Some other race alone
| Median resident age: | 41.2 years |
| Ohio median age: | 39.9 years |
| Males: 13,498 | |
| Females: 13,610 |

 | Excluding Cincinnati, how Appalachian-influenced is Southwestern Ohio on the whole? (60 replies) |
| How did Biden not win Ohio? (244 replies) |
| Advice on Moving to Chillicothe? (11 replies) |
| Southwestern Ohio murders (12 replies) |
| Organized crime in Ohio (19 replies) |
| Do not move to Portsmouth,Oh (82 replies) |
| Pike County: | 2.0 people |
| Ohio: | 2 people |
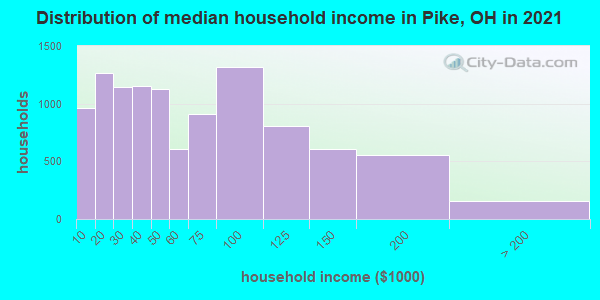
Estimated median household income in 2022: $49,868 ($31,649 in 1999)
| This county: | $49,868 |
| Ohio: | $65,720 |
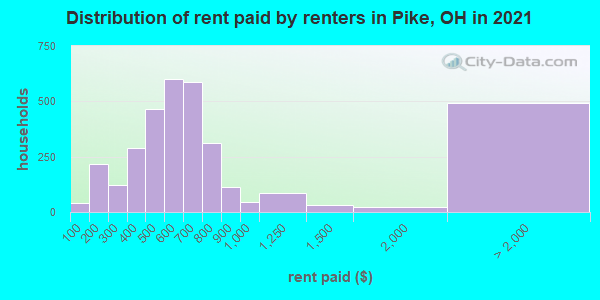
Median contract rent in 2022 for apartments: $582 (lower quartile is $445, upper quartile is $754)
| This county: | $582 |
| State: | $765 |
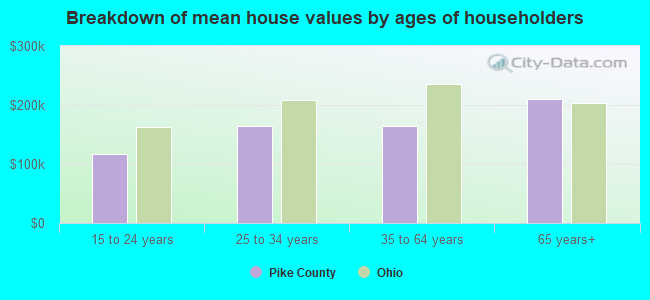
Estimated median house or condo value in 2022: $146,199 (it was $68,700 in 2000)
| Pike: | $146,199 |
| Ohio: | $204,100 |
Median monthly housing costs for homes and condos with a mortgage: $1,179
Median monthly housing costs for units without a mortgage: $447
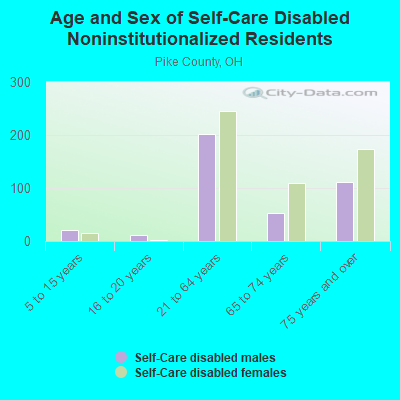
Institutionalized population: 408
Crime in 2021 (reported by the sheriff's office or county police, not the county total):
- Murders: 1
- Rapes: 4
- Robberies: 4
- Assaults: 34
- Burglaries: 73
- Thefts: 118
- Auto thefts: 36
Crime in 2020 (reported by the sheriff's office or county police, not the county total):
- Murders: 1
- Rapes: 18
- Robberies: 5
- Assaults: 31
- Burglaries: 125
- Thefts: 304
- Auto thefts: 107
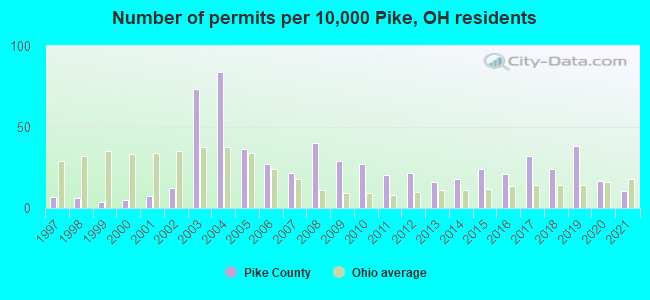
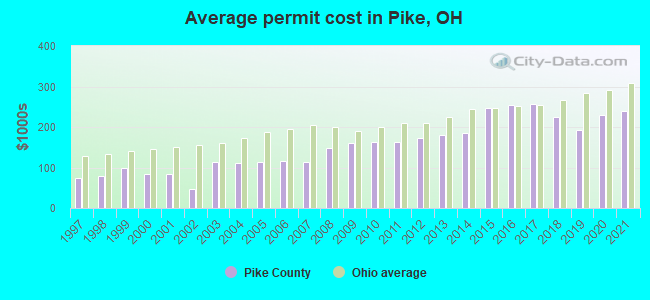
Single-family new house construction building permits:
- 2022: 26 buildings, average cost: $250,900
- 2021: 29 buildings, average cost: $238,600
- 2020: 46 buildings, average cost: $230,200
- 2019: 106 buildings, average cost: $192,400
- 2018: 66 buildings, average cost: $225,200
- 2017: 89 buildings, average cost: $257,700
- 2016: 58 buildings, average cost: $253,600
- 2015: 66 buildings, average cost: $246,100
- 2014: 49 buildings, average cost: $186,000
- 2013: 45 buildings, average cost: $180,400
- 2012: 60 buildings, average cost: $173,500
- 2011: 56 buildings, average cost: $163,100
- 2010: 75 buildings, average cost: $161,800
- 2009: 80 buildings, average cost: $160,400
- 2008: 111 buildings, average cost: $146,900
- 2007: 59 buildings, average cost: $112,800
- 2006: 76 buildings, average cost: $116,100
- 2005: 101 buildings, average cost: $113,800
- 2004: 233 buildings, average cost: $112,400
- 2003: 204 buildings, average cost: $114,000
- 2002: 35 buildings, average cost: $45,500
- 2001: 20 buildings, average cost: $85,200
- 2000: 14 buildings, average cost: $83,700
- 1999: 11 buildings, average cost: $97,600
- 1998: 17 buildings, average cost: $79,600
- 1997: 18 buildings, average cost: $74,300
Median real estate property taxes paid for housing units with mortgages in 2022: $1,347 (0.8%)
Median real estate property taxes paid for housing units with no mortgage in 2022: $1,016 (0.8%)

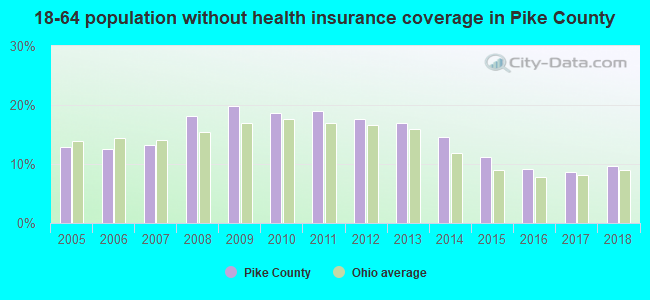
| Pike County: | 20.0% |
| Ohio: | 13.4% |
Median age of residents in 2022: 41.2 years old
(Males: 39.8 years old, Females: 42.7 years old)
(Median age for: White residents: 42.1 years old, Black residents: 26.8 years old, Asian residents: 43.3 years old, Hispanic or Latino residents: 34.2 years old)
Fair market rent in 2006 for a 1-bedroom apartment in Pike County is $427 a month.
Fair market rent for a 2-bedroom apartment is $511 a month.
Fair market rent for a 3-bedroom apartment is $612 a month.
Cities in this county include: Waverly City, Piketon, Beaver, Stockdale, Cynthiana.
| Zip Code | City | Tests | Max concentration | Min concentration | Arithmetic mean | Geometric mean | Standard deviation | Coefficient of variation | Mean concentration | First quartile | Third quartile |
|---|---|---|---|---|---|---|---|---|---|---|---|
| 45613 | Beaver | 17 | 6.4 | 0.1 | 1.91 | 0.85 | 2.3 | 120.33 | 1.00 | 0.20 | 1.95 |
| 45624 | Cynthiana | 4 | 0.2 | 0.2 | 0.2 | 0.2 | 0 | 0 | 0.20 | 0.20 | 0.20 |
| 45646 | Latham | 23 | 73.2 | 0.2 | 15.46 | 4.32 | 21.61 | 139.77 | 4.80 | 0.90 | 24.30 |
| 45661 | Piketon | 120 | 43.3 | 0.1 | 6.14 | 2.16 | 8.54 | 139.19 | 2.50 | 0.60 | 8.50 |
| 45690 | Waverly | 834 | 95.3 | 0 | 6.34 | 3.42 | 8.14 | 128.26 | 4.50 | 1.80 | 8.20 |
All concentrations are in units of pico-Curies of radiation per liter of air ( pCi/l ).
Neighboring counties: Mineral County, Nevada  , Clay County, Illinois , Montgomery County, Maryland
  , Clay County, Missouri , Hamilton County , Alexandria city, Virginia .
| Here: | 4.3% |
| Ohio: | 3.1% |

Current college students: 774
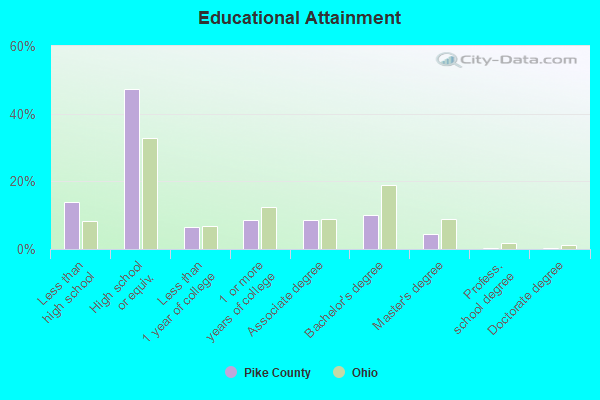
People 25 years of age or older with a high school degree or higher: 84.2%
People 25 years of age or older with a bachelor's degree or higher: 14.0%
Number of foreign born residents: 166 (33.4% naturalized citizens)
| Pike County: | 0.6% |
| Whole state: | 5.0% |

- Year of entry for the foreign-born population
- 112010 or later
- 962000 to 2009
- 61990 to 1999
- 41980 to 1989
- 91970 to 1979
- 65Before 1970
Mean travel time to work (commute): minutes
Percentage of county residents living and working in this county: 98.1%
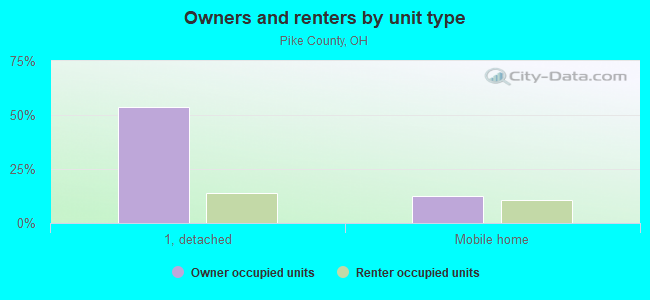
Housing units in structures:
- One, detached: 8,111
- One, attached: 128
- Two: 180
- 3 or 4: 89
- 5 to 9: 452
- 10 to 19: 51
- 20 to 49: 106
- 50 or more: 118
- Mobile homes: 2,789
- Boats, RVs, vans, etc.: 11
Housing units in Pike County with a mortgage: 3,500 (195 second mortgage, 7 home equity loan, 127 both second mortgage and home equity loan)
Houses without a mortgage: 33
| Here: | 8.3% with mortgage |
| State: | 95.2% with mortgage |
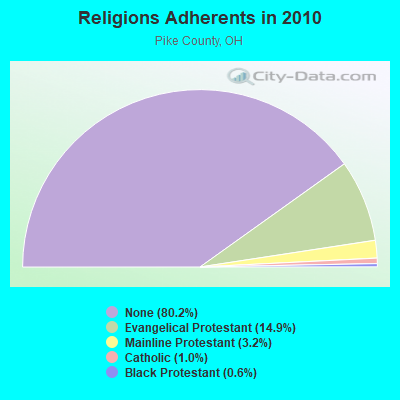
Religion statistics for Pike County
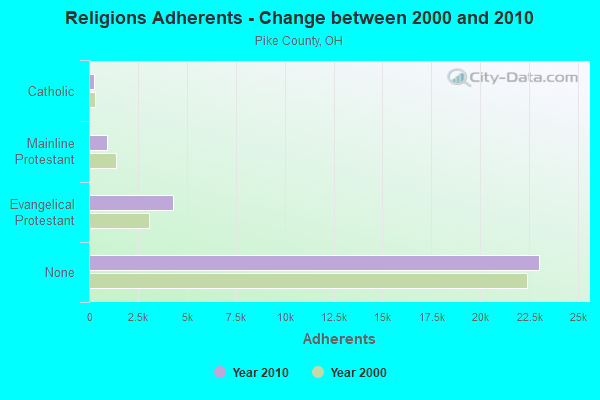
| Religion | Adherents | Congregations |
|---|---|---|
| Evangelical Protestant | 4,281 | 42 |
| Mainline Protestant | 933 | 10 |
| Catholic | 275 | 1 |
| Black Protestant | 185 | 1 |
| Other | 7 | 1 |
| None | 23,028 | - |
Source: Clifford Grammich, Kirk Hadaway, Richard Houseal, Dale E.Jones, Alexei Krindatch, Richie Stanley and Richard H.Taylor. 2012. 2010 U.S.Religion Census: Religious Congregations & Membership Study. Association of Statisticians of American Religious Bodies. Jones, Dale E., et al. 2002. Congregations and Membership in the United States 2000. Nashville, TN: Glenmary Research Center.
Food Environment Statistics:
| Pike County: | 1.79 / 10,000 pop. |
| State: | 1.89 / 10,000 pop. |
| Here: | 0.72 / 10,000 pop. |
| Ohio: | 0.13 / 10,000 pop. |
| This county: | 1.43 / 10,000 pop. |
| Ohio: | 1.25 / 10,000 pop. |
| Pike County: | 7.53 / 10,000 pop. |
| Ohio: | 2.93 / 10,000 pop. |
| This county: | 5.74 / 10,000 pop. |
| State: | 6.25 / 10,000 pop. |
| Pike County: | 10.4% |
| Ohio: | 10.3% |
| Pike County: | 29.3% |
| State: | 29.1% |
| Here: | 7.0% |
| State: | 11.9% |
Agriculture in Pike County:
Average size of farms: 166 acresAverage value of agricultural products sold per farm: $16,415
Average value of crops sold per acre for harvested cropland: $172.06
The value of nursery, greenhouse, floriculture, and sod as a percentage of the total market value of agricultural products sold: 2.60%
The value of livestock, poultry, and their products as a percentage of the total market value of agricultural products sold: 44.38%
Average total farm production expenses per farm: $20,207
Harvested cropland as a percentage of land in farms: 32.05%
Average market value of all machinery and equipment per farm: $42,531
The percentage of farms operated by a family or individual: 94.26%
Average age of principal farm operators: 56 years
Average number of cattle and calves per 100 acres of all land in farms: 9.92
Milk cows as a percentage of all cattle and calves: 11.51%
Corn for grain: 5559 harvested acres
All wheat for grain: 667 harvested acres
Soybeans for beans: 8528 harvested acres
Vegetables: 226 harvested acres
Land in orchards: 34 acres
Earthquake activity:
Pike County-area historical earthquake activity is significantly above Ohio state average. It is 12% greater than the overall U.S. average.On 7/27/1980 at 18:52:21, a magnitude 5.2 (5.1 MB, 4.7 MS, 5.0 UK, 5.2 UK, Class: Moderate, Intensity: VI - VII) earthquake occurred 77.4 miles away from Pike County center
On 8/23/2011 at 17:51:04, a magnitude 5.8 (5.8 MW, Depth: 3.7 mi) earthquake occurred 287.6 miles away from the county center
On 9/7/1988 at 02:28:09, a magnitude 4.6 (4.5 MB, 4.6 LG, Class: Light, Intensity: IV - V) earthquake occurred 78.8 miles away from the county center
On 9/25/1998 at 19:52:52, a magnitude 5.2 (4.8 MB, 4.3 MS, 5.2 LG, 4.5 MW, Depth: 3.1 mi) earthquake occurred 217.7 miles away from the county center
On 4/18/2008 at 09:36:59, a magnitude 5.4 (5.1 MB, 4.8 MS, 5.4 MW, 5.2 MW) earthquake occurred 265.0 miles away from Pike County center
On 8/9/2020 at 12:07:37, a magnitude 5.1 (5.1 MW, Depth: 4.7 mi) earthquake occurred 208.7 miles away from the county center
Magnitude types: regional Lg-wave magnitude (LG), body-wave magnitude (MB), surface-wave magnitude (MS), moment magnitude (MW)
Most recent natural disasters:
- Ohio Covid-19 Pandemic, Incident Period: January 20, 2020, FEMA Id: 4507, Natural disaster type: Other
- Ohio Severe Storms, Flooding, And Landslides, Incident Period: February 5, 2019 - February 13, 2019, FEMA Id: 4424, Natural disaster type: Storm, Landslide, Flood
- Ohio Severe Storms, Landslides, And Mudslides, Incident Period: February 14, 2018 - February 25, 2018, FEMA Id: 4360, Natural disaster type: Storm, Mudslide, Landslide
- Ohio Severe Storms and Straight-line Winds, Incident Period: June 29, 2012 to July 02, 2012, Major Disaster (Presidential) Declared DR-4077: August 20, 2012, FEMA Id: 4077, Natural disaster type: Storm, Wind
- Ohio Severe Storms and Flooding, Incident Period: April 04, 2011 to May 15, 2011, Major Disaster (Presidential) Declared DR-4002: July 13, 2011, FEMA Id: 4002, Natural disaster type: Storm, Flood
- Ohio Hurricane Katrina Evacuation, Incident Period: August 29, 2005 to October 01, 2005, Emergency Declared EM-3250: September 13, 2005, FEMA Id: 3250, Natural disaster type: Hurricane
- Ohio Severe Winter Storms, Flooding and Mudslides, Incident Period: December 22, 2004 to February 01, 2005, Major Disaster (Presidential) Declared DR-1580: February 15, 2005, FEMA Id: 1580, Natural disaster type: Winter Storm, Mudslide, Flood
- Ohio Severe Storms and Flooding, Incident Period: July 04, 2003 to July 11, 2003, Major Disaster (Presidential) Declared DR-1478: July 15, 2003, FEMA Id: 1478, Natural disaster type: Storm, Flood
- Ohio Severe Winter Storm, Incident Period: February 14, 2003 to March 18, 2003, Major Disaster (Presidential) Declared DR-1453: March 14, 2003, FEMA Id: 1453, Natural disaster type: Winter Storm
- Ohio Severe Storms And Flooding, Incident Period: February 18, 2000 to March 02, 2000, Major Disaster (Presidential) Declared DR-1321: March 07, 2000, FEMA Id: 1321, Natural disaster type: Storm, Flood
- 4 other natural disasters have been reported since 1953.
The number of natural disasters in Pike County (14) is near the US average (15).
Major Disasters (Presidential) Declared: 9
Emergencies Declared: 2
Causes of natural disasters: Floods: 8, Storms: 8, Landslides: 2, Mudslides: 2, Winter Storms: 2, Blizzard: 1, Heavy Rain: 1, Hurricane: 1, Snowstorm: 1, Tornado: 1, Wind: 1, Other: 1 (Note: some incidents may be assigned to more than one category).
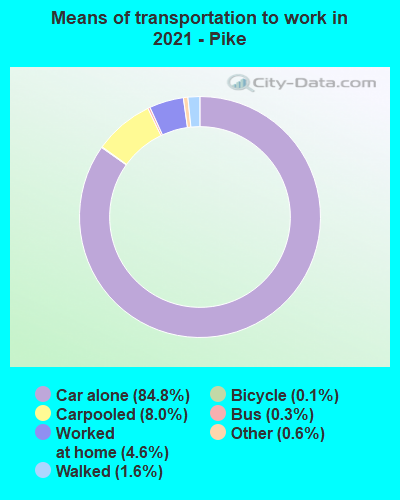
Means of transportation to work:
- Drove a car alone: 8,507 (80.8%)
- Carpooled: 861 (8.2%)
- Bus: 17 (0.2%)
- Taxicab, motorcycle, or other means: 37 (0.4%)
- Bicycle: 21 (0.2%)
- Walked: 170 (1.6%)
- Worked at home: 736 (7.0%)
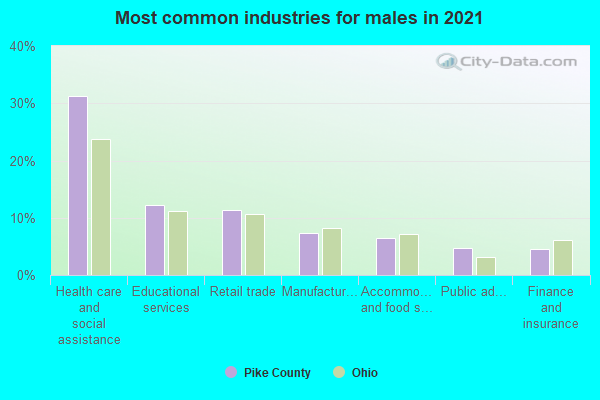
- Health care and social assistance (30%)
- Educational services (11%)
- Retail trade (10%)
- Accommodation and food services (10%)
- Public administration (5%)
- Manufacturing (5%)
- Transportation and warehousing (3%)
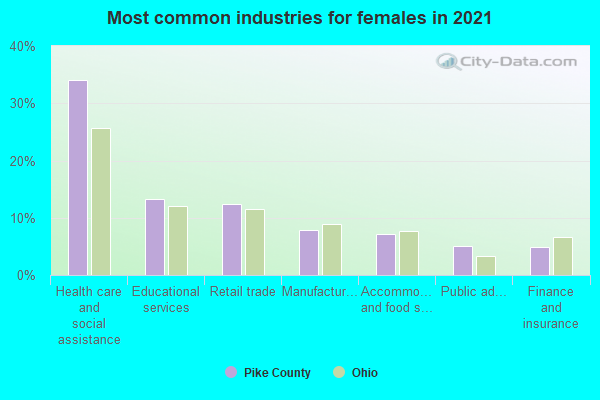
- Health care and social assistance (34%)
- Educational services (12%)
- Retail trade (12%)
- Accommodation and food services (11%)
- Public administration (6%)
- Manufacturing (6%)
- Transportation and warehousing (4%)
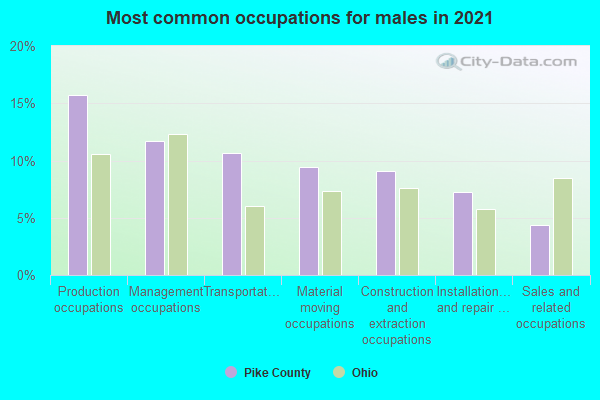
- Production occupations (15%)
- Management occupations (12%)
- Transportation occupations (10%)
- Material moving occupations (9%)
- Installation, maintenance, and repair occupations (9%)
- Construction and extraction occupations (9%)
- Sales and related occupations (6%)
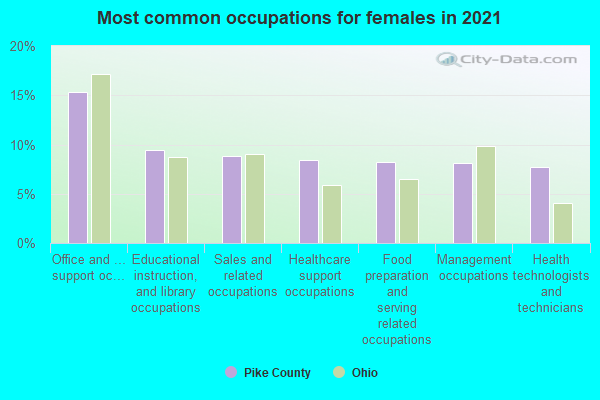
- Office and administrative support occupations (14%)
- Food preparation and serving related occupations (11%)
- Educational instruction, and library occupations (9%)
- Management occupations (9%)
- Healthcare support occupations (9%)
- Sales and related occupations (8%)
- Health technologists and technicians (7%)
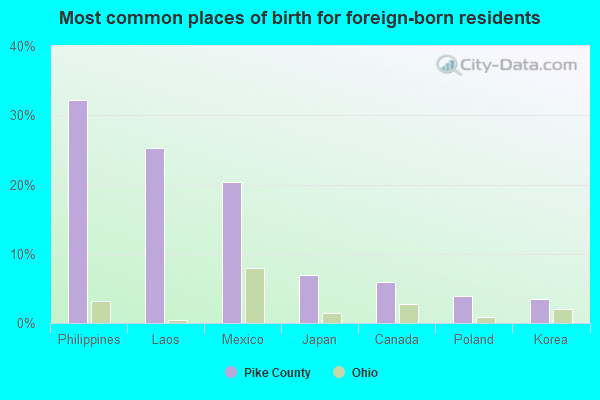
- Mexico (39%)
- Philippines (20%)
- Laos (13%)
- Korea (11%)
- Poland (6%)
- Canada (4%)
- Japan (3%)
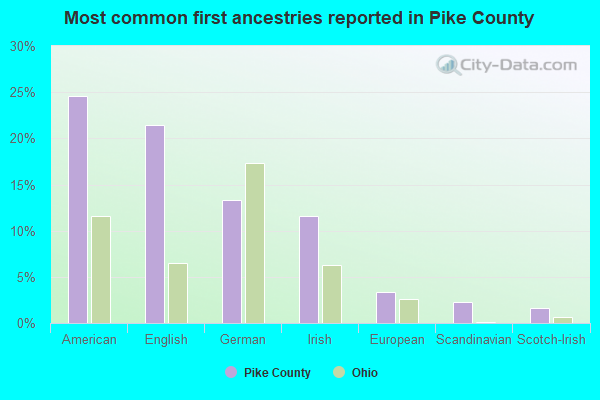
- American (26%)
- English (20%)
- German (17%)
- Irish (10%)
- European (3%)
- Scottish (2%)
- Scotch-Irish (1%)
People in group quarters in Pike County, Ohio in 2010:
- 357 people in nursing facilities/skilled-nursing facilities
- 51 people in state prisons
- 38 people in residential treatment centers for adults
- 37 people in group homes intended for adults
- 13 people in emergency and transitional shelters (with sleeping facilities) for people experiencing homelessness
People in group quarters in Pike County, Ohio in 2000:
- 364 people in nursing homes
- 50 people in schools, hospitals, or wards for the intellectually disabled
- 33 people in other noninstitutional group quarters
- 28 people in homes for the mentally retarded
- 7 people in homes for the mentally ill
- 2 people in local jails and other confinement facilities (including police lockups)
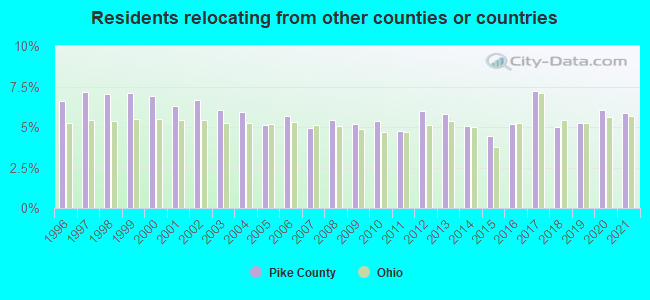
5.88% of this county's 2021 resident taxpayers lived in other counties in 2020 ($41,794 average adjusted gross income)
| Here: | 5.88% |
| Ohio average: | 5.68% |
10 or fewer of this county's residents moved from foreign countries.
5.10% relocated from other counties in Ohio ($35,667 average AGI)
0.77% relocated from other states ($6,128 average AGI)
Pike County: 0.77% Ohio average: 1.92%
Top counties from which taxpayers relocated into this county between 2020 and 2021:
| from Ross County, OH | |
| from Scioto County, OH | |
| from Franklin County, OH | |
| from Jackson County, OH |
5.57% of this county's 2020 resident taxpayers moved to other counties in 2021 ($38,196 average adjusted gross income)
| Here: | 5.57% |
| Ohio average: | 5.79% |
10 or fewer of this county's residents moved to foreign countries.
4.62% relocated to other counties in Ohio ($30,377 average AGI)
0.95% relocated to other states ($7,819 average AGI)
Pike County: 0.95% Ohio average: 2.05%

Top counties to which taxpayers relocated from this county between 2020 and 2021:
| to Ross County, OH | |
| to Scioto County, OH | |
| to Jackson County, OH | |
| to Franklin County, OH | |
| to Pickaway County, OH |
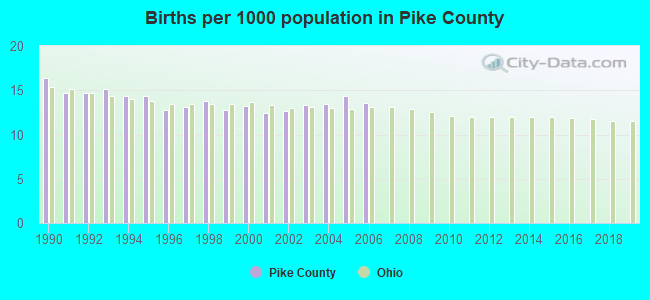
Births per 1000 population from 1990 to 1999: 14.2
Births per 1000 population from 2000 to 2006: 13.3
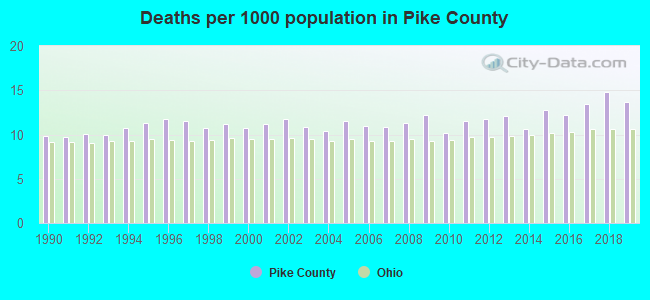
Deaths per 1000 population from 1990 to 1999: 10.7
Deaths per 1000 population from 2000 to 2009: 11.2
Deaths per 1000 population from 2010 to 2020: 12.6
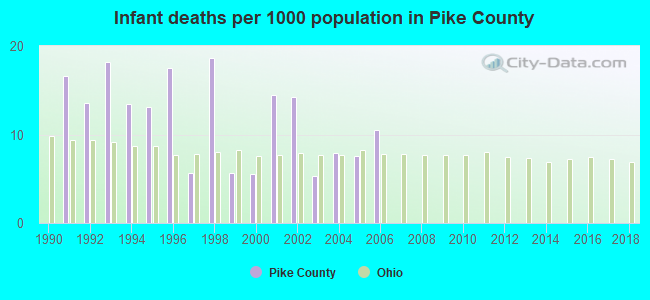
Infant deaths per 1000 live births from 1990 to 1999: 12.2
Infant deaths per 1000 live births from 2000 to 2006: 9.4
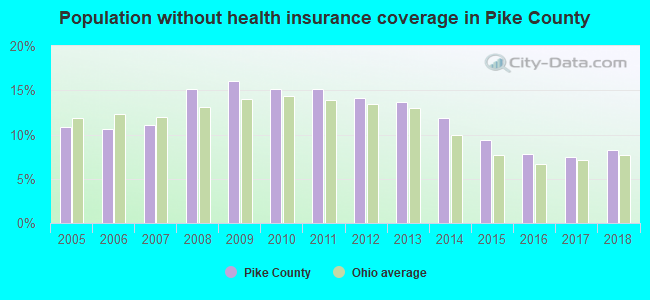
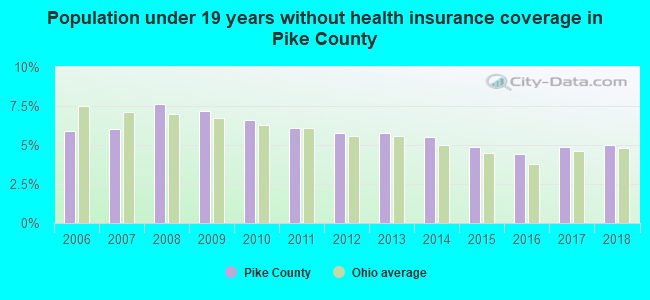
Persons under 19 years old without health insurance coverage in 2018: 5.0%
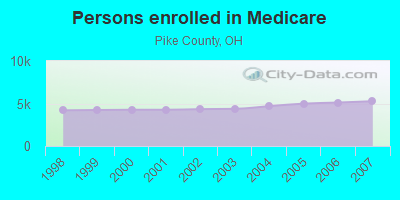
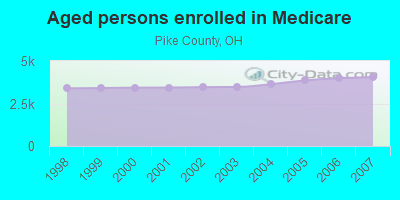
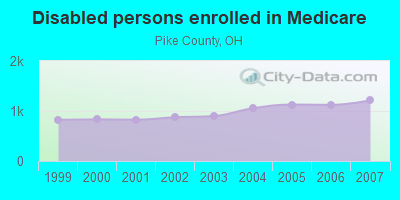
Persons enrolled in hospital insurance and/or supplemental medical insurance (Medicare) in July 1, 2007: 5,268 (4,056 aged, 1,212 disabled)
Children under 18 without health insurance coverage in 2007: 390 (5%)
Most common underlying causes of death in Pike County, Ohio in 1999 - 2019:
- Acute myocardial infarction, unspecified (490)
- Bronchus or lung, unspecified - Malignant neoplasms (469)
- Atherosclerotic heart disease (436)
- Chronic obstructive pulmonary disease, unspecified (342)
- Unspecified dementia (338)
- Congestive heart failure (227)
- Pneumonia, unspecified (156)
- Stroke, not specified as haemorrhage or infarction (80)
- Other ill-defined and unspecified causes of mortality (62)
- Alzheimer disease, unspecified (44)
Population without health insurance coverage in 2000: 15%
Children under 18 without health insurance coverage in 2000: 12%
Short term general hospital admissions per 100,000 population in 2004: 4,538
Short term general hospital beds per 100,000 population in 2004: 117
Emergency room visits per 100,000 population in 2004: 55,301
General practice office based MDs per 100,000 population in 2005: 1,400
Medical specialist MDs per 100,000 population in 2005: 1,133
Dentists per 100,000 population in 1998: 7
Total births per 100,000 population, July 2005 - July 2006 : 14
Total deaths per 100,000 population, July 2005 - July 2006: 68
Limited-service eating places per 100,000 population in 2005 : 7
Crimes per 100,000 population in 1996: 1
Suicides per 1,000,000 population from 2000 to 2006: 123.0. This is more than state average.
Household type by relationship:
Households: 27,108- Male householders: 5,067 (1,577 living alone), Female householders: 5,624 (1,370 living alone)
5,259 spouses (5,191 opposite-sex spouses), 973 unmarried partners, (973 opposite-sex unmarried partners), 7,404 children (6,476 natural, 105 adopted, 799 stepchildren), 884 grandchildren, 198 brothers or sisters, 502 parents, 113 foster children, 300 other relatives, 376 non-relatives
- In group quarters: 390
Size of family households: 3,216 2-persons, 1,469 3-persons, 1,403 4-persons, 599 5-persons, 299 6-persons, 209 7-or-more-persons.
Size of nonfamily households: 2,944 1-person, 479 2-persons, 17 3-persons, 9 4-persons.
3,459 married couples with children.
1,679 single-parent households (654 men, 1,025 women).
98.1% of residents of Pike speak English at home.
0.5% of residents speak Spanish at home (57% speak English very well, 23% speak English well, 20% speak English not well).
0.8% of residents speak other Indo-European language at home (96% speak English very well, 4% speak English well).
0.4% of residents speak Asian or Pacific Island language at home (32% speak English very well, 52% speak English well, 16% speak English not well).
In fiscal year 2004:
Federal Government expenditure: $245,945,000 ($8,692 per capita)
Department of Defense expenditure: $2,232,000
Federal direct payments to individuals for retirement and disability: $66,082,000
Federal other direct payments to individuals: $29,645,000
Federal direct payments not to individuals: $1,674,000
Federal grants: $62,363,000
Federal procurement contracts: $81,933,000 ($147,000 Department of Defense)
Federal salaries and wages: $4,248,000 ($75,000 Department of Defense)
Federal Government direct loans: $849,000
Federal guaranteed/insured loans: $4,696,000
Federal Government insurance: $16,166,000
Population change from April 1, 2000 to July 1, 2005:
Births: 1,967| Here: | 70 per 1000 residents |
| State: | 69 per 1000 residents |
Deaths: 1,599
| Here: | 57 per 1000 residents |
| State: | 50 per 1000 residents |
Net international migration: +48
| Here: | +2 per 1000 residents |
| State: | +7 per 1000 residents |
Net internal migration: +75
| Here: | |
| State: |
Total withdrawal of fresh water for public supply: 2.42 millions of gallons per day (all from ground)
| Here: | 6.3 |
| State: | 6.7 |
| Here: | 4.7 |
| State: | 4.4 |
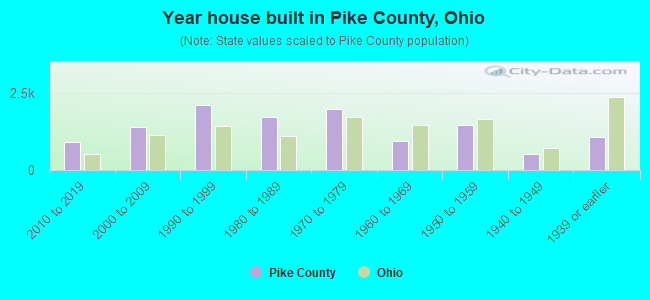
- Year house built in Pike County, Ohio
- 562020 or later
- 8992010 to 2019
- 1,2382000 to 2009
- 2,1841990 to 1999
- 1,7121980 to 1989
- 1,9601970 to 1979
- 9691960 to 1969
- 1,4771950 to 1959
- 5631940 to 1949
- 9741939 or earlier
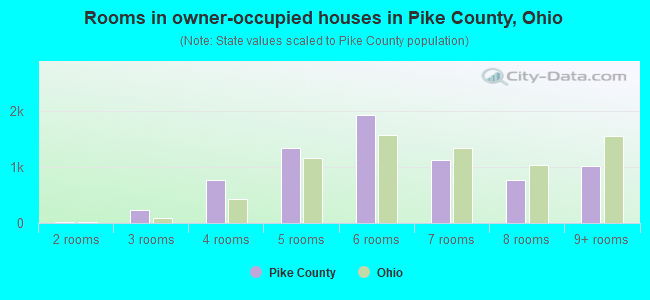
- Rooms in owner-occupied houses in Pike County, Ohio
- 01 room
- 342 rooms
- 2513 rooms
- 6844 rooms
- 1,2445 rooms
- 1,6846 rooms
- 1,1527 rooms
- 8968 rooms
- 1,1499+ rooms

- Rooms in renter-occupied apartments in Pike County, Ohio
- 421 room
- 252 rooms
- 3963 rooms
- 1,1944 rooms
- 9745 rooms
- 4626 rooms
- 2827 rooms
- 1748 rooms
- 349+ rooms
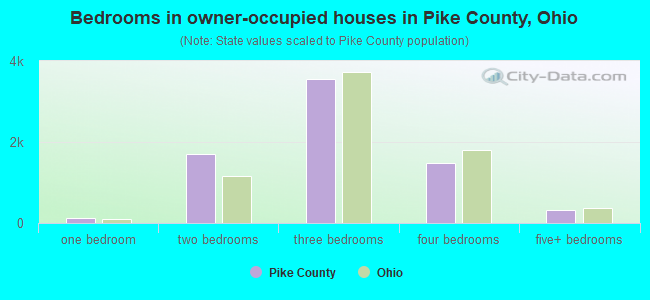
- Bedrooms in owner-occupied houses in Pike County, Ohio
- 0no bedroom
- 1561 bedroom
- 1,7432 bedrooms
- 3,2723 bedrooms
- 1,6174 bedrooms
- 3005+ bedrooms

- Bedrooms in renter-occupied apartments in Pike County, Ohio
- 43no bedroom
- 3871 bedroom
- 1,5072 bedrooms
- 1,3133 bedrooms
- 3064 bedrooms
- 345+ bedrooms
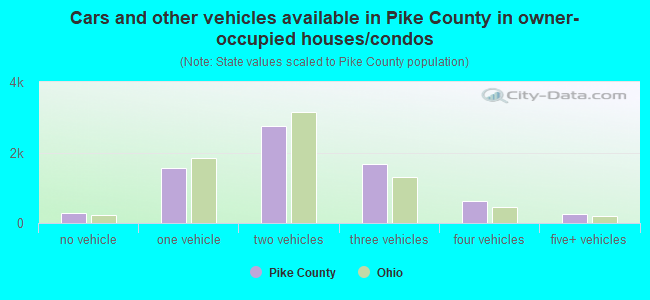
- Cars and other vehicles available in Pike County in owner-occupied houses/condos
- 254no vehicle
- 1,5661 vehicle
- 2,5952 vehicles
- 1,6863 vehicles
- 7104 vehicles
- 2265+ vehicles
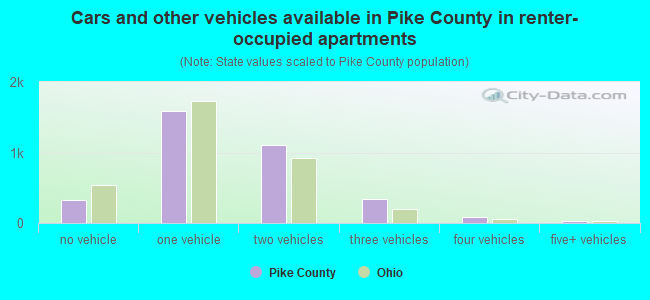
- Cars and other vehicles available in Pike County in renter-occupied apartments
- 383no vehicle
- 1,6901 vehicle
- 1,0442 vehicles
- 3803 vehicles
- 854 vehicles
- 215+ vehicles
92.6% of Pike County residents lived in the same house 1 years ago.
Out of people who lived in different houses, 36% lived in this county.
Out of people who lived in different counties, 88% lived in Ohio.
| Pike County: | 92.6% |
| State average: | 87.8% |
Place of birth for U.S.-born residents:
- This state: 23,519
- Other state: 3,261
- Northeast: 322
- Midwest: 541
- South: 2,067
- West: 304
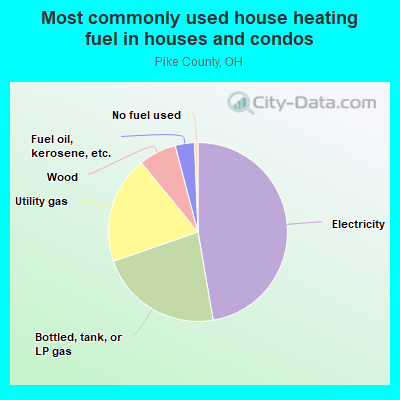
- 46.5%Electricity
- 24.3%Bottled, tank, or LP gas
- 20.9%Utility gas
- 5.3%Wood
- 2.5%Fuel oil, kerosene, etc.
- 0.6%No fuel used

- 56.2%Electricity
- 24.7%Utility gas
- 12.8%Bottled, tank, or LP gas
- 3.0%Wood
- 2.5%Fuel oil, kerosene, etc.
- 0.4%No fuel used
- 0.3%Other fuel
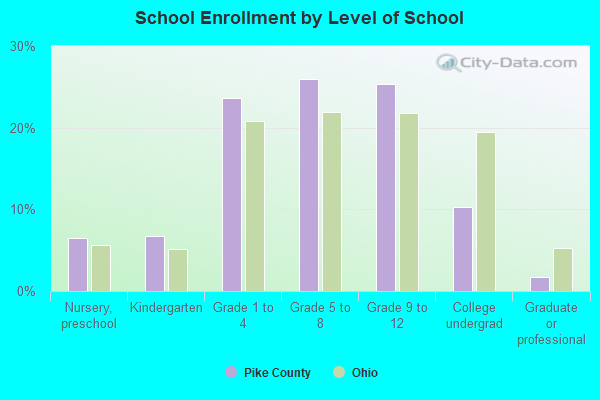
Private vs. public school enrollment:
| Here: | 10.1% |
| Ohio: | 16.0% |
| Here: | 2.9% |
| Ohio: | 13.1% |
| Here: | 4.9% |
| Ohio: | 22.3% |
Pike County government finances - Expenditure in 2018:
- Charges - Other: $3,647,000
Sewerage: $604,000
- Construction - General - Other: $2,062,000
- Current Operations - Public Welfare - Other: $6,784,000
Police Protection: $6,309,000
Central Staff Services: $5,538,000
Health - Other: $5,029,000
Regular Highways: $3,715,000
Judicial and Legal Services: $1,769,000
General - Other: $866,000
Sewerage: $645,000
Parks and Recreation: $58,000
- General - Interest on Debt: $349,000
- Long Term Debt - Beginning Outstanding - Unspecified Public Purpose: $8,720,000
Outstanding Unspecified Public Purpose: $7,849,000
Retired Unspecified Public Purpose: $871,000
- Miscellaneous - General Revenue - Other: $1,477,000
Fines and Forfeits: $248,000
Interest Earnings: $168,000
- Other Funds - Cash and Securities: $21,438,000
- State Intergovernmental - Other: $8,448,000
Highways: $6,329,000
- Tax - Property: $5,643,000
General Sales and Gross Receipts: $3,572,000
Other License: $4,000
Pike County government finances - Revenue in 2018:
- Charges - Other: $3,647,000
Sewerage: $604,000
- Construction - General - Other: $2,062,000
- Current Operations - Public Welfare - Other: $6,784,000
Police Protection: $6,309,000
Central Staff Services: $5,538,000
Health - Other: $5,029,000
Regular Highways: $3,715,000
Judicial and Legal Services: $1,769,000
General - Other: $866,000
Sewerage: $645,000
Parks and Recreation: $58,000
- General - Interest on Debt: $349,000
- Long Term Debt - Beginning Outstanding - Unspecified Public Purpose: $8,720,000
Outstanding Unspecified Public Purpose: $7,849,000
Retired Unspecified Public Purpose: $871,000
- Miscellaneous - General Revenue - Other: $1,477,000
Fines and Forfeits: $248,000
Interest Earnings: $168,000
- Other Funds - Cash and Securities: $21,438,000
- State Intergovernmental - Other: $8,448,000
Highways: $6,329,000
- Tax - Property: $5,643,000
General Sales and Gross Receipts: $3,572,000
Other License: $4,000
Pike County government finances - Debt in 2018:
- Charges - Other: $3,647,000
Sewerage: $604,000
- Construction - General - Other: $2,062,000
- Current Operations - Public Welfare - Other: $6,784,000
Police Protection: $6,309,000
Central Staff Services: $5,538,000
Health - Other: $5,029,000
Regular Highways: $3,715,000
Judicial and Legal Services: $1,769,000
General - Other: $866,000
Sewerage: $645,000
Parks and Recreation: $58,000
- General - Interest on Debt: $349,000
- Long Term Debt - Beginning Outstanding - Unspecified Public Purpose: $8,720,000
Outstanding Unspecified Public Purpose: $7,849,000
Retired Unspecified Public Purpose: $871,000
- Miscellaneous - General Revenue - Other: $1,477,000
Fines and Forfeits: $248,000
Interest Earnings: $168,000
- Other Funds - Cash and Securities: $21,438,000
- State Intergovernmental - Other: $8,448,000
Highways: $6,329,000
- Tax - Property: $5,643,000
General Sales and Gross Receipts: $3,572,000
Other License: $4,000
Pike County government finances - Cash and Securities in 2018:
- Charges - Other: $3,647,000
Sewerage: $604,000
- Construction - General - Other: $2,062,000
- Current Operations - Public Welfare - Other: $6,784,000
Police Protection: $6,309,000
Central Staff Services: $5,538,000
Health - Other: $5,029,000
Regular Highways: $3,715,000
Judicial and Legal Services: $1,769,000
General - Other: $866,000
Sewerage: $645,000
Parks and Recreation: $58,000
- General - Interest on Debt: $349,000
- Long Term Debt - Beginning Outstanding - Unspecified Public Purpose: $8,720,000
Outstanding Unspecified Public Purpose: $7,849,000
Retired Unspecified Public Purpose: $871,000
- Miscellaneous - General Revenue - Other: $1,477,000
Fines and Forfeits: $248,000
Interest Earnings: $168,000
- Other Funds - Cash and Securities: $21,438,000
- State Intergovernmental - Other: $8,448,000
Highways: $6,329,000
- Tax - Property: $5,643,000
General Sales and Gross Receipts: $3,572,000
Other License: $4,000
Supplemental Security Income (SSI) in 2006:
- Total number of recipients: 1,710
- Number of aged recipients: 73
- Number of blind and disabled recipients: 1,637
- Number of recipients under 18: 167
- Number of recipients between 18 and 64: 1,263
- Number of recipients older than 64: 280
- Number of recipients also receiving OASDI: 485
- Amount of payments (thousands of dollars): 826
| Most common first names in Pike County, OH among deceased individuals | ||
| Name | Count | Lived (average) |
|---|---|---|
| Mary | 87 | 77.7 years |
| James | 79 | 73.1 years |
| Charles | 70 | 73.0 years |
| John | 69 | 77.2 years |
| William | 65 | 75.0 years |
| Robert | 64 | 70.0 years |
| George | 35 | 75.0 years |
| Paul | 34 | 69.8 years |
| Ruth | 33 | 80.5 years |
| Anna | 32 | 81.4 years |
| Most common last names in Pike County, OH among deceased individuals | ||
| Last name | Count | Lived (average) |
|---|---|---|
| Smith | 58 | 74.8 years |
| Williams | 52 | 77.3 years |
| Harris | 37 | 68.2 years |
| Montgomery | 28 | 76.0 years |
| Mustard | 27 | 75.1 years |
| Davis | 26 | 74.7 years |
| Thompson | 23 | 68.7 years |
| Brown | 23 | 76.2 years |
| Adams | 21 | 80.5 years |
| Tackett | 21 | 68.0 years |
| Businesses in Pike County, OH | ||||
| Name | Count | Name | Count | |
|---|---|---|---|---|
| Ace Hardware | 1 | MasterBrand Cabinets | 3 | |
| Advance Auto Parts | 1 | McDonald's | 1 | |
| Arby's | 1 | Pizza Hut | 1 | |
| AutoZone | 1 | RadioShack | 1 | |
| Burger King | 1 | Rite Aid | 1 | |
| Chevrolet | 1 | Subway | 1 | |
| Comfort Inn | 1 | T-Mobile | 1 | |
| Dairy Queen | 1 | Taco Bell | 1 | |
| FedEx | 1 | Tim Hortons | 1 | |
| Ford | 1 | U-Haul | 1 | |
| H&R Block | 1 | UPS | 3 | |
| KFC | 1 | Walmart | 1 | |
| Kroger | 1 | Wendy's | 1 | |
| Little Caesars Pizza | 1 | YMCA | 1 | |