Perry County, Ohio (OH)
County owner-occupied free and clear houses and condos in 2010: 3,750
County owner-occupied houses and condos in 2000: 9,923
Renter-occupied apartments: 3,349 (it was 2,577 in 2000)
| % of renters here: | 21% |
| State: | 32% |
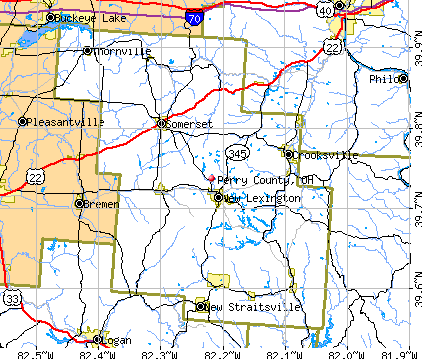
Land area: 410 sq. mi.
Water area: 2.8 sq. mi.
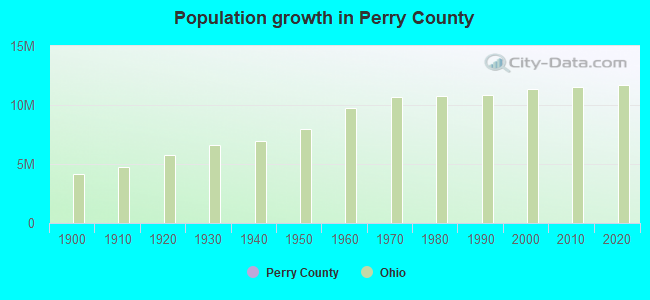
Population density: 86 people per square mile (average).
Industries providing employment: Educational, health and social services (24.2%), Manufacturing (14.5%), Construction (11.8%), Transportation and warehousing,and utilities (11.6%), Retail trade (11.3%).
Type of workers:
- Private wage or salary: 80%
- Government: 16%
- Self-employed, not incorporated: 4%
- Unpaid family work: 0%
- OSM Map
- General Map
- Google Map
- MSN Map

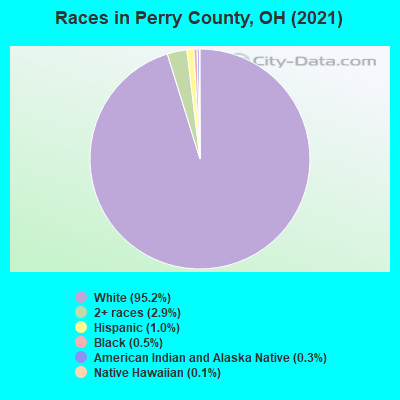
- 33,42095.0%White Non-Hispanic Alone
- 1,1563.3%Two or more races
- 3611.0%Hispanic or Latino
- 890.3%Black Non-Hispanic Alone
- 870.2%Some other race alone
- 360.1%American Indian and Alaska Native alone
- 290.08%Asian alone
| Median resident age: | 41.4 years |
| Ohio median age: | 39.9 years |
| Males: 17,856 | |
| Females: 17,538 |

 | Will Columbus become largest Ohio metro? (887 replies) |
| Cleveland-Akron MSA merger (Projection) (40 replies) |
| Columbus and Seniors (2 replies) |
| Best Movie that's been shot in Ohio? (86 replies) |
| July 1, 2014 County and Metro Population Estimates (6 replies) |
| Best Small Towns in Ohio (22 replies) |
| Perry County: | 2.0 people |
| Ohio: | 2 people |
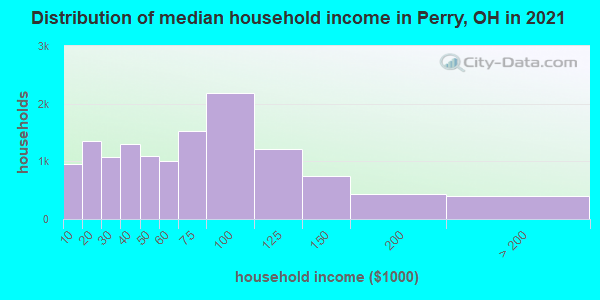
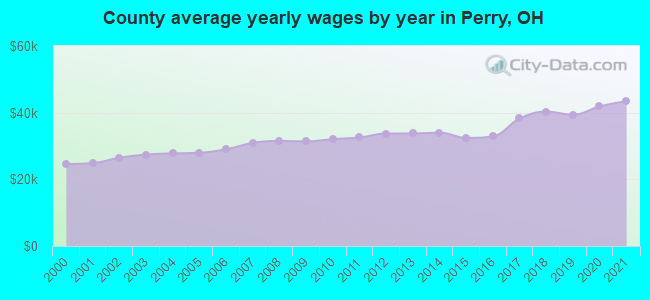
Estimated median household income in 2022: $61,706 ($34,383 in 1999)
| This county: | $61,706 |
| Ohio: | $65,720 |
Median contract rent in 2022 for apartments: $522 (lower quartile is $310, upper quartile is $661)
| This county: | $522 |
| State: | $765 |
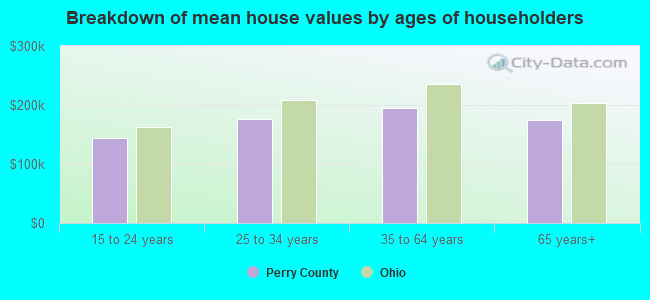
Estimated median house or condo value in 2022: $179,604 (it was $71,700 in 2000)
| Perry: | $179,604 |
| Ohio: | $204,100 |
Mean price in 2022:
Median monthly housing costs for homes and condos with a mortgage: $1,179Detached houses: $258,530
Here: $258,530 State: $254,366 Townhouses or other attached units: $127,375
Here: $127,375 State: $225,733 In 2-unit structures: $104,989
Here: $104,989 State: $144,384 In 3-to-4-unit structures: $224,314
Here: $224,314 State: $203,002 Mobile homes: $108,594
Here: $108,594 State: $62,719
Median monthly housing costs for units without a mortgage: $463
Institutionalized population: 224
Crime in 2021 (reported by the sheriff's office or county police, not the county total):
- Murders: 0
- Rapes: 0
- Robberies: 0
- Assaults: 0
- Burglaries: 20
- Thefts: 7
- Auto thefts: 1
Crime in 2020 (reported by the sheriff's office or county police, not the county total):
- Murders: 0
- Rapes: 1
- Robberies: 0
- Assaults: 3
- Burglaries: 10
- Thefts: 32
- Auto thefts: 7
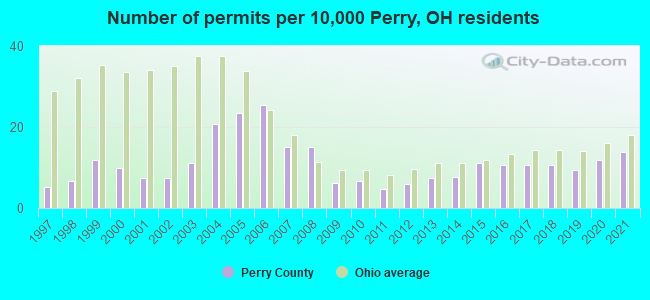
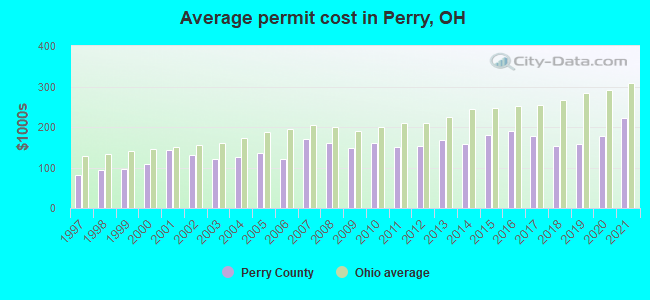
Single-family new house construction building permits:
- 2022: 28 buildings, average cost: $193,200
- 2021: 47 buildings, average cost: $223,100
- 2020: 40 buildings, average cost: $177,500
- 2019: 32 buildings, average cost: $157,900
- 2018: 36 buildings, average cost: $153,800
- 2017: 36 buildings, average cost: $179,100
- 2016: 36 buildings, average cost: $189,700
- 2015: 38 buildings, average cost: $179,500
- 2014: 26 buildings, average cost: $159,100
- 2013: 25 buildings, average cost: $166,800
- 2012: 20 buildings, average cost: $151,600
- 2011: 16 buildings, average cost: $150,400
- 2010: 23 buildings, average cost: $160,200
- 2009: 21 buildings, average cost: $149,200
- 2008: 51 buildings, average cost: $160,900
- 2007: 51 buildings, average cost: $169,900
- 2006: 87 buildings, average cost: $120,100
- 2005: 80 buildings, average cost: $136,200
- 2004: 71 buildings, average cost: $125,500
- 2003: 38 buildings, average cost: $121,200
- 2002: 25 buildings, average cost: $130,000
- 2001: 25 buildings, average cost: $143,600
- 2000: 34 buildings, average cost: $108,800
- 1999: 40 buildings, average cost: $97,200
- 1998: 23 buildings, average cost: $93,900
- 1997: 18 buildings, average cost: $82,200
Median real estate property taxes paid for housing units with mortgages in 2022: $1,691 (0.9%)
Median real estate property taxes paid for housing units with no mortgage in 2022: $1,419 (0.9%)


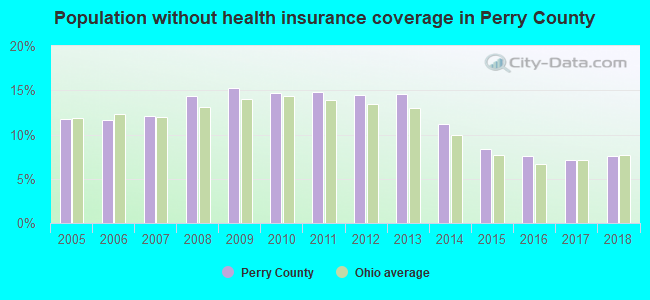
| Perry County: | 15.5% |
| Ohio: | 13.4% |
Median age of residents in 2022: 41.4 years old
(Males: 41.6 years old, Females: 41.4 years old)
(Median age for: White residents: 41.5 years old, Black residents: 44.1 years old, American Indian residents: 48.2 years old, Asian residents: 44.7 years old, Hispanic or Latino residents: 32.3 years old, Other race residents: 49.1 years old)
Fair market rent in 2006 for a 1-bedroom apartment in Perry County is $424 a month.
Fair market rent for a 2-bedroom apartment is $510 a month.
Fair market rent for a 3-bedroom apartment is $638 a month.
Cities in this county include: New Lexington, Crooksville, Somerset, Thornport, Junction City, New Straitsville, Thornville, Shawnee, Corning, Glenford.
| Zip Code | City | Tests | Max concentration | Min concentration | Arithmetic mean | Geometric mean | Standard deviation | Coefficient of variation | Mean concentration | First quartile | Third quartile |
|---|---|---|---|---|---|---|---|---|---|---|---|
| 43076 | Thornville | 132 | 274.5 | 0.2 | 16.16 | 4.54 | 41.16 | 254.74 | 4.25 | 2.10 | 7.80 |
| 43730 | Corning | 6 | 4.8 | 0.6 | 2.58 | 1.73 | 2.11 | 81.77 | 2.40 | 0.65 | 4.35 |
| 43731 | Crooksville | 16 | 6.5 | 0.6 | 3.42 | 2.91 | 1.81 | 53.05 | 3.00 | 2.10 | 4.70 |
| 43739 | Glenford | 12 | 19.4 | 2 | 8.13 | 6.24 | 5.87 | 72.22 | 5.55 | 2.50 | 13.60 |
| 43748 | Junction City | 8 | 11.1 | 0.8 | 3.56 | 2.42 | 3.55 | 99.73 | 2.00 | 1.00 | 3.90 |
| 43760 | Mount Perry | 9 | 3.1 | 0.5 | 2.02 | 1.75 | 0.93 | 45.98 | 2.40 | 0.98 | 2.40 |
| 43761 | Moxahala | 1 | 3.8 | 3.8 | 3.8 | 3.8 | 3.80 | 1.48 | 3.45 | ||
| 43764 | New Lexington | 32 | 15.8 | 0.1 | 4.52 | 2.87 | 4.3 | 95.25 | 3.25 | 1.30 | 5.70 |
| 43766 | New Straitsville | 4 | 2.4 | 1.3 | 1.8 | 1.75 | 0.47 | 26.06 | 1.75 | 1.30 | 1.90 |
| 43783 | Somerset | 18 | 18.8 | 1 | 4.48 | 3.28 | 4.27 | 95.33 | 3.05 | 1.65 | 5.75 |
All concentrations are in units of pico-Curies of radiation per liter of air ( pCi/l ).
Neighboring counties: Burlington County, New Jersey  , Denver County, Colorado
  , Jefferson County, Colorado , Jefferson County, Colorado , Guernsey County
  , Summit County, Colorado , Marion County, Missouri .
| Here: | 3.8% |
| Ohio: | 3.1% |
Current college students: 1,068
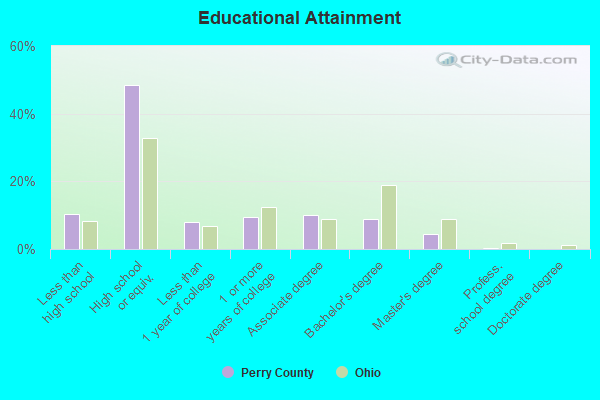
People 25 years of age or older with a high school degree or higher: 88.0%
People 25 years of age or older with a bachelor's degree or higher: 14.8%
Number of foreign born residents: 202 (41.3% naturalized citizens)
| Perry County: | 0.6% |
| Whole state: | 5.0% |
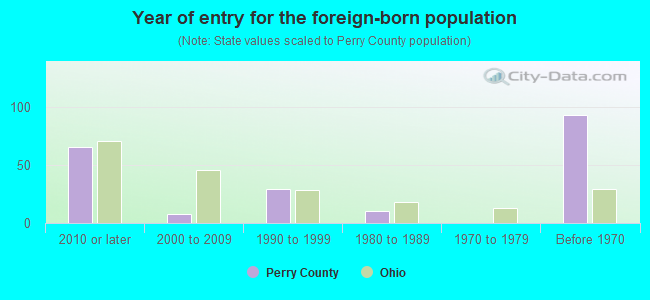
- Year of entry for the foreign-born population
- 552010 or later
- 122000 to 2009
- 561990 to 1999
- 101980 to 1989
- 01970 to 1979
- 93Before 1970
Mean travel time to work (commute): minutes
Percentage of county residents living and working in this county: 99.0%
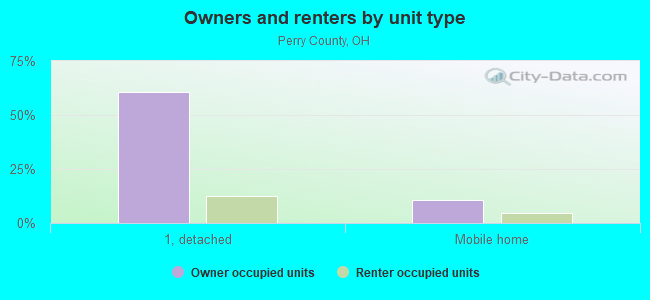
Housing units in structures:
- One, detached: 11,081
- One, attached: 84
- Two: 130
- 3 or 4: 251
- 5 to 9: 293
- 10 to 19: 37
- 20 to 49: 283
- 50 or more: 270
- Mobile homes: 2,574
- Boats, RVs, vans, etc.: 22
Housing units in Perry County with a mortgage: 5,571 (605 second mortgage, 20 home equity loan, 416 both second mortgage and home equity loan)
Houses without a mortgage: 89
| Here: | 5.3% with mortgage |
| State: | 95.2% with mortgage |
Religion statistics for Perry County
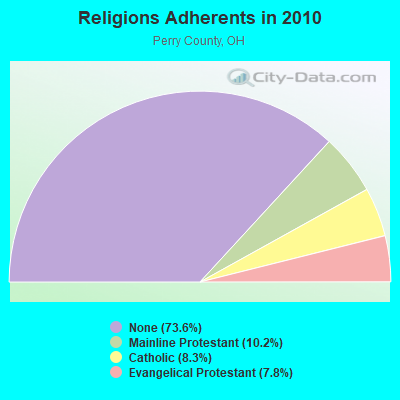
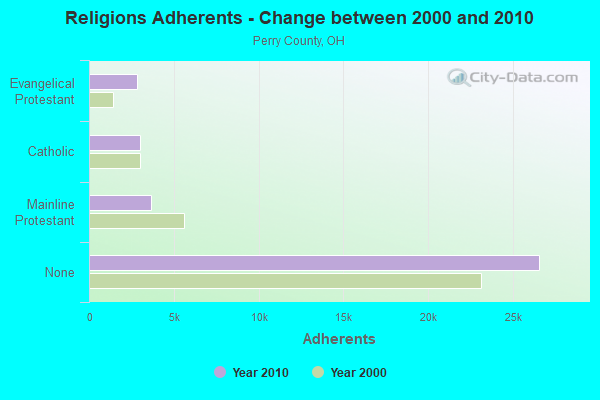
| Religion | Adherents | Congregations |
|---|---|---|
| Mainline Protestant | 3,675 | 31 |
| Catholic | 3,000 | 6 |
| Evangelical Protestant | 2,827 | 36 |
| Other | 1 | 2 |
| None | 26,555 | - |
Source: Clifford Grammich, Kirk Hadaway, Richard Houseal, Dale E.Jones, Alexei Krindatch, Richie Stanley and Richard H.Taylor. 2012. 2010 U.S.Religion Census: Religious Congregations & Membership Study. Association of Statisticians of American Religious Bodies. Jones, Dale E., et al. 2002. Congregations and Membership in the United States 2000. Nashville, TN: Glenmary Research Center.
Food Environment Statistics:
| Perry County: | 2.30 / 10,000 pop. |
| State: | 1.89 / 10,000 pop. |
| This county: | 0.86 / 10,000 pop. |
| Ohio: | 1.25 / 10,000 pop. |
| Perry County: | 3.45 / 10,000 pop. |
| Ohio: | 2.93 / 10,000 pop. |
| This county: | 3.45 / 10,000 pop. |
| State: | 6.25 / 10,000 pop. |
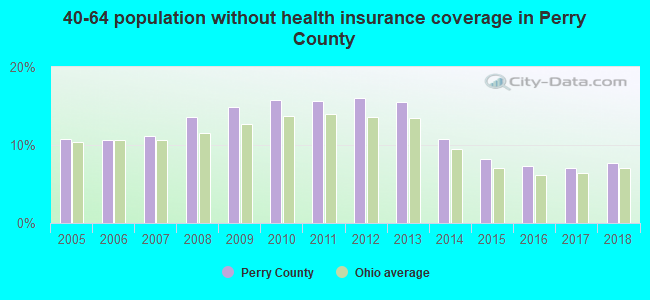
| Perry County: | 9.6% |
| Ohio: | 10.3% |
| Perry County: | 28.8% |
| State: | 29.1% |
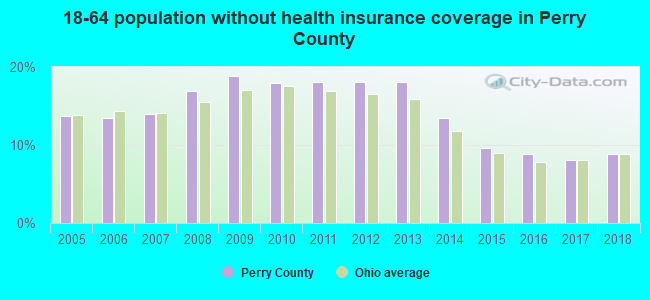
| Here: | 12.4% |
| State: | 11.9% |
Agriculture in Perry County:
Average size of farms: 144 acresAverage value of agricultural products sold per farm: $22,278
Average value of crops sold per acre for harvested cropland: $194.56
The value of nursery, greenhouse, floriculture, and sod as a percentage of the total market value of agricultural products sold: 7.45%
The value of livestock, poultry, and their products as a percentage of the total market value of agricultural products sold: 39.94%
Average total farm production expenses per farm: $22,923
Harvested cropland as a percentage of land in farms: 47.81%
Irrigated harvested cropland as a percentage of land in farms: 0.09%
Average market value of all machinery and equipment per farm: $36,488
The percentage of farms operated by a family or individual: 92.33%
Average age of principal farm operators: 54 years
Average number of cattle and calves per 100 acres of all land in farms: 12.57
Milk cows as a percentage of all cattle and calves: 9.76%
Corn for grain: 16027 harvested acres
All wheat for grain: 2099 harvested acres
Soybeans for beans: 12089 harvested acres
Vegetables: 197 harvested acres
Land in orchards: 5 acres
Earthquake activity:
Perry County-area historical earthquake activity is significantly above Ohio state average. It is 14% smaller than the overall U.S. average.On 7/27/1980 at 18:52:21, a magnitude 5.2 (5.1 MB, 4.7 MS, 5.0 UK, 5.2 UK, Class: Moderate, Intensity: VI - VII) earthquake occurred 140.7 miles away from Perry County center
On 8/23/2011 at 17:51:04, a magnitude 5.8 (5.8 MW, Depth: 3.7 mi) earthquake occurred 263.1 miles away from the county center
On 9/25/1998 at 19:52:52, a magnitude 5.2 (4.8 MB, 4.3 MS, 5.2 LG, 4.5 MW, Depth: 3.1 mi) earthquake occurred 154.6 miles away from the county center
On 1/31/1986 at 16:46:43, a magnitude 5.0 (5.0 MB) earthquake occurred 140.5 miles away from the county center
On 8/9/2020 at 12:07:37, a magnitude 5.1 (5.1 MW, Depth: 4.7 mi) earthquake occurred 233.7 miles away from Perry County center
On 9/7/1988 at 02:28:09, a magnitude 4.6 (4.5 MB, 4.6 LG, Class: Light, Intensity: IV - V) earthquake occurred 141.8 miles away from the county center
Magnitude types: regional Lg-wave magnitude (LG), body-wave magnitude (MB), surface-wave magnitude (MS), moment magnitude (MW)
Most recent natural disasters:
- Ohio Covid-19 Pandemic, Incident Period: January 20, 2020, FEMA Id: 4507, Natural disaster type: Other
- Ohio Severe Storms, Straight-line Winds, Tornadoes, Flooding, Landslides, And Mudslide, Incident Period: May 27, 2019 - May 29, 2019, FEMA Id: 4447, Natural disaster type: Storm, Tornado, Mudslide, Landslide, Flood, Wind
- Ohio Severe Storms, Flooding, And Landslides, Incident Period: February 5, 2019 - February 13, 2019, FEMA Id: 4424, Natural disaster type: Storm, Landslide, Flood
- Ohio Severe Storms, Landslides, And Mudslides, Incident Period: February 14, 2018 - February 25, 2018, FEMA Id: 4360, Natural disaster type: Storm, Mudslide, Landslide
- Ohio Severe Storms and Straight-line Winds, Incident Period: June 29, 2012 to July 02, 2012, Major Disaster (Presidential) Declared DR-4077: August 20, 2012, FEMA Id: 4077, Natural disaster type: Storm, Wind
- Ohio Severe Wind Storm associated with Tropical Depression Ike, Incident Period: September 14, 2008, Major Disaster (Presidential) Declared DR-1805: October 24, 2008, FEMA Id: 1805, Natural disaster type: Storm, Tropical Depression, Wind
- Ohio Hurricane Katrina Evacuation, Incident Period: August 29, 2005 to October 01, 2005, Emergency Declared EM-3250: September 13, 2005, FEMA Id: 3250, Natural disaster type: Hurricane
- Ohio Severe Winter Storms, Flooding and Mudslides, Incident Period: December 22, 2004 to February 01, 2005, Major Disaster (Presidential) Declared DR-1580: February 15, 2005, FEMA Id: 1580, Natural disaster type: Winter Storm, Mudslide, Flood
- Ohio Severe Storms and Flooding, Incident Period: August 27, 2004 to September 27, 2004, Major Disaster (Presidential) Declared DR-1556: September 19, 2004, FEMA Id: 1556, Natural disaster type: Storm, Flood
- Ohio Severe Storms and Flooding, Incident Period: May 18, 2004 to June 21, 2004, Major Disaster (Presidential) Declared DR-1519: June 03, 2004, FEMA Id: 1519, Natural disaster type: Storm, Flood
- 6 other natural disasters have been reported since 1953.
The number of natural disasters in Perry County (16) is near the US average (15).
Major Disasters (Presidential) Declared: 9
Emergencies Declared: 3
Causes of natural disasters: Storms: 10, Floods: 9, Landslides: 4, Mudslides: 4, Tornadoes: 3, Winds: 3, Snowstorms: 2, Blizzard: 1, Heavy Rain: 1, Hurricane: 1, Tropical Depression: 1, Winter Storm: 1, Other: 1 (Note: some incidents may be assigned to more than one category).
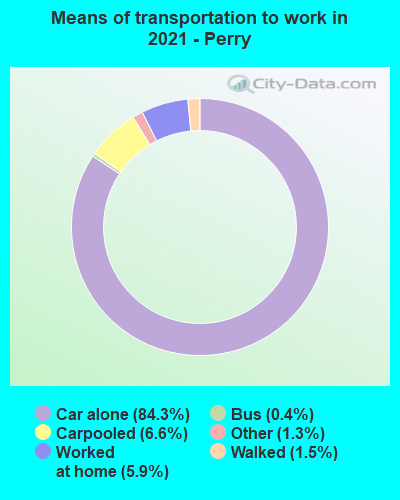
Means of transportation to work:
- Drove a car alone: 5,968 (78.2%)
- Carpooled: 489 (6.4%)
- Bus: 37 (0.5%)
- Taxicab, motorcycle, or other means: 34 (0.4%)
- Walked: 168 (2.2%)
- Worked at home: 895 (11.7%)

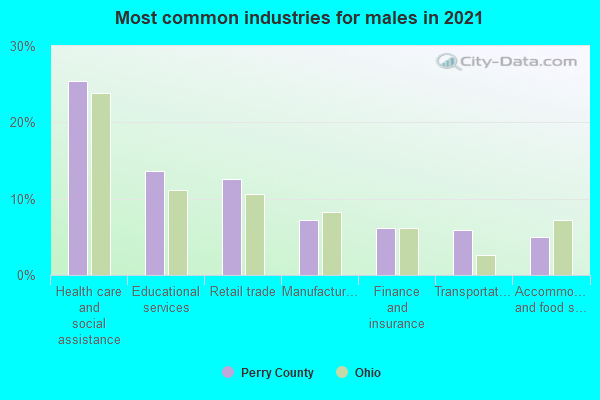
- Health care and social assistance (26%)
- Retail trade (12%)
- Educational services (12%)
- Transportation and warehousing (6%)
- Finance and insurance (6%)
- Manufacturing (6%)
- Accommodation and food services (4%)
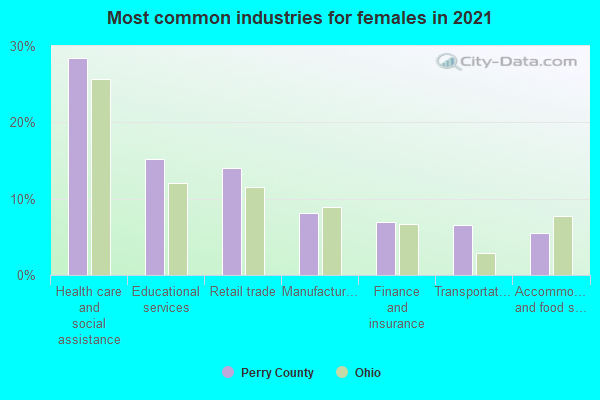
- Health care and social assistance (30%)
- Retail trade (14%)
- Educational services (14%)
- Transportation and warehousing (7%)
- Finance and insurance (7%)
- Manufacturing (7%)
- Accommodation and food services (5%)
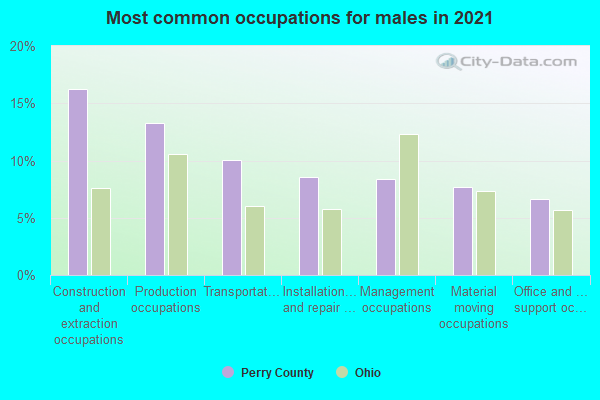
- Production occupations (15%)
- Construction and extraction occupations (15%)
- Transportation occupations (11%)
- Installation, maintenance, and repair occupations (9%)
- Management occupations (9%)
- Material moving occupations (8%)
- Office and administrative support occupations (5%)

- Office and administrative support occupations (19%)
- Sales and related occupations (9%)
- Management occupations (8%)
- Healthcare support occupations (8%)
- Health diagnosing and treating practitioners and other technical occupations (7%)
- Educational instruction, and library occupations (7%)
- Material moving occupations (7%)
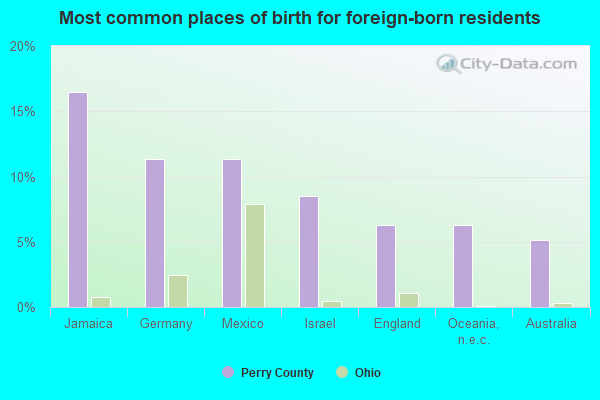
- Jamaica (32%)
- Mexico (19%)
- Canada (18%)
- Germany (15%)
- Australia (7%)
- Israel (6%)
- Italy (4%)

- German (24%)
- English (17%)
- American (14%)
- Irish (9%)
- European (3%)
- Hungarian (1%)
- French (except Basque) (1%)
People in group quarters in Perry County, Ohio in 2010:
- 224 people in nursing facilities/skilled-nursing facilities
- 80 people in group homes intended for adults
- 3 people in residential treatment centers for adults
People in group quarters in Perry County, Ohio in 2000:
- 185 people in nursing homes
- 78 people in other nonhousehold living situations
- 22 people in other noninstitutional group quarters
- 8 people in homes or halfway houses for drug/alcohol abuse
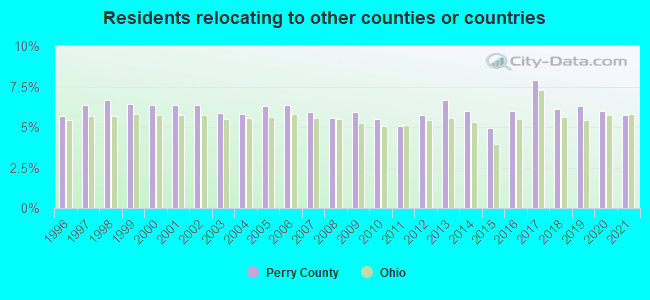
6.26% of this county's 2021 resident taxpayers lived in other counties in 2020 ($49,000 average adjusted gross income)
| Here: | 6.26% |
| Ohio average: | 5.68% |
10 or fewer of this county's residents moved from foreign countries.
5.57% relocated from other counties in Ohio ($44,418 average AGI)
0.69% relocated from other states ($4,583 average AGI)
Perry County: 0.69% Ohio average: 1.92%

Top counties from which taxpayers relocated into this county between 2020 and 2021:
| from Fairfield County, OH | |
| from Muskingum County, OH | |
| from Licking County, OH | |
| from Franklin County, OH | |
| from Hocking County, OH | |
| from Athens County, OH |
5.76% of this county's 2020 resident taxpayers moved to other counties in 2021 ($41,566 average adjusted gross income)
| Here: | 5.76% |
| Ohio average: | 5.79% |
10 or fewer of this county's residents moved to foreign countries.
5.22% relocated to other counties in Ohio ($37,261 average AGI)
0.54% relocated to other states ($4,305 average AGI)
Perry County: 0.54% Ohio average: 2.05%
Top counties to which taxpayers relocated from this county between 2020 and 2021:
| to Fairfield County, OH | |
| to Muskingum County, OH | |
| to Licking County, OH | |
| to Franklin County, OH | |
| to Athens County, OH | |
| to Morgan County, OH | |
| to Hocking County, OH |
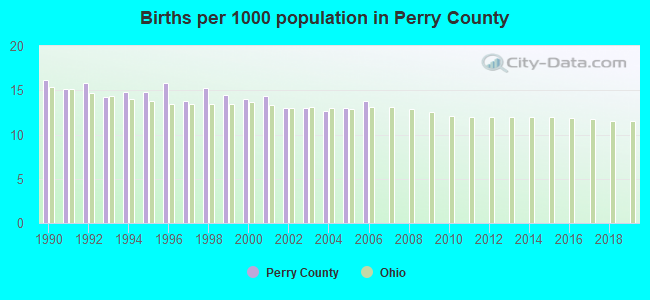
Births per 1000 population from 1990 to 1999: 15.0
Births per 1000 population from 2000 to 2006: 13.4
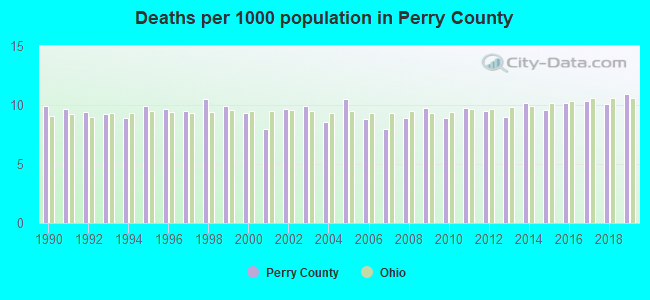
Deaths per 1000 population from 1990 to 1999: 9.7
Deaths per 1000 population from 2000 to 2009: 9.1
Deaths per 1000 population from 2010 to 2020: 10.1
Infant deaths per 1000 live births from 1990 to 1999: 7.7
Infant deaths per 1000 live births from 2000 to 2006: 7.6

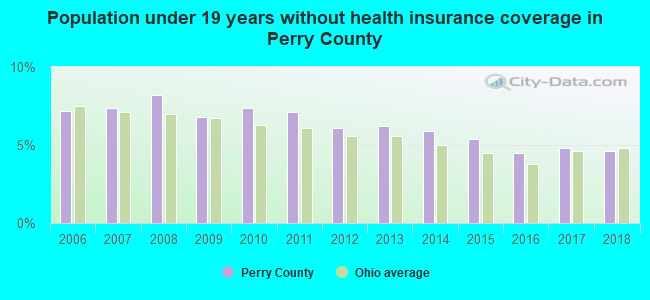
Persons under 19 years old without health insurance coverage in 2018: 4.6%

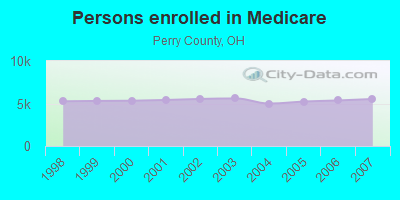
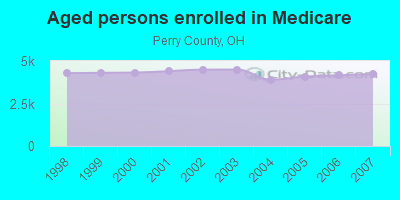
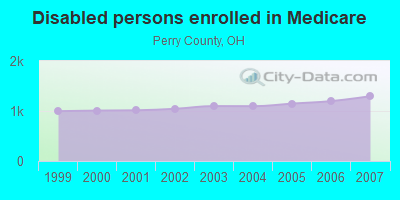
Persons enrolled in hospital insurance and/or supplemental medical insurance (Medicare) in July 1, 2007: 5,529 (4,233 aged, 1,296 disabled)
Children under 18 without health insurance coverage in 2007: 638 (7%)
Most common underlying causes of death in Perry County, Ohio in 1999 - 2019:
- Atherosclerotic heart disease (658)
- Acute myocardial infarction, unspecified (572)
- Bronchus or lung, unspecified - Malignant neoplasms (563)
- Chronic obstructive pulmonary disease, unspecified (339)
- Unspecified dementia (163)
- Stroke, not specified as haemorrhage or infarction (90)
- Alzheimer disease, unspecified (58)
- Hyperlipidaemia, unspecified (39)
- Pneumonia, unspecified (37)
- Colon, unspecified - Malignant neoplasms (36)
Population without health insurance coverage in 2000: 11%
Children under 18 without health insurance coverage in 2000: 9%
Medical specialist MDs per 100,000 population in 2005: 976
Dentists per 100,000 population in 1998: 23
Total births per 100,000 population, July 2005 - July 2006 : 12
Total deaths per 100,000 population, July 2005 - July 2006: 51
Limited-service eating places per 100,000 population in 2005 : 3
Suicides per 1,000,000 population from 2000 to 2006: 128.2. This is more than state average.
Household type by relationship:
Households: 35,394- Male householders: 6,529 (1,439 living alone), Female householders: 7,090 (1,639 living alone)
7,034 spouses (6,942 opposite-sex spouses), 1,288 unmarried partners, (1,234 opposite-sex unmarried partners), 9,968 children (9,082 natural, 141 adopted, 727 stepchildren), 1,357 grandchildren, 361 brothers or sisters, 258 parents, 28 foster children, 362 other relatives, 776 non-relatives
- In group quarters: 316
Size of family households: 4,755 2-persons, 1,907 3-persons, 1,460 4-persons, 760 5-persons, 727 6-persons, 90 7-or-more-persons.
Size of nonfamily households: 3,078 1-person, 642 2-persons, 117 3-persons, 41 4-persons, 16 5-persons.
5,099 married couples with children.
1,870 single-parent households (819 men, 1,051 women).
97.0% of residents of Perry speak English at home.
1.8% of residents speak Spanish at home (89% speak English very well, 7% speak English well, 4% speak English not well).
0.8% of residents speak other Indo-European language at home (77% speak English very well, 19% speak English well, 4% speak English not well).
0.1% of residents speak Asian or Pacific Island language at home (100% speak English very well).
In fiscal year 2004:
Federal Government expenditure: $174,089,000 ($4,968 per capita)
Department of Defense expenditure: $2,438,000
Federal direct payments to individuals for retirement and disability: $81,341,000
Federal other direct payments to individuals: $40,773,000
Federal direct payments not to individuals: $2,108,000
Federal grants: $43,072,000
Federal procurement contracts: $2,094,000 ($38,000 Department of Defense)
Federal salaries and wages: $4,701,000 ($0,000 Department of Defense)
Federal Government direct loans: $541,000
Federal guaranteed/insured loans: $6,661,000
Federal Government insurance: $13,863,000
Population change from April 1, 2000 to July 1, 2005:
Births: 2,401| Here: | 68 per 1000 residents |
| State: | 69 per 1000 residents |
Deaths: 1,763
| Here: | 50 per 1000 residents |
| State: | 50 per 1000 residents |
Net international migration: +45
| Here: | +1 per 1000 residents |
| State: | +7 per 1000 residents |
Net internal migration: +536
| Here: | |
| State: |
Total withdrawal of fresh water for public supply: 1.41 millions of gallons per day (11% from ground, 89% from surface)
| Here: | 6.2 |
| State: | 6.7 |
| Here: | 4.7 |
| State: | 4.4 |
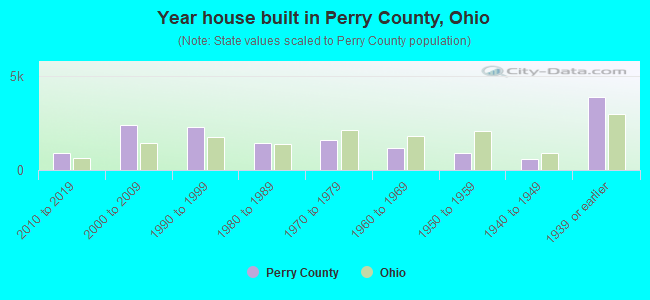
- Year house built in Perry County, Ohio
- 362020 or later
- 8602010 to 2019
- 2,5382000 to 2009
- 2,5341990 to 1999
- 1,3581980 to 1989
- 1,4191970 to 1979
- 1,1111960 to 1969
- 9311950 to 1959
- 6231940 to 1949
- 3,6011939 or earlier
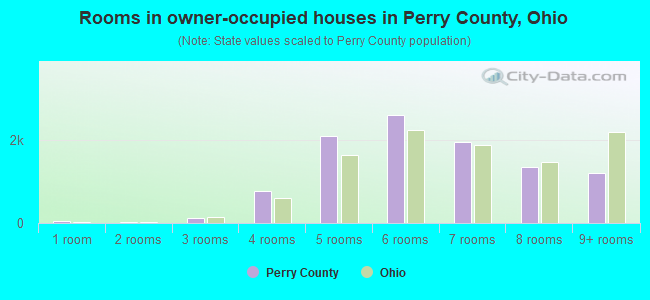
- Rooms in owner-occupied houses in Perry County, Ohio
- 631 room
- 202 rooms
- 1613 rooms
- 8094 rooms
- 2,3375 rooms
- 2,7076 rooms
- 1,7377 rooms
- 1,2658 rooms
- 1,2789+ rooms
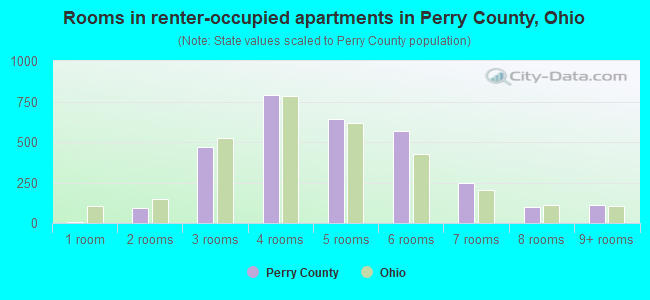
- Rooms in renter-occupied apartments in Perry County, Ohio
- 351 room
- 2252 rooms
- 4623 rooms
- 8184 rooms
- 5795 rooms
- 6766 rooms
- 2237 rooms
- 1588 rooms
- 749+ rooms
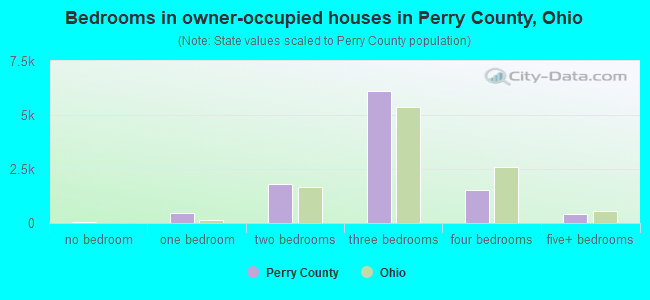
- Bedrooms in owner-occupied houses in Perry County, Ohio
- 66no bedroom
- 2711 bedroom
- 2,1252 bedrooms
- 6,1483 bedrooms
- 1,4084 bedrooms
- 3725+ bedrooms
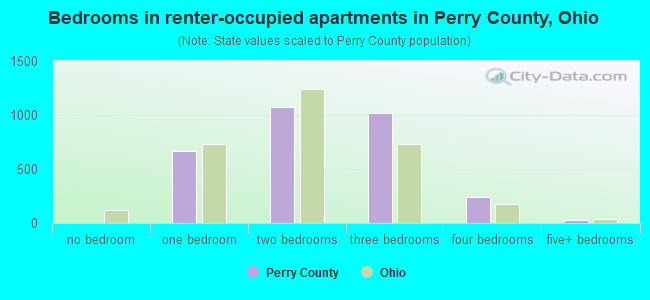
- Bedrooms in renter-occupied apartments in Perry County, Ohio
- 36no bedroom
- 7291 bedroom
- 1,2012 bedrooms
- 9373 bedrooms
- 3144 bedrooms
- 275+ bedrooms
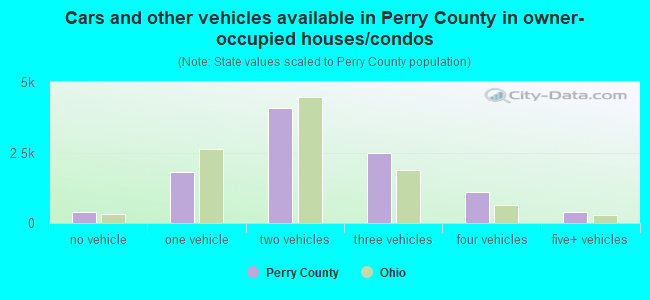
- Cars and other vehicles available in Perry County in owner-occupied houses/condos
- 437no vehicle
- 1,9111 vehicle
- 4,0322 vehicles
- 2,3543 vehicles
- 1,1114 vehicles
- 4855+ vehicles
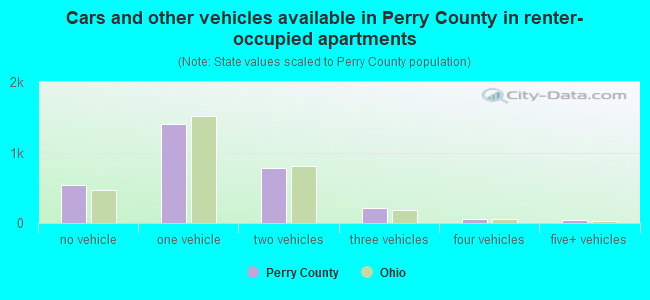
- Cars and other vehicles available in Perry County in renter-occupied apartments
- 536no vehicle
- 1,4421 vehicle
- 8912 vehicles
- 2863 vehicles
- 454 vehicles
- 405+ vehicles
92.7% of Perry County residents lived in the same house 1 years ago.
Out of people who lived in different houses, 33% lived in this county.
Out of people who lived in different counties, 90% lived in Ohio.
| Perry County: | 92.7% |
| State average: | 87.8% |
Place of birth for U.S.-born residents:
- This state: 31,528
- Other state: 3,451
- Northeast: 493
- Midwest: 659
- South: 1,825
- West: 461
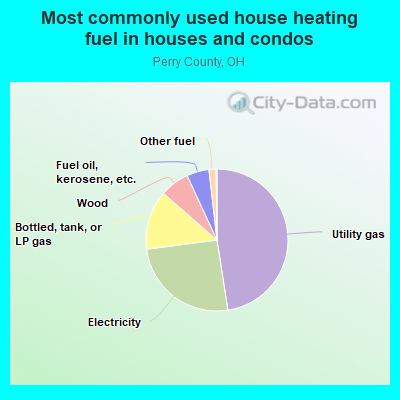
- 48.0%Utility gas
- 25.6%Electricity
- 14.4%Bottled, tank, or LP gas
- 5.3%Fuel oil, kerosene, etc.
- 5.2%Wood
- 1.3%Other fuel
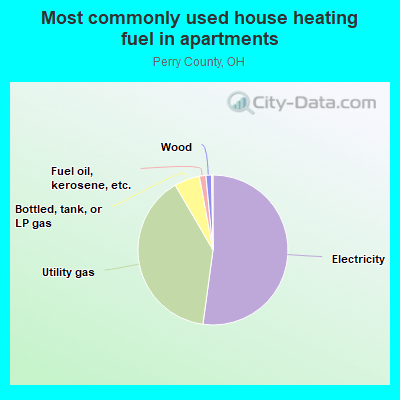
- 57.2%Electricity
- 35.7%Utility gas
- 5.0%Bottled, tank, or LP gas
- 1.4%Fuel oil, kerosene, etc.
- 0.6%Wood
- 0.1%No fuel used
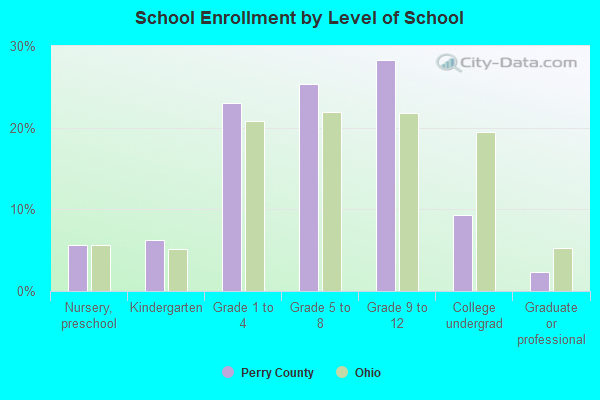
Private vs. public school enrollment:
| Here: | 17.8% |
| Ohio: | 16.0% |
| Here: | 5.6% |
| Ohio: | 13.1% |
| Here: | 18.0% |
| Ohio: | 22.3% |


Perry County government finances - Expenditure in 2018:
- Charges - Other: $2,428,000
Sewerage: $754,000
- Current Operations - Public Welfare - Other: $7,972,000
Health - Other: $6,596,000
Regular Highways: $4,641,000
Financial Administration: $3,547,000
Police Protection: $3,041,000
Judicial and Legal Services: $1,855,000
Parks and Recreation: $343,000
Sewerage: $328,000
Water Utilities: $189,000
General - Other: $101,000
- General - Interest on Debt: $445,000
- Long Term Debt - Beginning Outstanding - Unspecified Public Purpose: $14,210,000
Outstanding Unspecified Public Purpose: $13,410,000
Retired Unspecified Public Purpose: $800,000
- Miscellaneous - General Revenue - Other: $658,000
Interest Earnings: $139,000
Fines and Forfeits: $8,000
- Other Capital Outlay - General - Other: $627,000
Water Utilities: $275,000
Sewerage: $72,000
- Other Funds - Cash and Securities: $16,318,000
- Revenue - Water Utilities: $828,000
- State Intergovernmental - Public Welfare: $4,666,000
Highways: $4,122,000
Health and Hospitals: $2,651,000
Other: $1,301,000
General Local Government Support: $137,000
Water Utilities: $95,000
- Tax - Property: $6,450,000
General Sales and Gross Receipts: $4,194,000
Other License: $2,000
- Water Utilities - Interest on Debt: $120,000
Perry County government finances - Revenue in 2018:
- Charges - Other: $2,428,000
Sewerage: $754,000
- Current Operations - Public Welfare - Other: $7,972,000
Health - Other: $6,596,000
Regular Highways: $4,641,000
Financial Administration: $3,547,000
Police Protection: $3,041,000
Judicial and Legal Services: $1,855,000
Parks and Recreation: $343,000
Sewerage: $328,000
Water Utilities: $189,000
General - Other: $101,000
- General - Interest on Debt: $445,000
- Long Term Debt - Beginning Outstanding - Unspecified Public Purpose: $14,210,000
Outstanding Unspecified Public Purpose: $13,410,000
Retired Unspecified Public Purpose: $800,000
- Miscellaneous - General Revenue - Other: $658,000
Interest Earnings: $139,000
Fines and Forfeits: $8,000
- Other Capital Outlay - General - Other: $627,000
Water Utilities: $275,000
Sewerage: $72,000
- Other Funds - Cash and Securities: $16,318,000
- Revenue - Water Utilities: $828,000
- State Intergovernmental - Public Welfare: $4,666,000
Highways: $4,122,000
Health and Hospitals: $2,651,000
Other: $1,301,000
General Local Government Support: $137,000
Water Utilities: $95,000
- Tax - Property: $6,450,000
General Sales and Gross Receipts: $4,194,000
Other License: $2,000
- Water Utilities - Interest on Debt: $120,000
Perry County government finances - Debt in 2018:
- Charges - Other: $2,428,000
Sewerage: $754,000
- Current Operations - Public Welfare - Other: $7,972,000
Health - Other: $6,596,000
Regular Highways: $4,641,000
Financial Administration: $3,547,000
Police Protection: $3,041,000
Judicial and Legal Services: $1,855,000
Parks and Recreation: $343,000
Sewerage: $328,000
Water Utilities: $189,000
General - Other: $101,000
- General - Interest on Debt: $445,000
- Long Term Debt - Beginning Outstanding - Unspecified Public Purpose: $14,210,000
Outstanding Unspecified Public Purpose: $13,410,000
Retired Unspecified Public Purpose: $800,000
- Miscellaneous - General Revenue - Other: $658,000
Interest Earnings: $139,000
Fines and Forfeits: $8,000
- Other Capital Outlay - General - Other: $627,000
Water Utilities: $275,000
Sewerage: $72,000
- Other Funds - Cash and Securities: $16,318,000
- Revenue - Water Utilities: $828,000
- State Intergovernmental - Public Welfare: $4,666,000
Highways: $4,122,000
Health and Hospitals: $2,651,000
Other: $1,301,000
General Local Government Support: $137,000
Water Utilities: $95,000
- Tax - Property: $6,450,000
General Sales and Gross Receipts: $4,194,000
Other License: $2,000
- Water Utilities - Interest on Debt: $120,000
Perry County government finances - Cash and Securities in 2018:
- Charges - Other: $2,428,000
Sewerage: $754,000
- Current Operations - Public Welfare - Other: $7,972,000
Health - Other: $6,596,000
Regular Highways: $4,641,000
Financial Administration: $3,547,000
Police Protection: $3,041,000
Judicial and Legal Services: $1,855,000
Parks and Recreation: $343,000
Sewerage: $328,000
Water Utilities: $189,000
General - Other: $101,000
- General - Interest on Debt: $445,000
- Long Term Debt - Beginning Outstanding - Unspecified Public Purpose: $14,210,000
Outstanding Unspecified Public Purpose: $13,410,000
Retired Unspecified Public Purpose: $800,000
- Miscellaneous - General Revenue - Other: $658,000
Interest Earnings: $139,000
Fines and Forfeits: $8,000
- Other Capital Outlay - General - Other: $627,000
Water Utilities: $275,000
Sewerage: $72,000
- Other Funds - Cash and Securities: $16,318,000
- Revenue - Water Utilities: $828,000
- State Intergovernmental - Public Welfare: $4,666,000
Highways: $4,122,000
Health and Hospitals: $2,651,000
Other: $1,301,000
General Local Government Support: $137,000
Water Utilities: $95,000
- Tax - Property: $6,450,000
General Sales and Gross Receipts: $4,194,000
Other License: $2,000
- Water Utilities - Interest on Debt: $120,000
Supplemental Security Income (SSI) in 2006:
- Total number of recipients: 1,019
- Number of aged recipients: 37
- Number of blind and disabled recipients: 982
- Number of recipients under 18: 138
- Number of recipients between 18 and 64: 751
- Number of recipients older than 64: 130
- Number of recipients also receiving OASDI: 320
- Amount of payments (thousands of dollars): 553
| Most common first names in Perry County, OH among deceased individuals | ||
| Name | Count | Lived (average) |
|---|---|---|
| John | 335 | 75.0 years |
| Mary | 313 | 79.6 years |
| William | 290 | 74.2 years |
| Charles | 255 | 74.5 years |
| James | 222 | 72.5 years |
| Robert | 222 | 69.7 years |
| George | 133 | 77.5 years |
| Helen | 111 | 77.7 years |
| Paul | 107 | 70.7 years |
| Dorothy | 104 | 78.3 years |
| Most common last names in Perry County, OH among deceased individuals | ||
| Last name | Count | Lived (average) |
|---|---|---|
| Smith | 118 | 75.9 years |
| Wilson | 87 | 77.6 years |
| Miller | 83 | 73.3 years |
| Brown | 68 | 74.2 years |
| Williams | 63 | 75.9 years |
| Moore | 62 | 74.7 years |
| Thompson | 56 | 74.9 years |
| Davis | 55 | 73.8 years |
| Allen | 54 | 75.6 years |
| King | 52 | 75.5 years |
| Businesses in Perry County, OH | ||||
| Name | Count | Name | Count | |
|---|---|---|---|---|
| Advance Auto Parts | 1 | Kroger | 1 | |
| CVS | 1 | Lane Furniture | 1 | |
| Circle K | 2 | MasterBrand Cabinets | 2 | |
| Curves | 1 | McDonald's | 1 | |
| Dairy Queen | 1 | Pizza Hut | 1 | |
| Domino's Pizza | 2 | Taco Bell | 1 | |
| Ford | 1 | True Value | 1 | |
| Goodwill | 1 | U-Haul | 2 | |
| H&R Block | 1 | Wendy's | 1 | |