Patrick County, Virginia (VA)
County owner-occupied free and clear houses and condos in 2010: 3,319
County owner-occupied houses and condos in 2000: 6,531
Renter-occupied apartments: 1,811 (it was 1,610 in 2000)
| % of renters here: | 20% |
| State: | 33% |
Land area: 483 sq. mi.
Water area: 2.7 sq. mi.
Population density: 37 people per square mile (low).
Industries providing employment: Educational, health and social services (24.3%), Manufacturing (22.3%), Retail trade (10.0%).
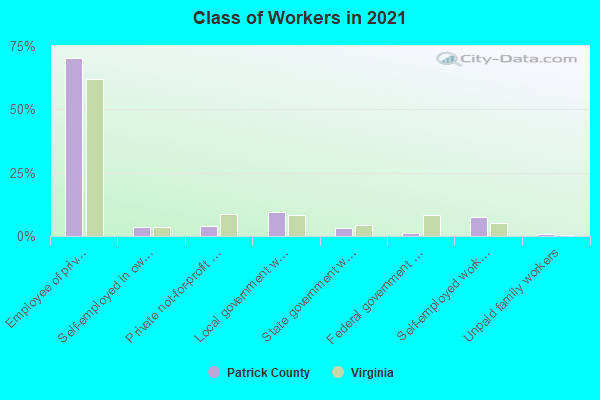
Type of workers:
- Private wage or salary: 79%
- Government: 13%
- Self-employed, not incorporated: 8%
- Unpaid family work: 1%
- OSM Map
- General Map
- Google Map
- MSN Map

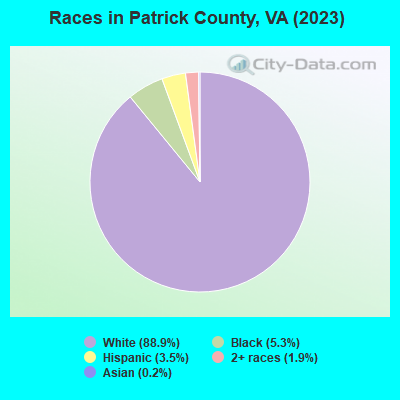
- 15,57289.1%White Non-Hispanic Alone
- 9885.7%Black Non-Hispanic Alone
- 6043.5%Hispanic or Latino
- 2101.2%Two or more races
- 840.5%Asian alone
- 140.08%Some other race alone
- 120.07%American Indian and Alaska Native alone
| Median resident age: | 51.3 years |
| Virginia median age: | 39.0 years |
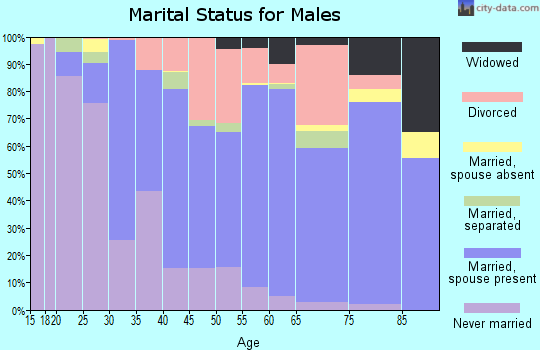
| Males: 8,993 | |
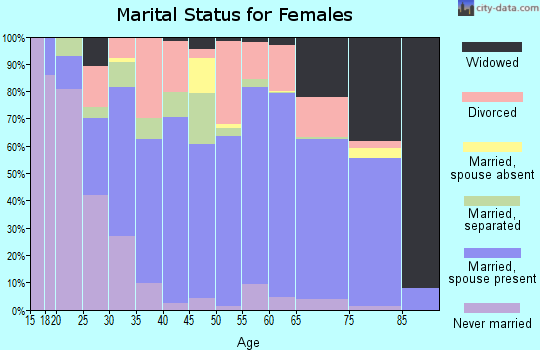
| Females: 8,788 |

 | Patrick County hospital closing, Martinsville/Danville hospital layoffs (5 replies) |
| South Boston~Halifax info (2 replies) |
| Visiting Floyd & Area in May - Recommendations? (6 replies) |
| Census Releases New CDPs for Virginia, 2020-2030 (5 replies) |
| Rental Property in Patrick County, Stuart, VA (0 replies) |
| Floyd, VA (48 replies) |
| Patrick County: | 2.0 people |
| Virginia: | 3 people |
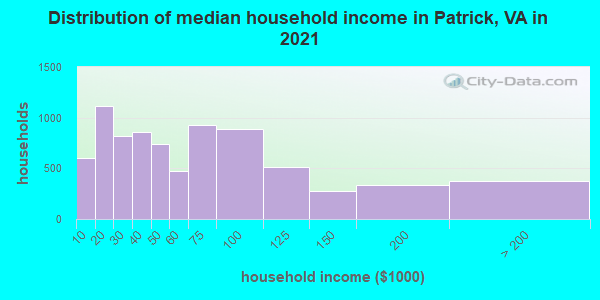
Estimated median household income in 2022: $48,404 ($28,705 in 1999)
| This county: | $48,404 |
| Virginia: | $85,873 |
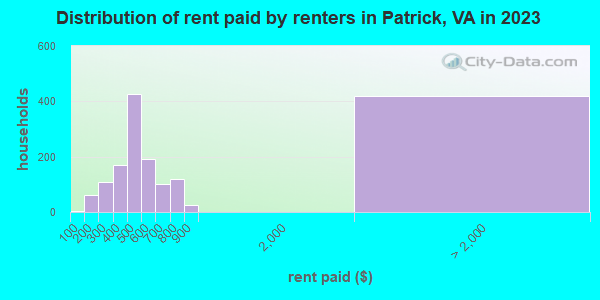
Median contract rent in 2022 for apartments: $463 (lower quartile is $353, upper quartile is $545)
| This county: | $463 |
| State: | $1270 |
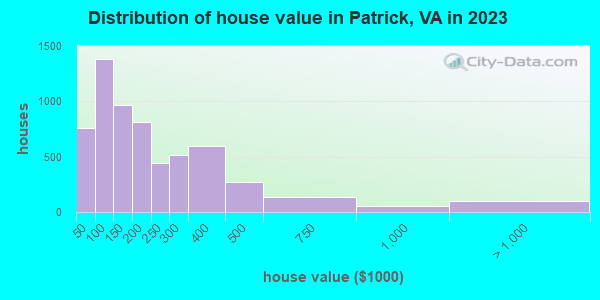
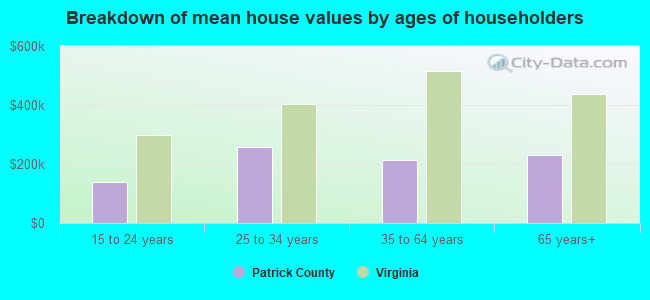
Estimated median house or condo value in 2022: $147,658 (it was $70,500 in 2000)
| Patrick: | $147,658 |
| Virginia: | $365,700 |
Mean price in 2022:
Median monthly housing costs for homes and condos with a mortgage: $1,077Detached houses: $221,919
Here: $221,919 State: $472,865 Townhouses or other attached units: $186,313
Here: $186,313 State: $457,437 Mobile homes: $127,244
Here: $127,244 State: $100,736
Median monthly housing costs for units without a mortgage: $288
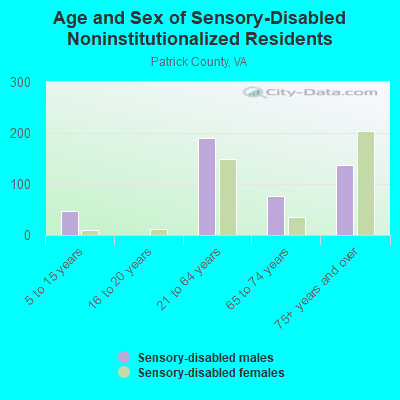
Institutionalized population: 191
Crime in 2021 (reported by the sheriff's office or county police, not the county total):
- Murders: 0
- Rapes: 10
- Robberies: 1
- Assaults: 33
- Burglaries: 46
- Thefts: 154
- Auto thefts: 18
Crime in 2020 (reported by the sheriff's office or county police, not the county total):
- Murders: 1
- Rapes: 8
- Robberies: 4
- Assaults: 30
- Burglaries: 50
- Thefts: 186
- Auto thefts: 16
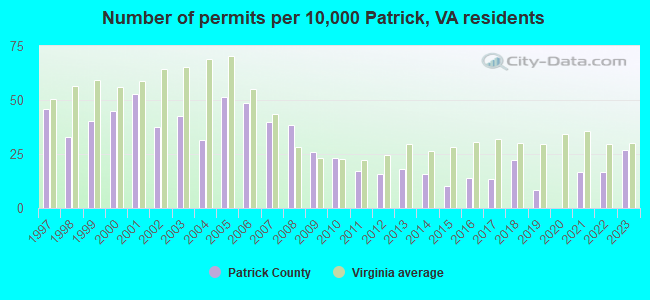
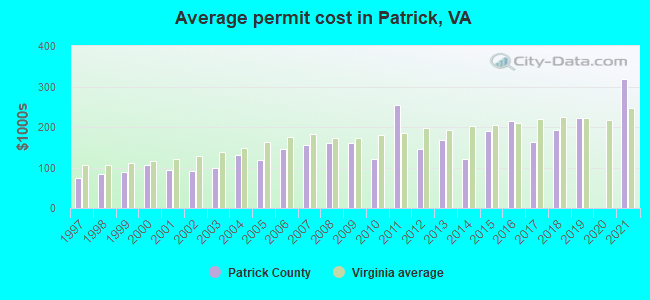
Single-family new house construction building permits:
- 2022: 32 buildings, average cost: $243,500
- 2021: 32 buildings, average cost: $318,400
- 2020: 0 buildings
- 2019: 16 buildings, average cost: $221,600
- 2018: 43 buildings, average cost: $193,300
- 2017: 26 buildings, average cost: $162,700
- 2016: 27 buildings, average cost: $215,900
- 2015: 20 buildings, average cost: $191,300
- 2014: 31 buildings, average cost: $121,600
- 2013: 35 buildings, average cost: $167,800
- 2012: 31 buildings, average cost: $145,200
- 2011: 33 buildings, average cost: $253,900
- 2010: 45 buildings, average cost: $121,300
- 2009: 50 buildings, average cost: $159,500
- 2008: 75 buildings, average cost: $159,500
- 2007: 77 buildings, average cost: $154,700
- 2006: 94 buildings, average cost: $145,400
- 2005: 100 buildings, average cost: $119,000
- 2004: 61 buildings, average cost: $129,700
- 2003: 83 buildings, average cost: $98,400
- 2002: 73 buildings, average cost: $91,700
- 2001: 102 buildings, average cost: $93,600
- 2000: 87 buildings, average cost: $105,600
- 1999: 78 buildings, average cost: $89,800
- 1998: 64 buildings, average cost: $82,800
- 1997: 89 buildings, average cost: $75,000
Median real estate property taxes paid for housing units with mortgages in 2022: $923 (0.5%)
Median real estate property taxes paid for housing units with no mortgage in 2022: $750 (0.6%)
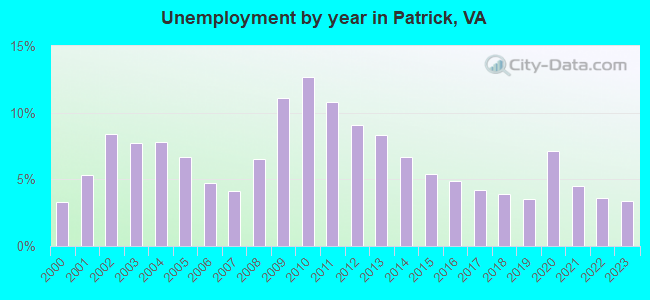
| Patrick County: | 12.1% |
| Virginia: | 10.6% |
Median age of residents in 2022: 51.3 years old
(Males: 49.8 years old, Females: 53.7 years old)
(Median age for: White residents: 52.2 years old, Black residents: 48.2 years old, American Indian residents: 84.9 years old, Asian residents: 52.4 years old, Hispanic or Latino residents: 39.3 years old, Other race residents: 21.0 years old)
Fair market rent in 2006 for a 1-bedroom apartment in Patrick County is $436 a month.
Fair market rent for a 2-bedroom apartment is $483 a month.
Fair market rent for a 3-bedroom apartment is $598 a month.
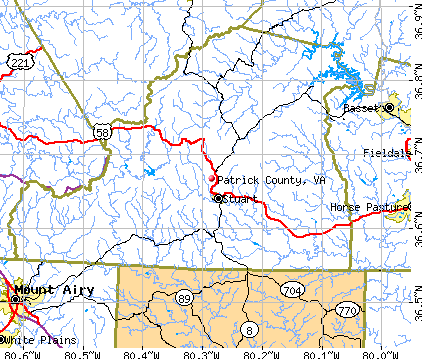
Cities in this county include: Patrick Springs, Stuart.
Neighboring counties: Fentress County, Tennessee  , Dinwiddie County
  , Major County, Oklahoma , Macon County, Tennessee , Montgomery County
  , Sumner County, Tennessee , Union County, Tennessee , Wythe County
  .
.
| Here: | 3.4% |
| Virginia: | 2.7% |
Current college students: 543
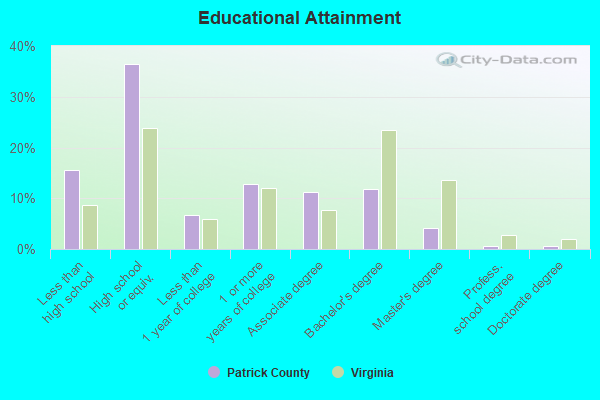
People 25 years of age or older with a high school degree or higher: 83.6%
People 25 years of age or older with a bachelor's degree or higher: 16.3%
Number of foreign born residents: 307 (73.3% naturalized citizens)
| Patrick County: | 1.7% |
| Whole state: | 12.7% |
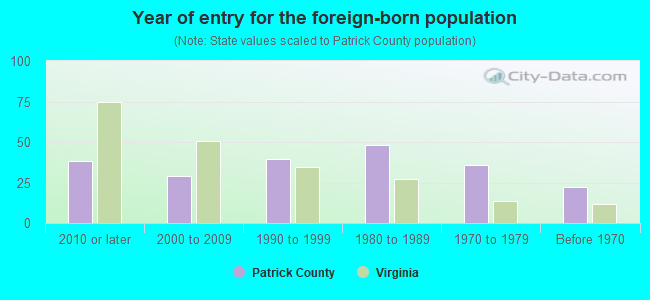
- Year of entry for the foreign-born population
- 222010 or later
- 192000 to 2009
- 321990 to 1999
- 481980 to 1989
- 361970 to 1979
- 22Before 1970
Mean travel time to work (commute): minutes
Percentage of county residents living and working in this county: 84.6%
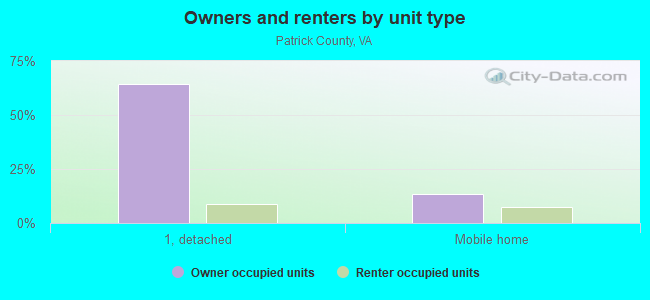
Housing units in structures:
- One, detached: 7,180
- One, attached: 93
- Two: 80
- 3 or 4: 51
- 5 to 9: 170
- 10 to 19: 36
- 20 to 49: 45
- 50 or more: 4
- Mobile homes: 2,336
- Boats, RVs, vans, etc.: 89
Housing units in Patrick County with a mortgage: 2,719 (145 second mortgage, 0 home equity loan, 125 both second mortgage and home equity loan)
Houses without a mortgage: 68
| Here: | 2.9% with mortgage |
| State: | 97.2% with mortgage |
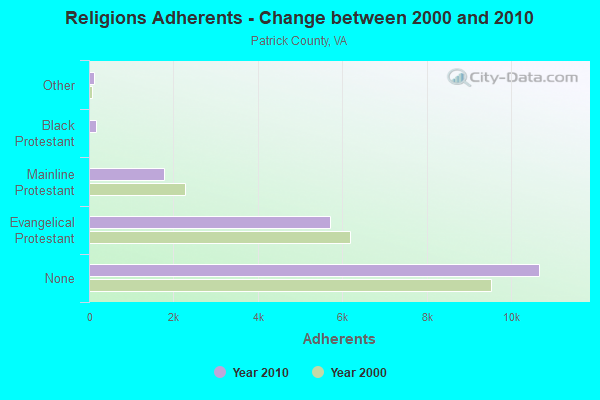
Religion statistics for Patrick County

| Religion | Adherents | Congregations |
|---|---|---|
| Evangelical Protestant | 5,704 | 43 |
| Mainline Protestant | 1,780 | 24 |
| Black Protestant | 176 | 1 |
| Other | 115 | 1 |
| Catholic | 47 | 1 |
| None | 10,668 | - |
Source: Clifford Grammich, Kirk Hadaway, Richard Houseal, Dale E.Jones, Alexei Krindatch, Richie Stanley and Richard H.Taylor. 2012. 2010 U.S.Religion Census: Religious Congregations & Membership Study. Association of Statisticians of American Religious Bodies. Jones, Dale E., et al. 2002. Congregations and Membership in the United States 2000. Nashville, TN: Glenmary Research Center.
Food Environment Statistics:
| Patrick County: | 1.59 / 10,000 pop. |
| State: | 2.03 / 10,000 pop. |
| This county: | 0.53 / 10,000 pop. |
| Virginia: | 1.43 / 10,000 pop. |
| Patrick County: | 6.37 / 10,000 pop. |
| Virginia: | 4.03 / 10,000 pop. |
| This county: | 5.31 / 10,000 pop. |
| State: | 7.65 / 10,000 pop. |
| Patrick County: | 10.4% |
| Virginia: | 9.3% |
| Patrick County: | 27.2% |
| State: | 26.7% |
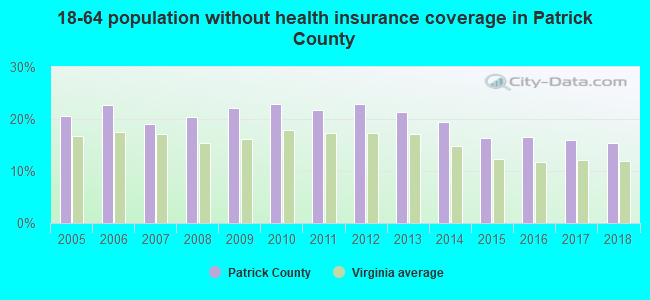
| Here: | 22.2% |
| State: | 18.6% |
Agriculture in Patrick County:
Average size of farms: 144 acresAverage value of agricultural products sold per farm: $24,209
Average value of crops sold per acre for harvested cropland: $335.84
The value of nursery, greenhouse, floriculture, and sod as a percentage of the total market value of agricultural products sold: 16.55%
The value of livestock, poultry, and their products as a percentage of the total market value of agricultural products sold: 55.70%
Average total farm production expenses per farm: $27,334
Harvested cropland as a percentage of land in farms: 22.18%
Irrigated harvested cropland as a percentage of land in farms: 1.53%
Average market value of all machinery and equipment per farm: $37,735
The percentage of farms operated by a family or individual: 91.89%
Average age of principal farm operators: 56 years
Average number of cattle and calves per 100 acres of all land in farms: 19.39
Milk cows as a percentage of all cattle and calves: 4.59%
Corn for grain: 634 harvested acres
Soybeans for beans: 36 harvested acres
Vegetables: 169 harvested acres
Land in orchards: 909 acres
Earthquake activity:
Patrick County-area historical earthquake activity is significantly above Virginia state average. It is 24% smaller than the overall U.S. average.On 8/23/2011 at 17:51:04, a magnitude 5.8 (5.8 MW, Depth: 3.7 mi, Class: Moderate, Intensity: VI - VII) earthquake occurred 155.3 miles away from Patrick County center
On 8/9/2020 at 12:07:37, a magnitude 5.1 (5.1 MW, Depth: 4.7 mi) earthquake occurred 46.8 miles away from the county center
On 7/27/1980 at 18:52:21, a magnitude 5.2 (5.1 MB, 4.7 MS, 5.0 UK, 5.2 UK) earthquake occurred 227.3 miles away from the county center
On 11/2/2006 at 17:53:02, a magnitude 4.3 (4.3 MB, Depth: 0.6 mi, Class: Light, Intensity: IV - V) earthquake occurred 97.6 miles away from the county center
On 11/23/2006 at 10:42:57, a magnitude 4.3 (4.3 MB) earthquake occurred 99.4 miles away from Patrick County center
On 12/9/2003 at 20:59:18, a magnitude 4.5 (4.5 ML, Depth: 6.2 mi) earthquake occurred 142.7 miles away from the county center
Magnitude types: body-wave magnitude (MB), local magnitude (ML), surface-wave magnitude (MS), moment magnitude (MW)
Most recent natural disasters:
- Virginia Covid-19 Pandemic, Incident Period: January 20, 2020, Major Disaster (Presidential) Declared DR-4512-VA: April 2, 2020, FEMA Id: 4512, Natural disaster type: Other
- Virginia Hurricane Florence, Incident Period: September 8, 2018 - September 21, 2018, FEMA Id: 4401, Natural disaster type: Hurricane
- Virginia Severe Winter Storm And Snowstorm, Incident Period: January 22, 2016 to January 23, 2016, Major Disaster (Presidential) Declared DR-4262: March 07, 2016, FEMA Id: 4262, Natural disaster type: Snowstorm, Winter Storm
- Virginia Hurricane Sandy, Incident Period: October 26, 2012 to November 01, 2012, Emergency Declared EM-3359: October 29, 2012, FEMA Id: 3359, Natural disaster type: Hurricane
- Virginia Bull Mountain Fire, Incident Period: April 15, 2006, Fire Management Assistance Declared: April 15, 2006, FEMA Id: 2637, Natural disaster type: Fire
- Virginia Hurricane Katrina Evacuation, Incident Period: August 29, 2005 to October 01, 2005, Emergency Declared EM-3240: September 12, 2005, FEMA Id: 3240, Natural disaster type: Hurricane
- Virginia Severe Storms and Flooding from the remnants of Hurricane Jeanne, Incident Period: September 27, 2004 to September 30, 2004, Major Disaster (Presidential) Declared DR-1570: October 18, 2004, FEMA Id: 1570, Natural disaster type: Storm, Hurricane, Flood
- Virginia Winter Storm, Incident Period: January 25, 2000 to January 30, 2000, Major Disaster (Presidential) Declared DR-1318: February 28, 2000, FEMA Id: 1318, Natural disaster type: Winter Storm
- Virginia Blizzard, Incident Period: January 06, 1996 to January 12, 1996, Major Disaster (Presidential) Declared DR-1086: January 13, 1996, FEMA Id: 1086, Natural disaster type: Blizzard
- Virginia Ice Storm, Winter Storm, Severe Storm, Incident Period: March 01, 1994 to March 05, 1994, Major Disaster (Presidential) Declared DR-1021: April 11, 1994, FEMA Id: 1021, Natural disaster type: Ice Storm, Winter Storm, Storm
- 4 other natural disasters have been reported since 1953.
The number of natural disasters in Patrick County (14) is near the US average (15).
Major Disasters (Presidential) Declared: 8
Emergencies Declared: 4
Causes of natural disasters: Hurricanes: 4, Storms: 4, Winter Storms: 4, Floods: 3, Blizzard: 1, Drought: 1, Fire: 1, Ice Storm: 1, Snowstorm: 1, Other: 1 (Note: some incidents may be assigned to more than one category).
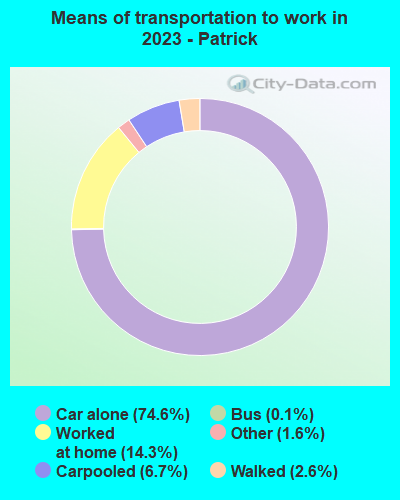
Means of transportation to work:
- Drove a car alone: 3,834 (71.4%)
- Carpooled: 391 (7.3%)
- Bus: 3 (0.1%)
- Taxicab, motorcycle, or other means: 87 (1.6%)
- Walked: 144 (2.7%)
- Worked at home: 926 (17.3%)
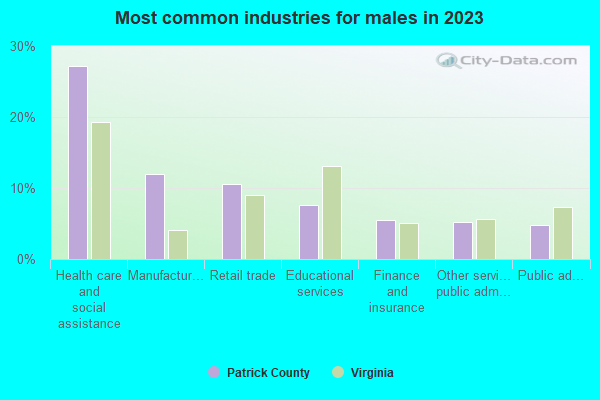
- Health care and social assistance (27%)
- Manufacturing (11%)
- Retail trade (8%)
- Educational services (6%)
- Finance and insurance (5%)
- Public administration (4%)
- Other services, except public administration (4%)
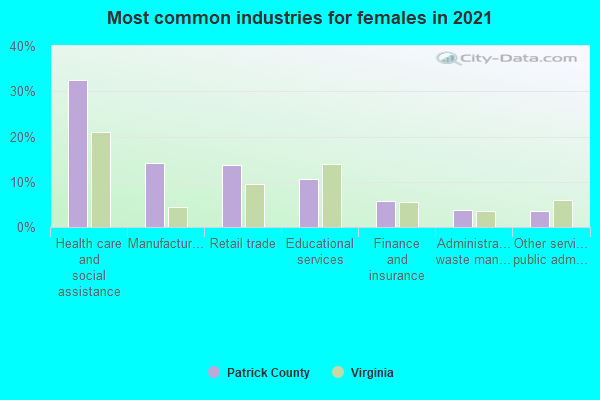
- Health care and social assistance (32%)
- Manufacturing (13%)
- Retail trade (10%)
- Educational services (8%)
- Finance and insurance (6%)
- Public administration (5%)
- Other services, except public administration (5%)
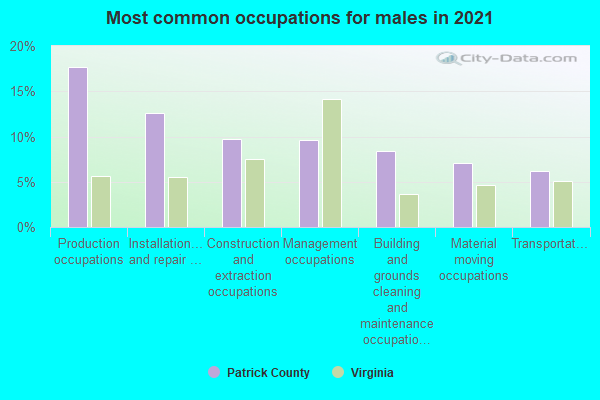
- Production occupations (17%)
- Construction and extraction occupations (11%)
- Management occupations (11%)
- Installation, maintenance, and repair occupations (9%)
- Transportation occupations (6%)
- Building and grounds cleaning and maintenance occupations (6%)
- Material moving occupations (6%)
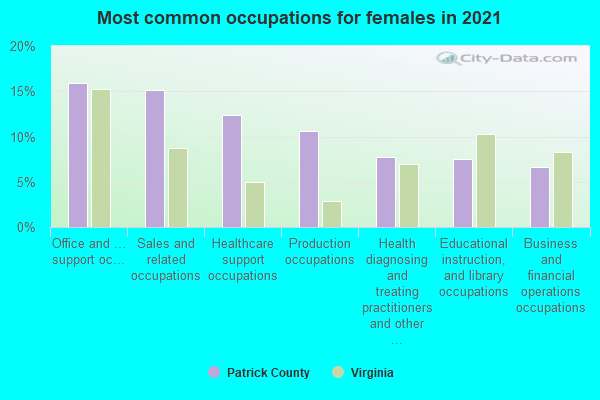
- Office and administrative support occupations (17%)
- Sales and related occupations (12%)
- Healthcare support occupations (9%)
- Production occupations (9%)
- Health diagnosing and treating practitioners and other technical occupations (8%)
- Business and financial operations occupations (7%)
- Management occupations (7%)
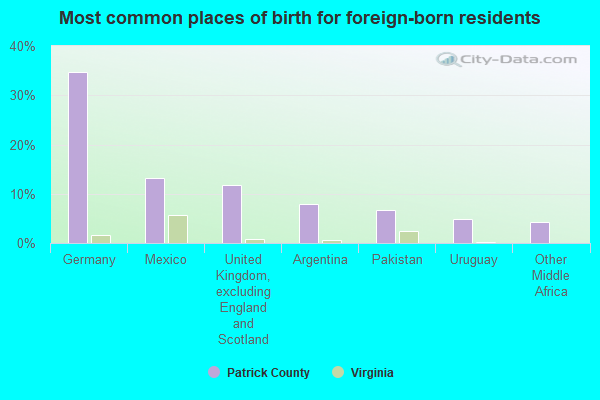
- Germany (32%)
- Argentina (9%)
- Mexico (7%)
- United Kingdom, excluding England and Scotland (7%)
- Uruguay (6%)
- Vietnam (5%)
- El Salvador (4%)
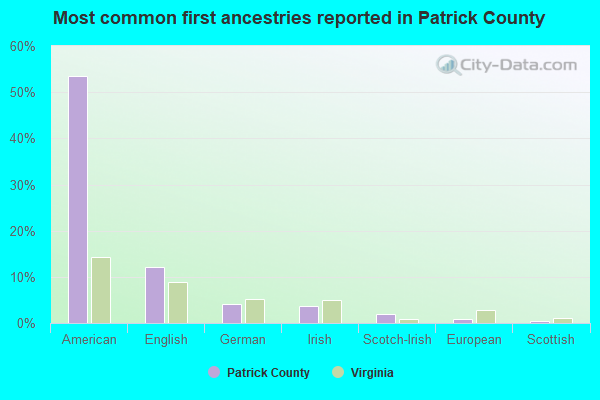
- American (54%)
- English (14%)
- German (5%)
- Irish (4%)
- Scotch-Irish (1%)
- European (1%)
- Italian (1%)
People in group quarters in Patrick County, Virginia in 2010:
- 160 people in nursing facilities/skilled-nursing facilities
- 31 people in local jails and other municipal confinement facilities
- 12 people in group homes intended for adults
People in group quarters in Patrick County, Virginia in 2000:
- 143 people in nursing homes
- 63 people in other noninstitutional group quarters
- 22 people in local jails and other confinement facilities (including police lockups)
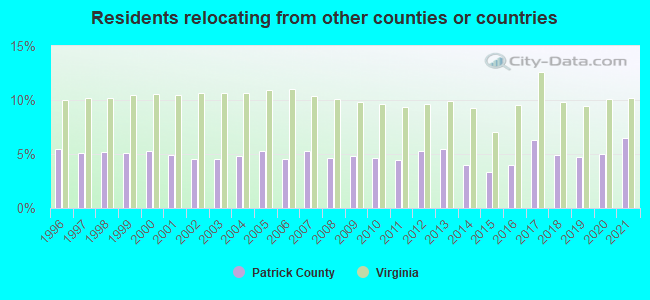
6.47% of this county's 2021 resident taxpayers lived in other counties in 2020 ($58,417 average adjusted gross income)
| Here: | 6.47% |
| Virginia average: | 10.16% |
10 or fewer of this county's residents moved from foreign countries.
3.01% relocated from other counties in Virginia ($24,312 average AGI)
3.45% relocated from other states ($34,105 average AGI)
Patrick County: 3.45% Virginia average: 3.91%
Top counties from which taxpayers relocated into this county between 2020 and 2021:
| from Henry County, VA | |
| from Surry County, NC |
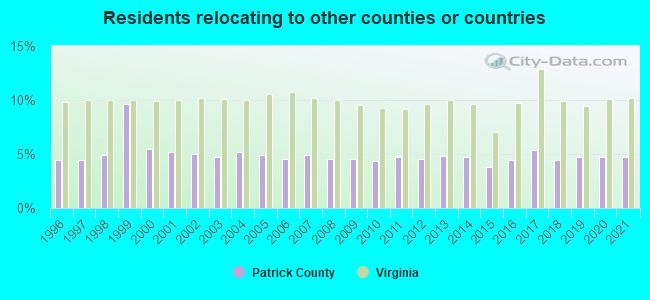
4.72% of this county's 2020 resident taxpayers moved to other counties in 2021 ($43,255 average adjusted gross income)
| Here: | 4.72% |
| Virginia average: | 10.20% |
10 or fewer of this county's residents moved to foreign countries.
2.76% relocated to other counties in Virginia ($24,473 average AGI)
1.96% relocated to other states ($18,782 average AGI)
Patrick County: 1.96% Virginia average: 3.98%
Top counties to which taxpayers relocated from this county between 2020 and 2021:
| to Henry County, VA | |
| to Surry County, NC |
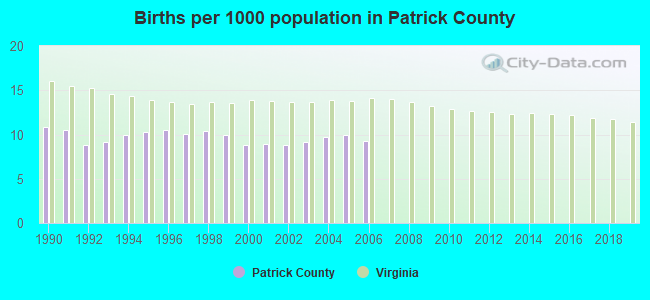
Births per 1000 population from 1990 to 1999: 10.0
Births per 1000 population from 2000 to 2006: 9.2
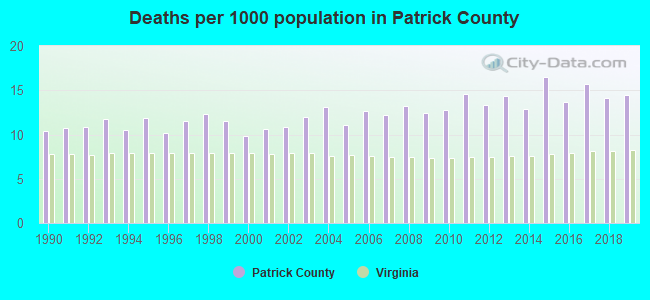
Deaths per 1000 population from 1990 to 1999: 11.2
Deaths per 1000 population from 2000 to 2009: 11.8
Deaths per 1000 population from 2010 to 2020: 14.6
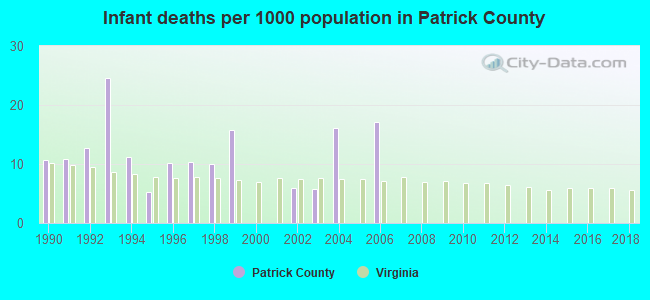
Infant deaths per 1000 live births from 1990 to 1999: 12.1
Infant deaths per 1000 live births from 2000 to 2006: 6.4
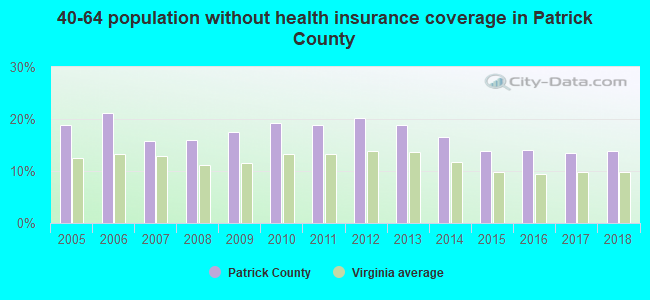
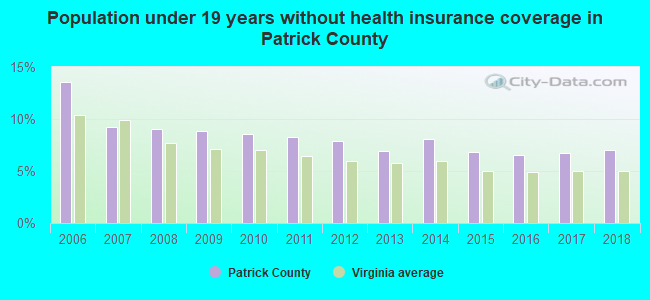
Persons under 19 years old without health insurance coverage in 2018: 7.0%
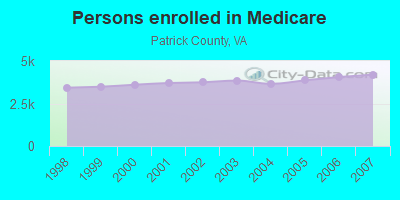
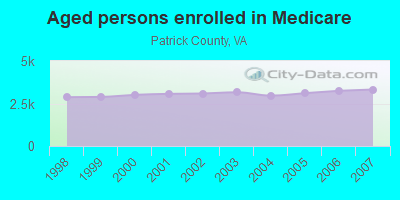
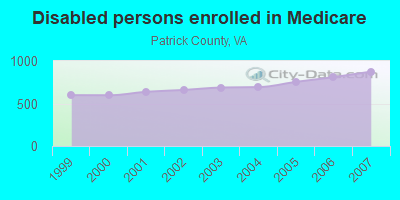
Persons enrolled in hospital insurance and/or supplemental medical insurance (Medicare) in July 1, 2007: 4,198 (3,323 aged, 875 disabled)
Children under 18 without health insurance coverage in 2007: 316 (8%)
Most common underlying causes of death in Patrick County, Virginia in 1999 - 2019:
- Atherosclerotic heart disease (570)
- Bronchus or lung, unspecified - Malignant neoplasms (298)
- Acute myocardial infarction, unspecified (155)
- Pneumonia, unspecified (119)
- Other forms of acute ischaemic heart disease (107)
- Chronic obstructive pulmonary disease, unspecified (82)
- Stroke, not specified as haemorrhage or infarction (71)
- Unspecified dementia (53)
- Alzheimer disease, unspecified (20)
- Atherosclerotic cardiovascular disease, so described (11)
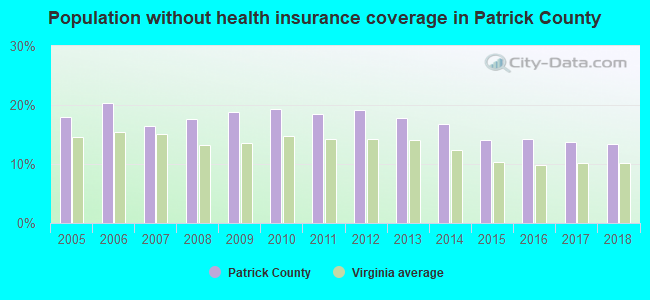
Population without health insurance coverage in 2000: 12%
Children under 18 without health insurance coverage in 2000: 8%
Short term general hospital admissions per 100,000 population in 2004: 3,431
Short term general hospital beds per 100,000 population in 2004: 260
Emergency room visits per 100,000 population in 2004: 29,243
General practice office based MDs per 100,000 population in 2005: 989
Medical specialist MDs per 100,000 population in 2005: 1,437
Dentists per 100,000 population in 1998: 10
Total births per 100,000 population, July 2005 - July 2006 : 16
Total deaths per 100,000 population, July 2005 - July 2006: 42
Limited-service eating places per 100,000 population in 2005 : 10
Crimes per 100,000 population in 1996: 1
Suicides per 1,000,000 population from 2000 to 2006: 202.6. This is more than state average.
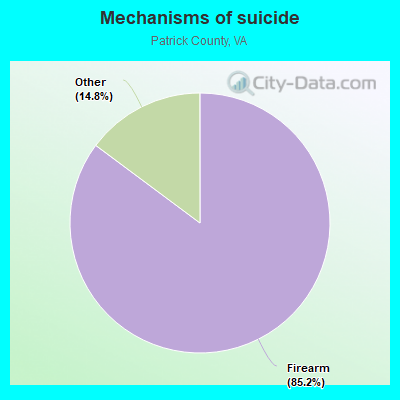
- Firearm - 172.6
- Other - 30.0
Household type by relationship:
Households: 17,781- Male householders: 3,902 (1,349 living alone), Female householders: 4,092 (1,131 living alone)
3,956 spouses (3,956 opposite-sex spouses), 523 unmarried partners, (449 opposite-sex unmarried partners), 3,701 children (3,374 natural, 72 adopted, 252 stepchildren), 553 grandchildren, 175 brothers or sisters, 116 parents, 0 foster children, 71 other relatives, 313 non-relatives
- In group quarters: 434
Size of family households: 2,784 2-persons, 1,109 3-persons, 677 4-persons, 186 5-persons, 113 6-persons, 57 7-or-more-persons.
Size of nonfamily households: 2,478 1-person, 544 2-persons, 68 4-persons.
1,970 married couples with children.
412 single-parent households (51 men, 361 women).
96.6% of residents of Patrick speak English at home.
2.6% of residents speak Spanish at home (68% speak English very well, 16% speak English well, 16% speak English not well).
0.5% of residents speak other Indo-European language at home (86% speak English very well, 14% speak English well).
0.4% of residents speak Asian or Pacific Island language at home (52% speak English very well, 48% speak English well).
0.1% of residents speak other language at home (100% speak English very well).
In fiscal year 2004:
Federal Government expenditure: $97,664,000 ($5,076 per capita)
Department of Defense expenditure: $6,940,000
Federal direct payments to individuals for retirement and disability: $53,194,000
Federal other direct payments to individuals: $20,199,000
Federal direct payments not to individuals: $458,000
Federal grants: $14,460,000
Federal procurement contracts: $6,410,000 ($4,785,000 Department of Defense)
Federal salaries and wages: $2,942,000 ($65,000 Department of Defense)
Federal Government direct loans: $575,000
Federal guaranteed/insured loans: $4,114,000
Federal Government insurance: $5,645,000
Population change from April 1, 2000 to July 1, 2005:
Births: 864| Here: | 45 per 1000 residents |
| State: | 70 per 1000 residents |
Deaths: 1,115
| Here: | 58 per 1000 residents |
| State: | 40 per 1000 residents |
Net international migration: +99
| Here: | +5 per 1000 residents |
| State: | +18 per 1000 residents |
Net internal migration: -17
| Here: | |
| State: |
Total withdrawal of fresh water for public supply: 0.00 millions of gallons per day (all from surface)
| Here: | 5.7 |
| State: | 7.0 |
| Here: | 4.6 |
| State: | 4.3 |
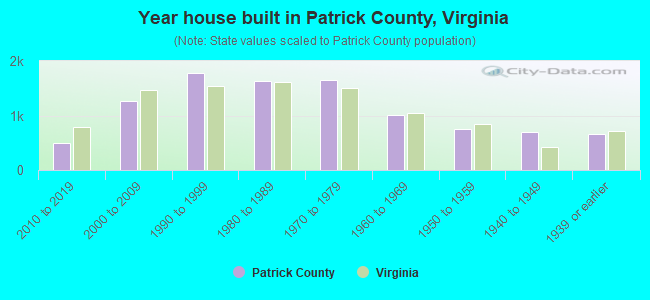
- Year house built in Patrick County, Virginia
- 182020 or later
- 5302010 to 2019
- 1,1272000 to 2009
- 1,9201990 to 1999
- 1,6571980 to 1989
- 1,4291970 to 1979
- 1,0741960 to 1969
- 7051950 to 1959
- 6921940 to 1949
- 7671939 or earlier
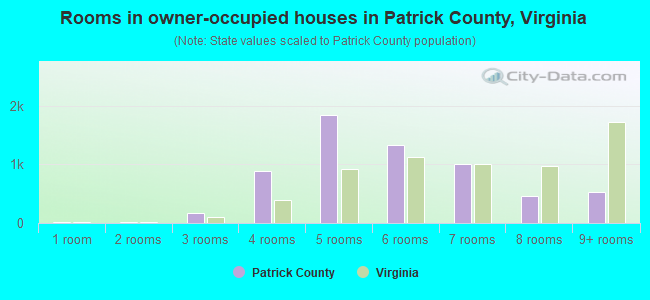
- Rooms in owner-occupied houses in Patrick County, Virginia
- 261 room
- 172 rooms
- 2103 rooms
- 8104 rooms
- 1,7765 rooms
- 1,3866 rooms
- 1,0847 rooms
- 4578 rooms
- 5759+ rooms
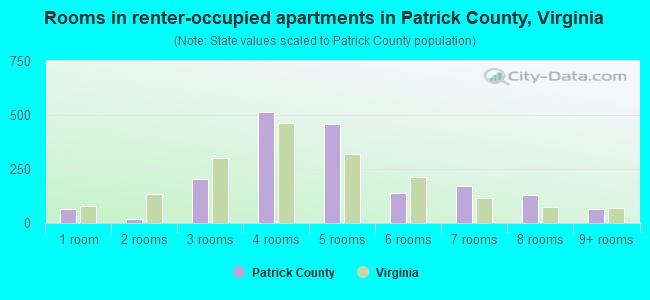
- Rooms in renter-occupied apartments in Patrick County, Virginia
- 401 room
- 362 rooms
- 1863 rooms
- 4984 rooms
- 4445 rooms
- 1896 rooms
- 1157 rooms
- 728 rooms
- 589+ rooms
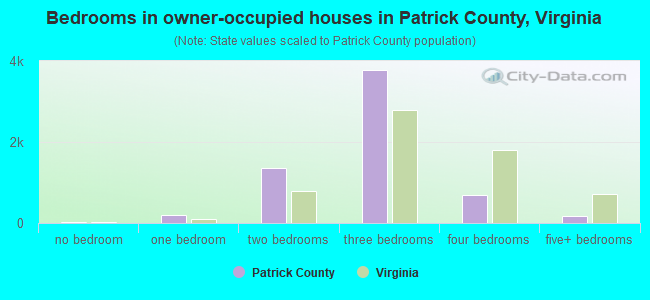
- Bedrooms in owner-occupied houses in Patrick County, Virginia
- 29no bedroom
- 2371 bedroom
- 1,3152 bedrooms
- 3,8633 bedrooms
- 7044 bedrooms
- 1905+ bedrooms
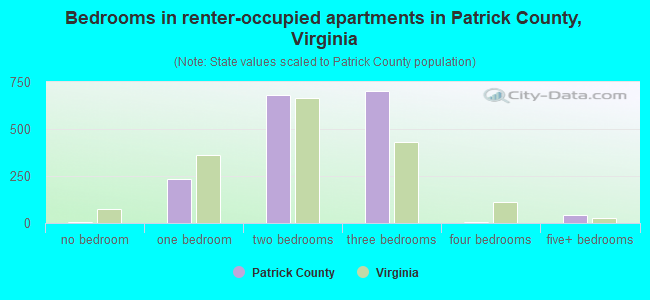
- Bedrooms in renter-occupied apartments in Patrick County, Virginia
- 40no bedroom
- 2611 bedroom
- 6472 bedrooms
- 6373 bedrooms
- 194 bedrooms
- 445+ bedrooms
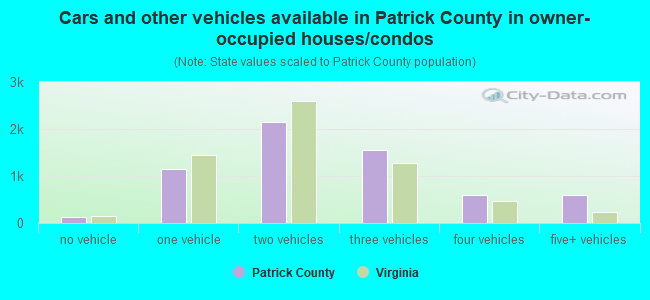
- Cars and other vehicles available in Patrick County in owner-occupied houses/condos
- 116no vehicle
- 1,2241 vehicle
- 2,4152 vehicles
- 1,3523 vehicles
- 5834 vehicles
- 6615+ vehicles
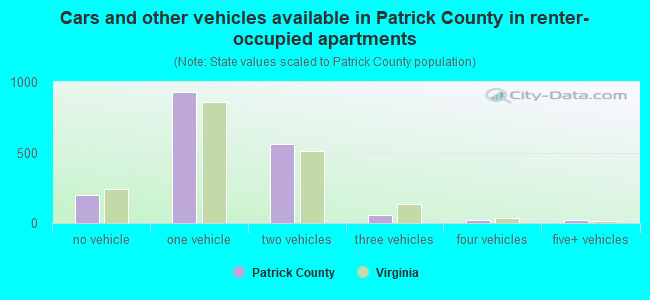
- Cars and other vehicles available in Patrick County in renter-occupied apartments
- 223no vehicle
- 7541 vehicle
- 4592 vehicles
- 1313 vehicles
- 264 vehicles
- 705+ vehicles
94.1% of Patrick County residents lived in the same house 1 years ago.
Out of people who lived in different houses, 17% lived in this county.
Out of people who lived in different counties, 55% lived in Virginia.
| Patrick County: | 94.1% |
| State average: | 86.6% |
Place of birth for U.S.-born residents:
- This state: 10,285
- Other state: 6,938
- Northeast: 997
- Midwest: 496
- South: 5,023
- West: 401
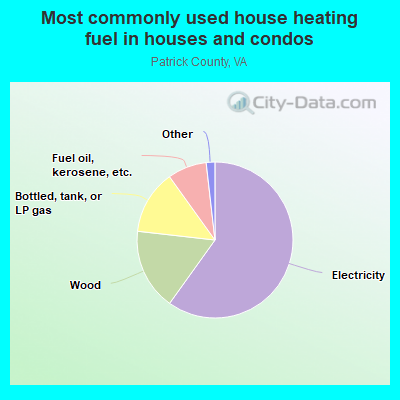
- 59.3%Electricity
- 15.1%Wood
- 14.4%Bottled, tank, or LP gas
- 9.0%Fuel oil, kerosene, etc.
- 1.1%Utility gas
- 0.6%No fuel used
- 0.3%Solar energy
- 0.2%Other fuel
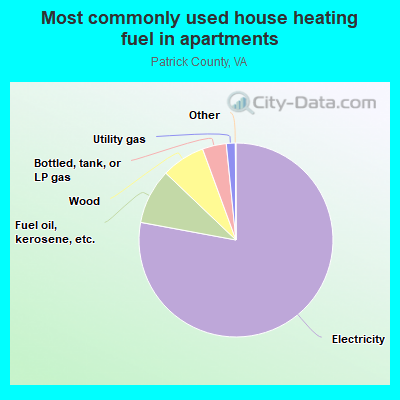
- 71.3%Electricity
- 9.8%Fuel oil, kerosene, etc.
- 9.2%Wood
- 8.2%Bottled, tank, or LP gas
- 1.6%Utility gas
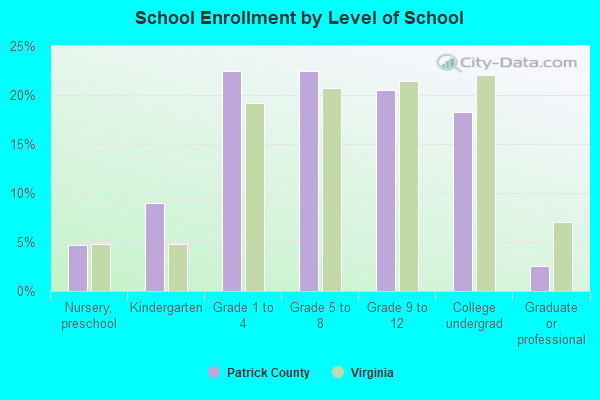
Private vs. public school enrollment:
| Here: | 8.5% |
| Virginia: | 13.2% |
| Here: | 12.1% |
| Virginia: | 10.2% |
| Here: | 10.4% |
| Virginia: | 18.7% |
Patrick County government finances - Expenditure in 2017:
- Bond Funds - Cash and Securities: $1,900,000
- Charges - Elementary and Secondary Education School Lunch: $376,000
Solid Waste Management: $235,000
Elementary and Secondary Education School Tuition and Transportation: $41,000
Parks and Recreation: $32,000
Sewerage: $24,000
Elementary and Secondary Education - Other: $4,000
- Construction - Regular Highways: $420,000
Elementary and Secondary Education: $283,000
- Current Operations - Elementary and Secondary Education: $27,410,000
Police Protection: $3,009,000
Public Welfare - Other: $2,131,000
Correctional Institutions: $1,803,000
Financial Administration: $761,000
Solid Waste Management: $678,000
Parks and Recreation: $675,000
Health - Other: $530,000
General Public Buildings: $436,000
Judicial and Legal Services: $432,000
Central Staff Services: $431,000
Local Fire Protection: $428,000
Water Utilities: $153,000
Sewerage: $122,000
Natural Resources - Other: $38,000
Public Welfare, Vendor Payments for Other Purposes: $35,000
Libraries: $23,000
- Federal Intergovernmental - Public Welfare: $916,000
Education: $64,000
- General - Interest on Debt: $1,470,000
- Intergovernmental to Local - Other - Elementary and Secondary Education: $357,000
- Local Intergovernmental - Education: $6,000
- Long Term Debt - Outstanding Unspecified Public Purpose: $69,798,000
Beginning Outstanding - Unspecified Public Purpose: $67,478,000
Issue, Unspecified Public Purpose: $8,504,000
Retired Unspecified Public Purpose: $6,184,000
- Miscellaneous - General Revenue - Other: $998,000
Fines and Forfeits: $27,000
Donations From Private Sources: $16,000
Rents: $11,000
Interest Earnings: $9,000
- Other Capital Outlay - Elementary and Secondary Education: $568,000
- Other Funds - Cash and Securities: $7,409,000
- Revenue - Water Utilities: $75,000
- Short Term Debt Outstanding - End of Fiscal Year: $591,000
Beginning: $587,000
- Sinking Funds - Cash and Securities: $238,000
- State Intergovernmental - Education: $21,226,000
Public Welfare: $742,000
- Tax - Property: $11,850,000
General Sales and Gross Receipts: $1,148,000
Motor Vehicle License: $449,000
Public Utilities Sales: $448,000
- Total Salaries and Wages: $16,264,000
- Water Utilities - Interest on Debt: $134,000
Patrick County government finances - Revenue in 2017:
- Bond Funds - Cash and Securities: $1,900,000
- Charges - Elementary and Secondary Education School Lunch: $376,000
Solid Waste Management: $235,000
Elementary and Secondary Education School Tuition and Transportation: $41,000
Parks and Recreation: $32,000
Sewerage: $24,000
Elementary and Secondary Education - Other: $4,000
- Construction - Regular Highways: $420,000
Elementary and Secondary Education: $283,000
- Current Operations - Elementary and Secondary Education: $27,410,000
Police Protection: $3,009,000
Public Welfare - Other: $2,131,000
Correctional Institutions: $1,803,000
Financial Administration: $761,000
Solid Waste Management: $678,000
Parks and Recreation: $675,000
Health - Other: $530,000
General Public Buildings: $436,000
Judicial and Legal Services: $432,000
Central Staff Services: $431,000
Local Fire Protection: $428,000
Water Utilities: $153,000
Sewerage: $122,000
Natural Resources - Other: $38,000
Public Welfare, Vendor Payments for Other Purposes: $35,000
Libraries: $23,000
- Federal Intergovernmental - Public Welfare: $916,000
Education: $64,000
- General - Interest on Debt: $1,470,000
- Intergovernmental to Local - Other - Elementary and Secondary Education: $357,000
- Local Intergovernmental - Education: $6,000
- Long Term Debt - Outstanding Unspecified Public Purpose: $69,798,000
Beginning Outstanding - Unspecified Public Purpose: $67,478,000
Issue, Unspecified Public Purpose: $8,504,000
Retired Unspecified Public Purpose: $6,184,000
- Miscellaneous - General Revenue - Other: $998,000
Fines and Forfeits: $27,000
Donations From Private Sources: $16,000
Rents: $11,000
Interest Earnings: $9,000
- Other Capital Outlay - Elementary and Secondary Education: $568,000
- Other Funds - Cash and Securities: $7,409,000
- Revenue - Water Utilities: $75,000
- Short Term Debt Outstanding - End of Fiscal Year: $591,000
Beginning: $587,000
- Sinking Funds - Cash and Securities: $238,000
- State Intergovernmental - Education: $21,226,000
Public Welfare: $742,000
- Tax - Property: $11,850,000
General Sales and Gross Receipts: $1,148,000
Motor Vehicle License: $449,000
Public Utilities Sales: $448,000
- Total Salaries and Wages: $16,264,000
- Water Utilities - Interest on Debt: $134,000
Patrick County government finances - Debt in 2017:
- Bond Funds - Cash and Securities: $1,900,000
- Charges - Elementary and Secondary Education School Lunch: $376,000
Solid Waste Management: $235,000
Elementary and Secondary Education School Tuition and Transportation: $41,000
Parks and Recreation: $32,000
Sewerage: $24,000
Elementary and Secondary Education - Other: $4,000
- Construction - Regular Highways: $420,000
Elementary and Secondary Education: $283,000
- Current Operations - Elementary and Secondary Education: $27,410,000
Police Protection: $3,009,000
Public Welfare - Other: $2,131,000
Correctional Institutions: $1,803,000
Financial Administration: $761,000
Solid Waste Management: $678,000
Parks and Recreation: $675,000
Health - Other: $530,000
General Public Buildings: $436,000
Judicial and Legal Services: $432,000
Central Staff Services: $431,000
Local Fire Protection: $428,000
Water Utilities: $153,000
Sewerage: $122,000
Natural Resources - Other: $38,000
Public Welfare, Vendor Payments for Other Purposes: $35,000
Libraries: $23,000
- Federal Intergovernmental - Public Welfare: $916,000
Education: $64,000
- General - Interest on Debt: $1,470,000
- Intergovernmental to Local - Other - Elementary and Secondary Education: $357,000
- Local Intergovernmental - Education: $6,000
- Long Term Debt - Outstanding Unspecified Public Purpose: $69,798,000
Beginning Outstanding - Unspecified Public Purpose: $67,478,000
Issue, Unspecified Public Purpose: $8,504,000
Retired Unspecified Public Purpose: $6,184,000
- Miscellaneous - General Revenue - Other: $998,000
Fines and Forfeits: $27,000
Donations From Private Sources: $16,000
Rents: $11,000
Interest Earnings: $9,000
- Other Capital Outlay - Elementary and Secondary Education: $568,000
- Other Funds - Cash and Securities: $7,409,000
- Revenue - Water Utilities: $75,000
- Short Term Debt Outstanding - End of Fiscal Year: $591,000
Beginning: $587,000
- Sinking Funds - Cash and Securities: $238,000
- State Intergovernmental - Education: $21,226,000
Public Welfare: $742,000
- Tax - Property: $11,850,000
General Sales and Gross Receipts: $1,148,000
Motor Vehicle License: $449,000
Public Utilities Sales: $448,000
- Total Salaries and Wages: $16,264,000
- Water Utilities - Interest on Debt: $134,000
Patrick County government finances - Cash and Securities in 2017:
- Bond Funds - Cash and Securities: $1,900,000
- Charges - Elementary and Secondary Education School Lunch: $376,000
Solid Waste Management: $235,000
Elementary and Secondary Education School Tuition and Transportation: $41,000
Parks and Recreation: $32,000
Sewerage: $24,000
Elementary and Secondary Education - Other: $4,000
- Construction - Regular Highways: $420,000
Elementary and Secondary Education: $283,000
- Current Operations - Elementary and Secondary Education: $27,410,000
Police Protection: $3,009,000
Public Welfare - Other: $2,131,000
Correctional Institutions: $1,803,000
Financial Administration: $761,000
Solid Waste Management: $678,000
Parks and Recreation: $675,000
Health - Other: $530,000
General Public Buildings: $436,000
Judicial and Legal Services: $432,000
Central Staff Services: $431,000
Local Fire Protection: $428,000
Water Utilities: $153,000
Sewerage: $122,000
Natural Resources - Other: $38,000
Public Welfare, Vendor Payments for Other Purposes: $35,000
Libraries: $23,000
- Federal Intergovernmental - Public Welfare: $916,000
Education: $64,000
- General - Interest on Debt: $1,470,000
- Intergovernmental to Local - Other - Elementary and Secondary Education: $357,000
- Local Intergovernmental - Education: $6,000
- Long Term Debt - Outstanding Unspecified Public Purpose: $69,798,000
Beginning Outstanding - Unspecified Public Purpose: $67,478,000
Issue, Unspecified Public Purpose: $8,504,000
Retired Unspecified Public Purpose: $6,184,000
- Miscellaneous - General Revenue - Other: $998,000
Fines and Forfeits: $27,000
Donations From Private Sources: $16,000
Rents: $11,000
Interest Earnings: $9,000
- Other Capital Outlay - Elementary and Secondary Education: $568,000
- Other Funds - Cash and Securities: $7,409,000
- Revenue - Water Utilities: $75,000
- Short Term Debt Outstanding - End of Fiscal Year: $591,000
Beginning: $587,000
- Sinking Funds - Cash and Securities: $238,000
- State Intergovernmental - Education: $21,226,000
Public Welfare: $742,000
- Tax - Property: $11,850,000
General Sales and Gross Receipts: $1,148,000
Motor Vehicle License: $449,000
Public Utilities Sales: $448,000
- Total Salaries and Wages: $16,264,000
- Water Utilities - Interest on Debt: $134,000
Supplemental Security Income (SSI) in 2006:
- Total number of recipients: 509
- Number of aged recipients: 79
- Number of blind and disabled recipients: 430
- Number of recipients under 18: 57
- Number of recipients between 18 and 64: 310
- Number of recipients older than 64: 142
- Number of recipients also receiving OASDI: 221
- Amount of payments (thousands of dollars): 206
| Most common first names in Patrick County, VA among deceased individuals | ||
| Name | Count | Lived (average) |
|---|---|---|
| James | 123 | 72.8 years |
| William | 95 | 74.7 years |
| John | 89 | 76.7 years |
| Mary | 77 | 78.6 years |
| Robert | 64 | 72.9 years |
| George | 64 | 75.4 years |
| Annie | 36 | 82.2 years |
| Walter | 35 | 77.3 years |
| Charles | 34 | 69.7 years |
| Charlie | 33 | 78.1 years |
| Most common last names in Patrick County, VA among deceased individuals | ||
| Last name | Count | Lived (average) |
|---|---|---|
| Martin | 127 | 74.0 years |
| Clark | 65 | 78.8 years |
| Lawson | 61 | 74.6 years |
| Hall | 60 | 75.3 years |
| Williams | 49 | 77.1 years |
| Turner | 48 | 73.3 years |
| Pendleton | 45 | 77.5 years |
| Foley | 45 | 74.7 years |
| Hylton | 41 | 81.9 years |
| Handy | 40 | 75.5 years |
| Businesses in Patrick County, VA | ||||
| Name | Count | Name | Count | |
|---|---|---|---|---|
| Advance Auto Parts | 1 | Rite Aid | 1 | |
| Circle K | 1 | Subway | 1 | |
| Curves | 1 | True Value | 1 | |
| FedEx | 1 | U-Haul | 1 | |
| GNC | 1 | U.S. Cellular | 1 | |
| H&R Block | 1 | UPS | 1 | |
| Lane Furniture | 1 | Walmart | 1 | |
| Little Caesars Pizza | 1 | Wendy's | 1 | |
| MasterBrand Cabinets | 2 | |||