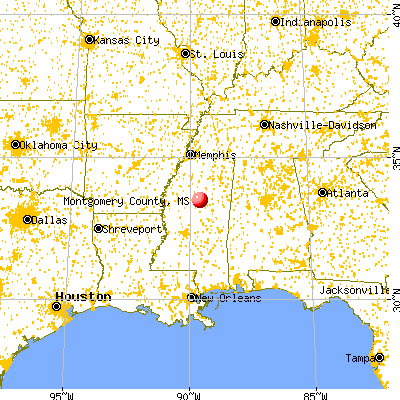
Montgomery County, Mississippi (MS)
County owner-occupied free and clear houses and condos in 2010: 1,846
County owner-occupied houses and condos in 2000: 3,608
Renter-occupied apartments: 1,202 (it was 1,082 in 2000)
| % of renters here: | 23% |
| State: | 30% |
Land area: 407 sq. mi.
Water area: 1.0 sq. mi.
Population density: 24 people per square mile (low).
Industries providing employment: Educational, health and social services (21.5%), Manufacturing (20.3%), Arts, entertainment, recreation, accommodation and food services (10.6%), Retail trade (10.3%).
Type of workers:
- Private wage or salary: 74%
- Government: 19%
- Self-employed, not incorporated: 7%
- Unpaid family work: 0%
- OSM Map
- General Map
- Google Map
- MSN Map

- 5,02551.9%White Non-Hispanic Alone
- 4,39945.4%Black Non-Hispanic Alone
- 1962.0%Two or more races
- 620.6%Hispanic or Latino

| Median resident age: | 42.9 years |
| Mississippi median age: | 38.9 years |
| Males: 4,636 | |
| Females: 5,104 |

 | What is Mississippi like? (5 replies) |
| Anyone here who attends or teaches (or used to do either) at Delta State? (1 reply) |
| If you had $150,000 to spend on a house, where would you live in MS? (120 replies) |
| How Are Things in the Mississippi Delta? (64 replies) |
| Teaching in teacher shortage areas. (6 replies) |
| Montgomery County: | 2.0 people |
| Mississippi: | 3 people |
Estimated median household income in 2022: $36,660 ($25,270 in 1999)
| This county: | $36,660 |
| Mississippi: | $52,719 |
Median contract rent in 2022 for apartments: $372 (lower quartile is $316, upper quartile is $578)
| This county: | $372 |
| State: | $656 |
Estimated median house or condo value in 2022: $104,495 (it was $48,600 in 2000)
| Montgomery: | $104,495 |
| Mississippi: | $162,500 |
Mean price in 2022:
Median monthly housing costs for homes and condos with a mortgage: $1,085Detached houses: $129,538
Here: $129,538 State: $226,494 Townhouses or other attached units: $173,055
Here: $173,055 State: $254,198 Mobile homes: $35,566
Here: $35,566 State: $73,695
Median monthly housing costs for units without a mortgage: $407
Institutionalized population: 99
Crime in 1996 (reported by the sheriff's office or county police, not the county total):
- Murders: 0
- Rapes: 0
- Robberies: 1
- Assaults: 0
- Burglaries: 1
- Thefts: 0
- Auto thefts: 2
Crime in 1995 (reported by the sheriff's office or county police, not the county total):
- Murders: 0
- Rapes: 1
- Robberies: 0
- Assaults: 3
- Burglaries: 2
- Thefts: 4
- Auto thefts: 0
Single-family new house construction building permits:
- 2022: 13 buildings, average cost: $39,000
- 2021: 13 buildings, average cost: $39,000
- 2020: 10 buildings, average cost: $39,000
- 2019: 12 buildings, average cost: $39,000
- 2018: 13 buildings, average cost: $46,900
- 2017: 11 buildings, average cost: $39,000
- 2016: 11 buildings, average cost: $39,000
- 2015: 9 buildings, average cost: $39,000
- 2014: 11 buildings, average cost: $42,000
- 2013: 9 buildings, average cost: $40,800
- 2012: 15 buildings, average cost: $121,900
- 2011: 14 buildings, average cost: $117,900
- 2010: 14 buildings, average cost: $117,900
- 2009: 11 buildings, average cost: $152,000
- 2008: 16 buildings, average cost: $50,100
- 2007: 11 buildings, average cost: $59,900
- 2006: 11 buildings, average cost: $73,900
- 2005: 12 buildings, average cost: $71,000
- 2004: 21 buildings, average cost: $72,900
- 2003: 26 buildings, average cost: $105,400
- 2002: 13 buildings, average cost: $50,800
- 2001: 11 buildings, average cost: $53,000
- 2000: 4 buildings, average cost: $45,500
- 1999: 11 buildings, average cost: $57,800
- 1998: 3 buildings, average cost: $50,600
- 1997: 6 buildings, average cost: $71,000


Median real estate property taxes paid for housing units with mortgages in 2022: $1,128 (1.0%)
Median real estate property taxes paid for housing units with no mortgage in 2022: $635 (0.7%)


| Montgomery County: | 24.1% |
| Mississippi: | 19.1% |
Median age of residents in 2022: 42.9 years old
(Males: 40.8 years old, Females: 44.5 years old)
(Median age for: White residents: 47.0 years old, Black residents: 38.3 years old, Hispanic or Latino residents: 40.7 years old)
Fair market rent in 2006 for a 1-bedroom apartment in Montgomery County is $384 a month.
Fair market rent for a 2-bedroom apartment is $455 a month.
Fair market rent for a 3-bedroom apartment is $610 a month.
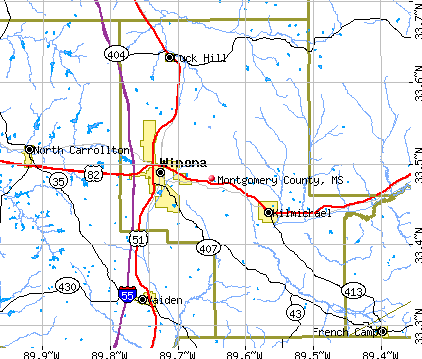
Cities in this county include: Winona, Kilmichael, Duck Hill.
Notable locations in this county outside city limits:
Notable locations in Montgomery County: Carroll (A), Smiths (B), Wood (C), McCarley Community Center (D), Beat 1 - Carroll County Volunteer Fire Department (E). Display/hide their locations on the map
Churches in Montgomery County include: New Hope Church (A), New Jerusalem Church (B), New Salem Church (C), New Zion Church (D), Oak Grove Church (E), Old Plank Church (F), Old Union Church (G), Pine Bluff Church (H), Pink Flower Church (I). Display/hide their locations on the map
Cemeteries: Hopewell Cemetery (1), Centerville Cemetery (2), Hudson Cemetery (3), New Hope Cemetery (4), Purnell Cemetery (5), Marshall Cemetery (6), Mount Olive Cemetery (7). Display/hide their locations on the map
Lakes and reservoirs: Bee Lake (A), Denman Lake (B), Lightline Lake (C), Third Bridge Lake (D), O'Neal Lake (E), Round Lake (F), Carpenter Lake (G), Morgan Lake (H). Display/hide their locations on the map
Streams, rivers, and creeks: Billups Creek (A), Billups Branch (B), Bear Den Creek (C), Babmore Branch (D), Ashley Creek (E), Carpenter Creek (F), Aikens Creek (G), Abotcaputa Creek (H), Wagoner Branch (I). Display/hide their locations on the map
Neighboring counties: Clay County  , Talladega County, Alabama , Haralson County, Georgia , Winston County
  , Hopkins County, Texas
  .
.
| Here: | 3.0% |
| Mississippi: | 2.6% |


Current college students: 363
People 25 years of age or older with a high school degree or higher: 75.6%
People 25 years of age or older with a bachelor's degree or higher: 16.9%
Number of foreign born residents: 43 (20.9% naturalized citizens)
| Montgomery County: | 0.4% |
| Whole state: | 2.2% |

- Year of entry for the foreign-born population
- 02010 or later
- 302000 to 2009
- 01990 to 1999
- 71980 to 1989
- 51970 to 1979
- 14Before 1970
Mean travel time to work (commute): minutes
Percentage of county residents living and working in this county: 98.5%
Housing units in structures:
- One, detached: 3,953
- One, attached: 47
- Two: 154
- 3 or 4: 82
- 5 to 9: 44
- 10 to 19: 76
- 20 to 49: 17
- 50 or more: 160
- Mobile homes: 849
- Boats, RVs, vans, etc.: 2
Housing units in Montgomery County with a mortgage: 984 (30 second mortgage, 6 home equity loan, 21 both second mortgage and home equity loan)
Houses without a mortgage: 13
| Here: | 98.7% with mortgage |
| State: | 97.5% with mortgage |
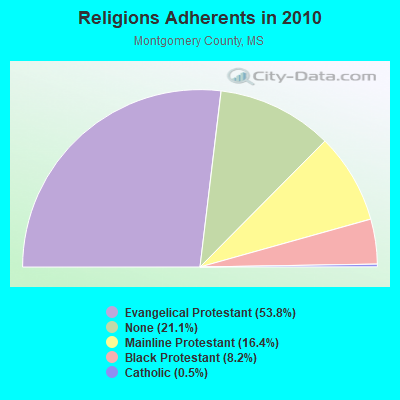
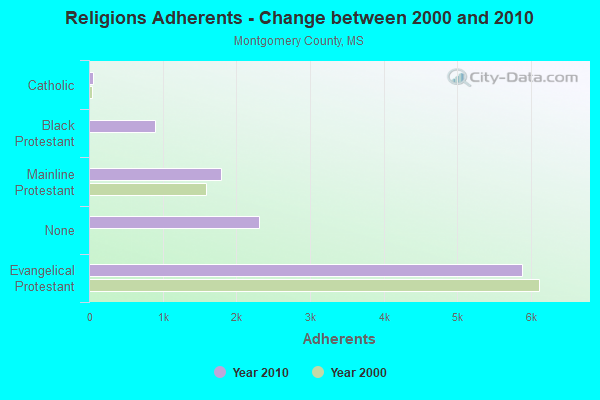
Religion statistics for Montgomery County
| Religion | Adherents | Congregations |
|---|---|---|
| Evangelical Protestant | 5,882 | 25 |
| Mainline Protestant | 1,789 | 15 |
| Black Protestant | 891 | 5 |
| Catholic | 60 | 1 |
| Other | - | 1 |
| None | 2,303 | - |
Source: Clifford Grammich, Kirk Hadaway, Richard Houseal, Dale E.Jones, Alexei Krindatch, Richie Stanley and Richard H.Taylor. 2012. 2010 U.S.Religion Census: Religious Congregations & Membership Study. Association of Statisticians of American Religious Bodies. Jones, Dale E., et al. 2002. Congregations and Membership in the United States 2000. Nashville, TN: Glenmary Research Center.
Food Environment Statistics:
| Montgomery County: | 3.49 / 10,000 pop. |
| State: | 2.08 / 10,000 pop. |
| This county: | 0.87 / 10,000 pop. |
| Mississippi: | 0.80 / 10,000 pop. |
| Montgomery County: | 11.33 / 10,000 pop. |
| Mississippi: | 6.36 / 10,000 pop. |
| This county: | 7.85 / 10,000 pop. |
| State: | 5.03 / 10,000 pop. |
| Montgomery County: | 14.4% |
| Mississippi: | 12.3% |
| Montgomery County: | 34.5% |
| State: | 33.1% |
| Here: | 24.9% |
| State: | 14.4% |
Agriculture in Montgomery County:
Average size of farms: 244 acresAverage value of agricultural products sold per farm: $18,918
Average value of crops sold per acre for harvested cropland: $193.16
The value of livestock, poultry, and their products as a percentage of the total market value of agricultural products sold: 54.82%
Average total farm production expenses per farm: $18,623
Harvested cropland as a percentage of land in farms: 18.15%
Average market value of all machinery and equipment per farm: $42,076
The percentage of farms operated by a family or individual: 93.18%
Average age of principal farm operators: 59 years
Average number of cattle and calves per 100 acres of all land in farms: 11.77
Milk cows as a percentage of all cattle and calves: 0.30%
Corn for grain: 2139 harvested acres
Upland cotton: 5866 harvested acres
Soybeans for beans: 1078 harvested acres
Vegetables: 58 harvested acres
Tornado activity:
Montgomery County historical area-adjusted tornado activity is significantly below Mississippi state average. It is 1683061.3 times below overall U.S. average.Tornadoes in this county have caused 3 fatalities and 21 injuries recorded between 1950 and 2004.
On 12/21/1990, a category 3 (max. wind speeds 158-206 mph) tornado killed one person and injured 15 people
Earthquake activity:
Montgomery County-area historical earthquake activity is significantly above Mississippi state average. It is 253% greater than the overall U.S. average.On 3/25/1976 at 00:41:20, a magnitude 5.0 (4.9 MB, 5.0 LG, Class: Moderate, Intensity: VI - VII) earthquake occurred 154.0 miles away from Montgomery County center
On 1/18/1999 at 07:00:53, a magnitude 4.8 (4.8 MB, 4.0 LG, Depth: 0.6 mi, Class: Light, Intensity: IV - V) earthquake occurred 138.4 miles away from the county center
On 6/24/1975 at 11:11:36, a magnitude 4.5 (4.5 MB) earthquake occurred 105.7 miles away from the county center
On 5/4/1991 at 01:18:54, a magnitude 5.0 (4.4 MB, 4.6 LG, 5.0 LG, Depth: 3.1 mi) earthquake occurred 213.5 miles away from the county center
On 4/27/1989 at 16:47:49, a magnitude 4.7 (4.6 MB, 4.7 LG, 4.3 LG) earthquake occurred 174.8 miles away from Montgomery County center
On 10/24/1997 at 08:35:17, a magnitude 4.9 (4.8 MB, 4.2 MS, 4.9 LG, Depth: 6.2 mi) earthquake occurred 214.3 miles away from the county center
Magnitude types: regional Lg-wave magnitude (LG), body-wave magnitude (MB), surface-wave magnitude (MS)
Most recent natural disasters:
- Mississippi Severe Storms, Tornadoes, Straight-line Winds, And Flooding, Incident Period: April 12, 2020, FEMA Id: 4536, Natural disaster type: Storm, Tornado, Flood, Wind
- Mississippi Covid-19 Pandemic, Incident Period: January 20, 2020, FEMA Id: 4528, Natural disaster type: Other
- Mississippi Severe Storms, Straight-line Winds, Tornadoes, And Flooding, Incident Period: February 22, 2019 - March 29, 2019, FEMA Id: 4429, Natural disaster type: Storm, Tornado, Flood, Wind
- Mississippi Severe Storms, Tornadoes, Straight-line Winds, And Flooding, Incident Period: April 30, 2017, FEMA Id: 4314, Natural disaster type: Storm, Tornado, Flood, Wind
- Mississippi Severe Storms, Tornadoes, and Flooding, Incident Period: April 28, 2014 to May 03, 2014, Major Disaster (Presidential) Declared DR-4175: April 30, 2014, FEMA Id: 4175, Natural disaster type: Storm, Tornado, Flood
- Mississippi Tropical Storm Isaac, Incident Period: August 26, 2012 to September 11, 2012, Emergency Declared EM-3348: August 28, 2012, FEMA Id: 3348, Natural disaster type: Tropical Storm
- Mississippi Hurricane Isaac, Incident Period: August 26, 2012 to September 11, 2012, Major Disaster (Presidential) Declared DR-4081: August 29, 2012, FEMA Id: 4081, Natural disaster type: Hurricane
- Mississippi Severe Storms, Tornadoes, Straight-line Winds, and Associated Flooding, Incident Period: April 15, 2011 to April 28, 2011, Major Disaster (Presidential) Declared DR-1972: April 29, 2011, FEMA Id: 1972, Natural disaster type: Storm, Tornado, Flood, Wind
- Mississippi Severe Winter Storms, Ice and Freezing Rain, Incident Period: December 23, 1998 to December 26, 1998, Major Disaster (Presidential) Declared DR-1265: January 25, 1999, FEMA Id: 1265, Natural disaster type: Winter Storm, Freeze
- Mississippi STORMS, TORNADOES, FLOODS, Incident Period: April 16, 1979, Major Disaster (Presidential) Declared DR-577: April 16, 1979, FEMA Id: 577, Natural disaster type: Storm, Tornado, Flood
- 2 other natural disasters have been reported since 1953.
The number of natural disasters in Montgomery County (12) is smaller than the US average (15).
Major Disasters (Presidential) Declared: 6
Emergencies Declared: 2
Causes of natural disasters: Floods: 7, Tornadoes: 7, Storms: 6, Winds: 4, Freezes: 2, Drought: 1, Heavy Rain: 1, Hurricane: 1, Tropical Storm: 1, Winter Storm: 1, Other: 1 (Note: some incidents may be assigned to more than one category).

Means of transportation to work:
- Drove a car alone: 1,926 (73.4%)
- Carpooled: 397 (15.1%)
- Taxicab, motorcycle, or other means: 62 (2.4%)
- Walked: 169 (6.4%)
- Worked at home: 79 (3.0%)


- Health care and social assistance (21%)
- Educational services (20%)
- Accommodation and food services (18%)
- Retail trade (14%)
- Manufacturing (12%)
- Professional, scientific, and technical services (5%)
- Public administration (3%)

- Health care and social assistance (19%)
- Educational services (18%)
- Accommodation and food services (16%)
- Retail trade (13%)
- Manufacturing (11%)
- Professional, scientific, and technical services (5%)
- Public administration (3%)

- Production occupations (17%)
- Construction and extraction occupations (14%)
- Management occupations (11%)
- Transportation occupations (9%)
- Food preparation and serving related occupations (7%)
- Installation, maintenance, and repair occupations (7%)
- Sales and related occupations (7%)

- Educational instruction, and library occupations (14%)
- Office and administrative support occupations (14%)
- Sales and related occupations (11%)
- Food preparation and serving related occupations (10%)
- Management occupations (10%)
- Healthcare support occupations (9%)
- Production occupations (8%)

- Honduras (89%)
- Mexico (20%)
- Norway (0%)
- Sweden (0%)
- United Kingdom, excluding England and Scotland (0%)
- England (0%)
- Scotland (0%)

- American (12%)
- English (9%)
- Irish (3%)
- Scottish (1%)
- Scotch-Irish (1%)
- European (1%)
- German (0%)


People in group quarters in Montgomery County, Mississippi in 2000:
- 122 people in nursing homes
- 28 people in hospitals/wards and hospices for chronically ill
- 28 people in other hospitals or wards for chronically ill
5.98% of this county's 2021 resident taxpayers lived in other counties in 2020 ($35,332 average adjusted gross income)
| Here: | 5.98% |
| Mississippi average: | 6.85% |
10 or fewer of this county's residents moved from foreign countries.
4.80% relocated from other counties in Mississippi ($28,154 average AGI)
1.18% relocated from other states ($7,178 average AGI)
Montgomery County: 1.18% Mississippi average: 2.80%

Top counties from which taxpayers relocated into this county between 2020 and 2021:
| from Grenada County, MS | |
| from Carroll County, MS |
6.03% of this county's 2020 resident taxpayers moved to other counties in 2021 ($38,238 average adjusted gross income)
| Here: | 6.03% |
| Mississippi average: | 7.03% |
10 or fewer of this county's residents moved to foreign countries.
4.97% relocated to other counties in Mississippi ($32,929 average AGI)
1.06% relocated to other states ($5,310 average AGI)
Montgomery County: 1.06% Mississippi average: 2.99%

Top counties to which taxpayers relocated from this county between 2020 and 2021:
| to Grenada County, MS | |
| to Carroll County, MS |
Births per 1000 population from 1990 to 1999: 15.2
Births per 1000 population from 2000 to 2006: 13.8

Deaths per 1000 population from 1990 to 1999: 12.7
Deaths per 1000 population from 2000 to 2009: 12.2
Deaths per 1000 population from 2010 to 2020: 15.0

Infant deaths per 1000 live births from 1990 to 1999: 17.1
Infant deaths per 1000 live births from 2000 to 2006: 8.1

Persons under 19 years old without health insurance coverage in 2018: 4.4%


Persons enrolled in hospital insurance and/or supplemental medical insurance (Medicare) in July 1, 2007: 2,423 (1,845 aged, 578 disabled)
Children under 18 without health insurance coverage in 2007: 383 (14%)


Most common underlying causes of death in Montgomery County, Mississippi in 1999 - 2019:
- Acute myocardial infarction, unspecified (185)
- Congestive heart failure (89)
- Bronchus or lung, unspecified - Malignant neoplasms (69)
- Chronic obstructive pulmonary disease, unspecified (22)
- Pneumonia, unspecified (10)
Population without health insurance coverage in 2000: 18%
Children under 18 without health insurance coverage in 2000: 14%
Short term general hospital admissions per 100,000 population in 2004: 11,518
Short term general hospital beds per 100,000 population in 2004: 375
Emergency room visits per 100,000 population in 2004: 56,403
General practice office based MDs per 100,000 population in 2005: 1,767
Medical specialist MDs per 100,000 population in 2005: 1,133
Dentists per 100,000 population in 1998: 8
Total births per 100,000 population, July 2005 - July 2006 : 16
Total deaths per 100,000 population, July 2005 - July 2006: 51
Crimes per 100,000 population in 1996: 1
Household type by relationship:
Households: 9,740- Male householders: 1,785 (692 living alone), Female householders: 2,136 (694 living alone)
1,240 spouses (1,240 opposite-sex spouses), 271 unmarried partners, (271 opposite-sex unmarried partners), 2,749 children (2,696 natural, 46 adopted, 13 stepchildren), 707 grandchildren, 236 brothers or sisters, 76 parents, 0 foster children, 251 other relatives, 117 non-relatives
- In group quarters: 138
Size of family households: 1,370 2-persons, 576 3-persons, 254 4-persons, 94 5-persons, 35 6-persons, 65 7-or-more-persons.
Size of nonfamily households: 1,388 1-person, 127 2-persons, 20 3-persons.
817 married couples with children.
785 single-parent households (136 men, 649 women).
99.2% of residents of Montgomery speak English at home.
0.9% of residents speak Spanish at home (68% speak English very well, 32% speak English well).
0.2% of residents speak other Indo-European language at home (100% speak English very well).
In fiscal year 2004:
Federal Government expenditure: $104,082,000 ($8,880 per capita)
Department of Defense expenditure: $4,470,000
Federal direct payments to individuals for retirement and disability: $35,116,000
Federal other direct payments to individuals: $23,749,000
Federal direct payments not to individuals: $1,812,000
Federal grants: $38,000,000
Federal procurement contracts: $569,000 ($0,000 Department of Defense)
Federal salaries and wages: $4,837,000 ($2,970,000 Department of Defense)
Federal Government direct loans: $195,000
Federal guaranteed/insured loans: $788,000
Federal Government insurance: $3,139,000
Population change from April 1, 2000 to July 1, 2005:
Births: 863| Here: | 73 per 1000 residents |
| State: | 78 per 1000 residents |
Deaths: 700
| Here: | 59 per 1000 residents |
| State: | 51 per 1000 residents |
Net international migration: 0
| Here: | 0 per 1000 residents |
| State: | +4 per 1000 residents |
Net internal migration: -506
| Here: | |
| State: |

Total withdrawal of fresh water for public supply: 3.95 millions of gallons per day (all from ground)
| Here: | 5.9 |
| State: | 6.3 |
| Here: | 4.9 |
| State: | 4.8 |

- Year house built in Montgomery County, Mississippi
- 02020 or later
- 3632010 to 2019
- 4022000 to 2009
- 6951990 to 1999
- 1,0471980 to 1989
- 7111970 to 1979
- 4561960 to 1969
- 5291950 to 1959
- 4831940 to 1949
- 5201939 or earlier

- Rooms in owner-occupied houses in Montgomery County, Mississippi
- 431 room
- 292 rooms
- 1063 rooms
- 3384 rooms
- 5725 rooms
- 5556 rooms
- 4127 rooms
- 3428 rooms
- 2479+ rooms

- Rooms in renter-occupied apartments in Montgomery County, Mississippi
- 161 room
- 712 rooms
- 2073 rooms
- 2054 rooms
- 4155 rooms
- 2376 rooms
- 937 rooms
- 188 rooms
- 99+ rooms

- Bedrooms in owner-occupied houses in Montgomery County, Mississippi
- 44no bedroom
- 631 bedroom
- 5822 bedrooms
- 1,4763 bedrooms
- 3244 bedrooms
- 1275+ bedrooms

- Bedrooms in renter-occupied apartments in Montgomery County, Mississippi
- 17no bedroom
- 2751 bedroom
- 3632 bedrooms
- 4653 bedrooms
- 1604 bedrooms
- 05+ bedrooms

- Cars and other vehicles available in Montgomery County in owner-occupied houses/condos
- 121no vehicle
- 6041 vehicle
- 9952 vehicles
- 6063 vehicles
- 1904 vehicles
- 1295+ vehicles

- Cars and other vehicles available in Montgomery County in renter-occupied apartments
- 207no vehicle
- 5601 vehicle
- 3082 vehicles
- 2133 vehicles
- 04 vehicles
- 05+ vehicles
90.3% of Montgomery County residents lived in the same house 1 years ago.
Out of people who lived in different houses, 38% lived in this county.
Out of people who lived in different counties, 83% lived in Mississippi.
| Montgomery County: | 90.3% |
| State average: | 88.9% |
Place of birth for U.S.-born residents:
- This state: 8,133
- Other state: 1,523
- Northeast: 24
- Midwest: 537
- South: 860
- West: 86


- 37.0%Electricity
- 30.6%Bottled, tank, or LP gas
- 27.0%Utility gas
- 4.7%Wood
- 0.7%No fuel used

- 48.4%Electricity
- 32.3%Utility gas
- 17.9%Bottled, tank, or LP gas
- 1.1%Fuel oil, kerosene, etc.
- 0.3%Other fuel
Private vs. public school enrollment:
| Here: | 7.8% |
| Mississippi: | 16.1% |
| Here: | 16.0% |
| Mississippi: | 14.6% |
| Here: | 13.2% |
| Mississippi: | 12.8% |


Montgomery County government finances - Expenditure in 2018:
- Charges - Other: $513,000
Other: $483,000
- Current Operations - Regular Highways: $1,911,000
Regular Highways: $1,880,000
Police Protection: $721,000
Police Protection: $709,000
Financial Administration: $654,000
Judicial and Legal Services: $654,000
Judicial and Legal Services: $644,000
Financial Administration: $644,000
Central Staff Services: $588,000
Central Staff Services: $578,000
General Public Buildings: $361,000
General Public Buildings: $356,000
Correctional Institutions: $244,000
Correctional Institutions: $240,000
Local Fire Protection: $197,000
Local Fire Protection: $194,000
General - Other: $107,000
General - Other: $105,000
Natural Resources - Other: $84,000
Natural Resources - Other: $83,000
Parks and Recreation: $70,000
Health - Other: $69,000
Parks and Recreation: $68,000
Health - Other: $67,000
Public Welfare - Other: $61,000
Public Welfare - Other: $60,000
- General - Interest on Debt: $63,000
Interest on Debt: $54,000
- Long Term Debt - Beginning Outstanding - Unspecified Public Purpose: $1,627,000
Outstanding Unspecified Public Purpose: $1,468,000
Beginning Outstanding - Unspecified Public Purpose: $1,309,000
Outstanding Unspecified Public Purpose: $1,150,000
Retired Unspecified Public Purpose: $159,000
Retired Unspecified Public Purpose: $159,000
- Miscellaneous - General Revenue - Other: $310,000
General Revenue - Other: $263,000
Fines and Forfeits: $223,000
Fines and Forfeits: $190,000
Interest Earnings: $12,000
Interest Earnings: $10,000
- Other Funds - Cash and Securities: $5,146,000
Cash and Securities: $4,994,000
- State Intergovernmental - Highways: $650,000
Highways: $632,000
General Local Government Support: $504,000
General Local Government Support: $490,000
Other: $212,000
Other: $206,000
- Tax - Property: $4,408,000
Property: $4,052,000
Other License: $199,000
Other License: $183,000
Montgomery County government finances - Revenue in 2018:
- Charges - Other: $513,000
Other: $483,000
- Current Operations - Regular Highways: $1,911,000
Regular Highways: $1,880,000
Police Protection: $721,000
Police Protection: $709,000
Financial Administration: $654,000
Judicial and Legal Services: $654,000
Judicial and Legal Services: $644,000
Financial Administration: $644,000
Central Staff Services: $588,000
Central Staff Services: $578,000
General Public Buildings: $361,000
General Public Buildings: $356,000
Correctional Institutions: $244,000
Correctional Institutions: $240,000
Local Fire Protection: $197,000
Local Fire Protection: $194,000
General - Other: $107,000
General - Other: $105,000
Natural Resources - Other: $84,000
Natural Resources - Other: $83,000
Parks and Recreation: $70,000
Health - Other: $69,000
Parks and Recreation: $68,000
Health - Other: $67,000
Public Welfare - Other: $61,000
Public Welfare - Other: $60,000
- General - Interest on Debt: $63,000
Interest on Debt: $54,000
- Long Term Debt - Beginning Outstanding - Unspecified Public Purpose: $1,627,000
Outstanding Unspecified Public Purpose: $1,468,000
Beginning Outstanding - Unspecified Public Purpose: $1,309,000
Outstanding Unspecified Public Purpose: $1,150,000
Retired Unspecified Public Purpose: $159,000
Retired Unspecified Public Purpose: $159,000
- Miscellaneous - General Revenue - Other: $310,000
General Revenue - Other: $263,000
Fines and Forfeits: $223,000
Fines and Forfeits: $190,000
Interest Earnings: $12,000
Interest Earnings: $10,000
- Other Funds - Cash and Securities: $5,146,000
Cash and Securities: $4,994,000
- State Intergovernmental - Highways: $650,000
Highways: $632,000
General Local Government Support: $504,000
General Local Government Support: $490,000
Other: $212,000
Other: $206,000
- Tax - Property: $4,408,000
Property: $4,052,000
Other License: $199,000
Other License: $183,000
Montgomery County government finances - Debt in 2018:
- Charges - Other: $513,000
Other: $483,000
- Current Operations - Regular Highways: $1,911,000
Regular Highways: $1,880,000
Police Protection: $721,000
Police Protection: $709,000
Financial Administration: $654,000
Judicial and Legal Services: $654,000
Judicial and Legal Services: $644,000
Financial Administration: $644,000
Central Staff Services: $588,000
Central Staff Services: $578,000
General Public Buildings: $361,000
General Public Buildings: $356,000
Correctional Institutions: $244,000
Correctional Institutions: $240,000
Local Fire Protection: $197,000
Local Fire Protection: $194,000
General - Other: $107,000
General - Other: $105,000
Natural Resources - Other: $84,000
Natural Resources - Other: $83,000
Parks and Recreation: $70,000
Health - Other: $69,000
Parks and Recreation: $68,000
Health - Other: $67,000
Public Welfare - Other: $61,000
Public Welfare - Other: $60,000
- General - Interest on Debt: $63,000
Interest on Debt: $54,000
- Long Term Debt - Beginning Outstanding - Unspecified Public Purpose: $1,627,000
Outstanding Unspecified Public Purpose: $1,468,000
Beginning Outstanding - Unspecified Public Purpose: $1,309,000
Outstanding Unspecified Public Purpose: $1,150,000
Retired Unspecified Public Purpose: $159,000
Retired Unspecified Public Purpose: $159,000
- Miscellaneous - General Revenue - Other: $310,000
General Revenue - Other: $263,000
Fines and Forfeits: $223,000
Fines and Forfeits: $190,000
Interest Earnings: $12,000
Interest Earnings: $10,000
- Other Funds - Cash and Securities: $5,146,000
Cash and Securities: $4,994,000
- State Intergovernmental - Highways: $650,000
Highways: $632,000
General Local Government Support: $504,000
General Local Government Support: $490,000
Other: $212,000
Other: $206,000
- Tax - Property: $4,408,000
Property: $4,052,000
Other License: $199,000
Other License: $183,000
Montgomery County government finances - Cash and Securities in 2018:
- Charges - Other: $513,000
Other: $483,000
- Current Operations - Regular Highways: $1,911,000
Regular Highways: $1,880,000
Police Protection: $721,000
Police Protection: $709,000
Financial Administration: $654,000
Judicial and Legal Services: $654,000
Judicial and Legal Services: $644,000
Financial Administration: $644,000
Central Staff Services: $588,000
Central Staff Services: $578,000
General Public Buildings: $361,000
General Public Buildings: $356,000
Correctional Institutions: $244,000
Correctional Institutions: $240,000
Local Fire Protection: $197,000
Local Fire Protection: $194,000
General - Other: $107,000
General - Other: $105,000
Natural Resources - Other: $84,000
Natural Resources - Other: $83,000
Parks and Recreation: $70,000
Health - Other: $69,000
Parks and Recreation: $68,000
Health - Other: $67,000
Public Welfare - Other: $61,000
Public Welfare - Other: $60,000
- General - Interest on Debt: $63,000
Interest on Debt: $54,000
- Long Term Debt - Beginning Outstanding - Unspecified Public Purpose: $1,627,000
Outstanding Unspecified Public Purpose: $1,468,000
Beginning Outstanding - Unspecified Public Purpose: $1,309,000
Outstanding Unspecified Public Purpose: $1,150,000
Retired Unspecified Public Purpose: $159,000
Retired Unspecified Public Purpose: $159,000
- Miscellaneous - General Revenue - Other: $310,000
General Revenue - Other: $263,000
Fines and Forfeits: $223,000
Fines and Forfeits: $190,000
Interest Earnings: $12,000
Interest Earnings: $10,000
- Other Funds - Cash and Securities: $5,146,000
Cash and Securities: $4,994,000
- State Intergovernmental - Highways: $650,000
Highways: $632,000
General Local Government Support: $504,000
General Local Government Support: $490,000
Other: $212,000
Other: $206,000
- Tax - Property: $4,408,000
Property: $4,052,000
Other License: $199,000
Other License: $183,000
Supplemental Security Income (SSI) in 2006:
- Total number of recipients: 706
- Number of aged recipients: 110
- Number of blind and disabled recipients: 596
- Number of recipients under 18: 80
- Number of recipients between 18 and 64: 386
- Number of recipients older than 64: 240
- Number of recipients also receiving OASDI: 335
- Amount of payments (thousands of dollars): 279
| Most common first names in Montgomery County, MS among deceased individuals | ||
| Name | Count | Lived (average) |
|---|---|---|
| James | 167 | 70.7 years |
| Mary | 148 | 78.3 years |
| John | 125 | 76.7 years |
| William | 120 | 74.6 years |
| Willie | 84 | 75.1 years |
| Robert | 80 | 70.8 years |
| George | 65 | 76.9 years |
| Annie | 57 | 80.4 years |
| Mattie | 48 | 81.2 years |
| Henry | 47 | 74.9 years |
| Most common last names in Montgomery County, MS among deceased individuals | ||
| Last name | Count | Lived (average) |
|---|---|---|
| Jones | 64 | 75.7 years |
| Williams | 55 | 75.8 years |
| Bennett | 54 | 78.7 years |
| Johnson | 51 | 73.5 years |
| Moore | 50 | 79.2 years |
| Campbell | 48 | 73.8 years |
| Mitchell | 47 | 75.4 years |
| Brown | 44 | 73.6 years |
| Wilson | 41 | 79.5 years |
| Taylor | 38 | 80.1 years |
| Businesses in Montgomery County, MS | ||||
| Name | Count | Name | Count | |
|---|---|---|---|---|
| AutoZone | 1 | McDonald's | 1 | |
| Baskin-Robbins | 1 | SONIC Drive-In | 1 | |
| FedEx | 1 | Subway | 1 | |
| H&R Block | 1 | U-Haul | 1 | |
| Holiday Inn | 1 | UPS | 1 | |
| KFC | 1 | Waffle House | 1 | |
| Lane Furniture | 2 | Walmart | 1 | |