Marion County, Tennessee (TN)
County owner-occupied free and clear houses and condos in 2010: 3,943
County owner-occupied houses and condos in 2000: 8,890
Renter-occupied apartments: 2,650 (it was 2,147 in 2000)
| % of renters here: | 19% |
| State: | 32% |
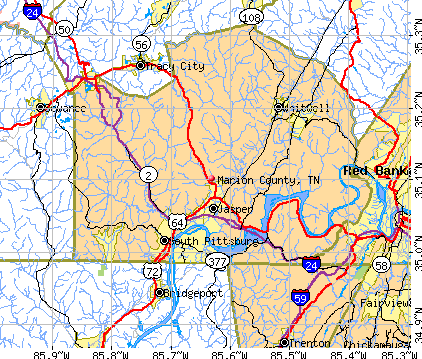
Land area: 498 sq. mi.
Water area: 14.0 sq. mi.
Population density: 59 people per square mile (average).
Industries providing employment: Manufacturing (19.5%), Educational, health and social services (16.5%), Construction (12.4%), Retail trade (11.3%).
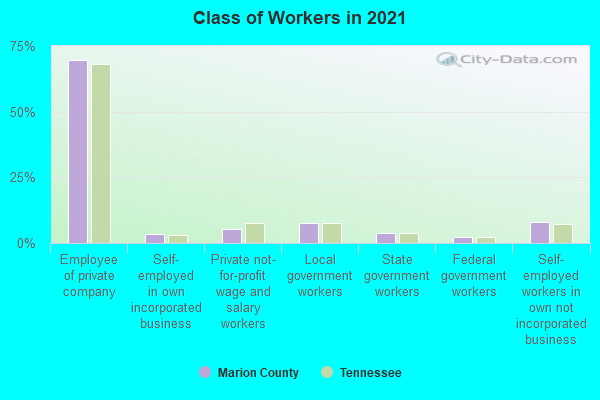
Type of workers:
- Private wage or salary: 78%
- Government: 13%
- Self-employed, not incorporated: 9%
- Unpaid family work: 0%
- OSM Map
- General Map
- Google Map
- MSN Map

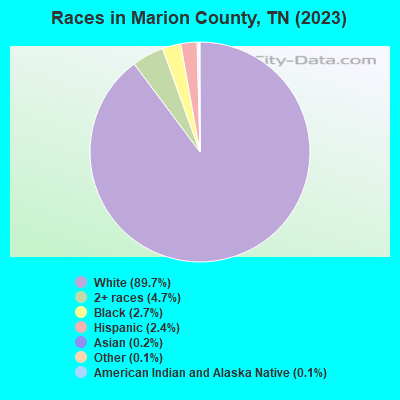
- 26,46089.8%White Non-Hispanic Alone
- 1,3524.6%Two or more races
- 8172.8%Black Non-Hispanic Alone
- 6532.2%Hispanic or Latino
- 1380.5%Asian alone
- 230.08%Some other race alone
- 170.06%American Indian and Alaska Native alone
| Median resident age: | 43.9 years |
| Tennessee median age: | 39.2 years |
| Males: 14,589 | |
| Females: 14,794 |

 | COVID-19 in Tennessee (237 replies) |
| East Tennessee Here We Come (26 replies) |
| Black Creek Mountain Neighborhood (2 replies) |
| Tennessee Population Estimates 2016 (28 replies) |
| Do I need permit to build a shed in Marion County TN? (1 reply) |
| Jasper Highlands (20 replies) |
| Marion County: | 2.0 people |
| Tennessee: | 2 people |
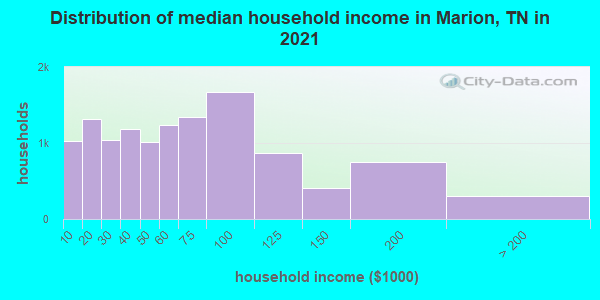
Estimated median household income in 2022: $59,245 ($31,419 in 1999)
| This county: | $59,245 |
| Tennessee: | $65,254 |
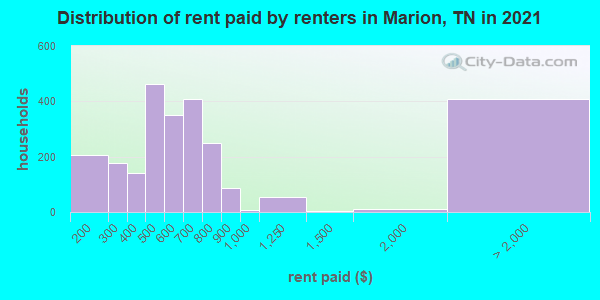
Median contract rent in 2022 for apartments: $579 (lower quartile is $440, upper quartile is $762)
| This county: | $579 |
| State: | $884 |
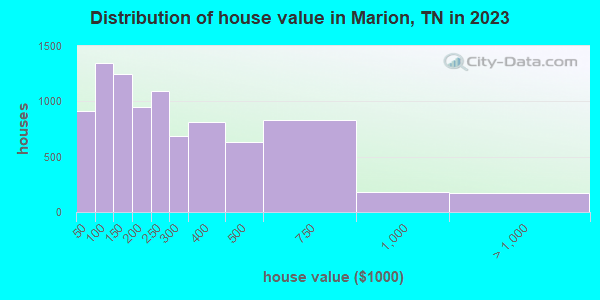
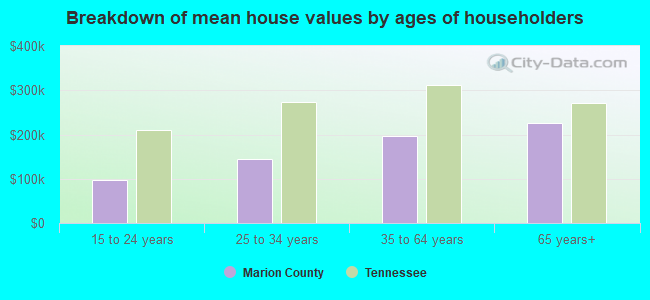
Estimated median house or condo value in 2022: $187,740 (it was $66,700 in 2000)
| Marion: | $187,740 |
| Tennessee: | $284,800 |
Mean price in 2022:
Median monthly housing costs for homes and condos with a mortgage: $1,226Detached houses: $285,258
Here: $285,258 State: $374,382 Townhouses or other attached units: $314,201
Here: $314,201 State: $354,101 Mobile homes: $80,632
Here: $80,632 State: $101,421
Median monthly housing costs for units without a mortgage: $361
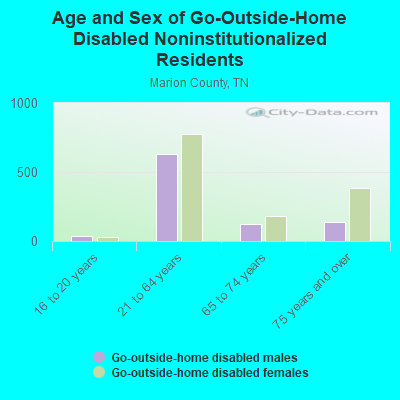
Institutionalized population: 200
Crime in 2021 (reported by the sheriff's office or county police, not the county total):
- Murders: 0
- Rapes: 1
- Robberies: 1
- Assaults: 45
- Burglaries: 24
- Thefts: 59
- Auto thefts: 31
Crime in 2020 (reported by the sheriff's office or county police, not the county total):
- Murders: 0
- Rapes: 2
- Robberies: 2
- Assaults: 79
- Burglaries: 38
- Thefts: 113
- Auto thefts: 69
Health of residents in Marion County based on CDC Behavioral Risk Factor Surveillance System Survey Questionnaires from 2013 to 2021:
General health status score of residents in this county from 1 (poor) to 5 (excellent) is 3.3. This is worse than average.66.0% of residents exercised in the past month. This is less than average.
45.5% of residents smoked 100+ cigarettes in their lives. This is about average.
41.2% of adult residents drank alcohol in the past 30 days. This is less than average.
66.6% of residents visited a dentist within the past year. This is less than average.
Average weight of males is 202 pounds. This is more than average.
Average weight of females is 166 pounds. This is more than average.
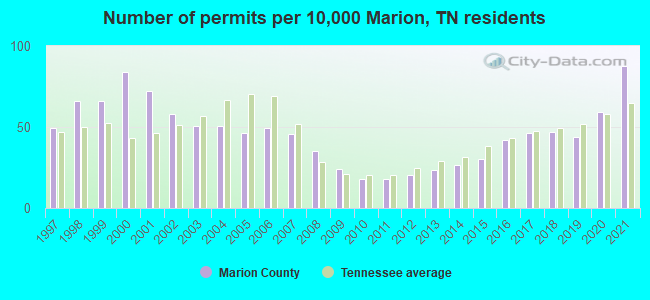
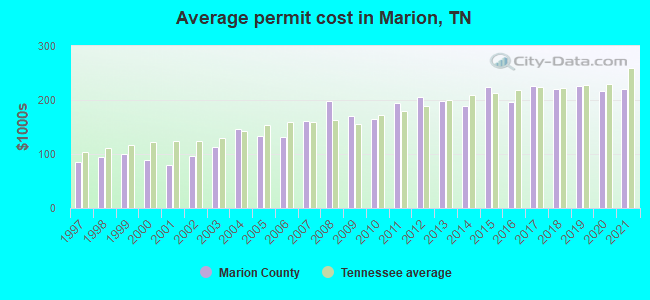
Single-family new house construction building permits:
- 2022: 258 buildings, average cost: $277,500
- 2021: 244 buildings, average cost: $220,400
- 2020: 165 buildings, average cost: $216,800
- 2019: 121 buildings, average cost: $225,200
- 2018: 131 buildings, average cost: $221,100
- 2017: 129 buildings, average cost: $224,700
- 2016: 117 buildings, average cost: $196,900
- 2015: 84 buildings, average cost: $224,200
- 2014: 74 buildings, average cost: $187,500
- 2013: 65 buildings, average cost: $199,300
- 2012: 57 buildings, average cost: $204,500
- 2011: 50 buildings, average cost: $194,100
- 2010: 49 buildings, average cost: $163,900
- 2009: 67 buildings, average cost: $171,300
- 2008: 98 buildings, average cost: $197,500
- 2007: 127 buildings, average cost: $160,600
- 2006: 138 buildings, average cost: $131,100
- 2005: 129 buildings, average cost: $132,700
- 2004: 140 buildings, average cost: $146,000
- 2003: 140 buildings, average cost: $113,200
- 2002: 161 buildings, average cost: $96,000
- 2001: 200 buildings, average cost: $79,500
- 2000: 233 buildings, average cost: $89,000
- 1999: 183 buildings, average cost: $100,100
- 1998: 183 buildings, average cost: $94,000
- 1997: 138 buildings, average cost: $84,600
Median real estate property taxes paid for housing units with mortgages in 2022: $812 (0.4%)
Median real estate property taxes paid for housing units with no mortgage in 2022: $624 (0.4%)
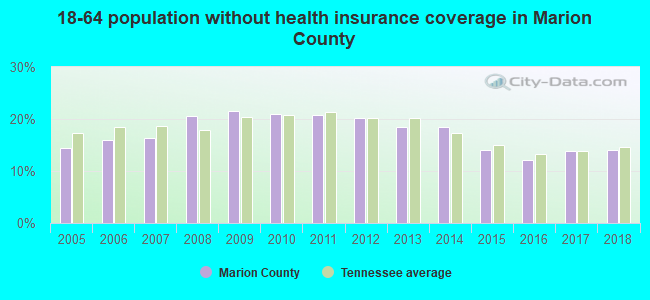
| Marion County: | 15.5% |
| Tennessee: | 13.3% |
Median age of residents in 2022: 43.9 years old
(Males: 42.5 years old, Females: 46.2 years old)
(Median age for: White residents: 44.9 years old, Black residents: 49.3 years old, American Indian residents: 49.4 years old, Asian residents: 54.3 years old, Hispanic or Latino residents: 30.1 years old, Other race residents: 30.2 years old)
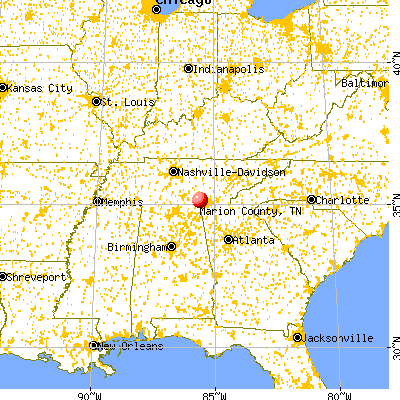
Area name: Chattanooga, TN-GA MSA
Fair market rent in 2006 for a 1-bedroom apartment in Marion County is $496 a month.
Fair market rent for a 2-bedroom apartment is $584 a month.
Fair market rent for a 3-bedroom apartment is $719 a month.
Cities in this county include: South Pittsburg, Jasper, Whitwell, Whiteside, Kimball, Powells Crossroads, Monteagle, New Hope, Orme.
Neighboring counties: De Baca County, New Mexico  , Beaufort County, North Carolina
  , Greer County, Oklahoma , Hardeman County , Childress County, Texas , Santa Barbara County, California , Pottawatomie County, Oklahoma .
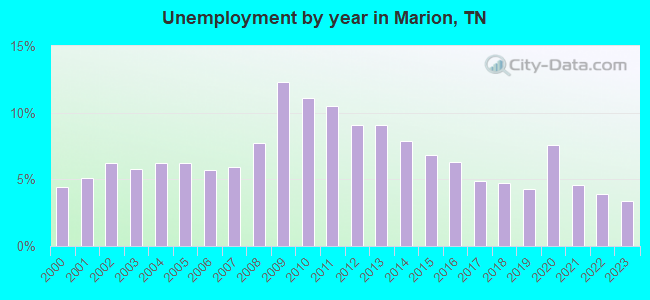
| Here: | 3.6% |
| Tennessee: | 3.0% |
Current college students: 763
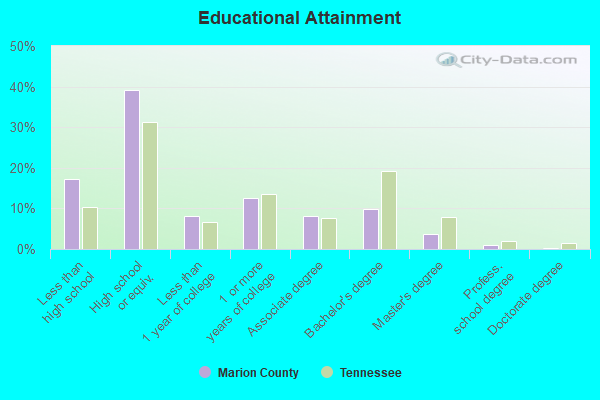
People 25 years of age or older with a high school degree or higher: 80.8%
People 25 years of age or older with a bachelor's degree or higher: 15.1%
Number of foreign born residents: 289 (50.1% naturalized citizens)
| Marion County: | 1.0% |
| Whole state: | 5.6% |
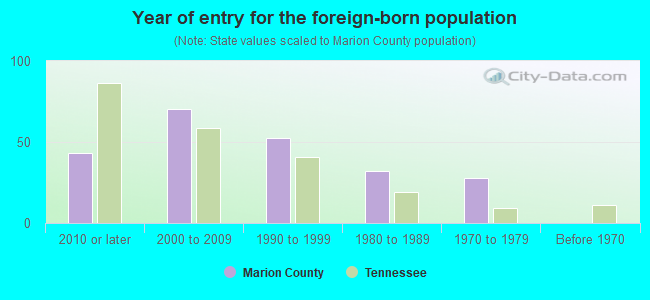
- Year of entry for the foreign-born population
- 582010 or later
- 942000 to 2009
- 651990 to 1999
- 321980 to 1989
- 281970 to 1979
- 0Before 1970
Mean travel time to work (commute): minutes
Percentage of county residents living and working in this county: 94.4%

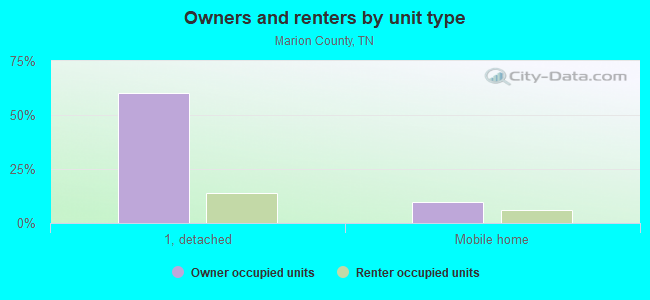
Housing units in structures:
- One, detached: 10,361
- One, attached: 134
- Two: 214
- 3 or 4: 184
- 5 to 9: 59
- 10 to 19: 111
- 20 or more: 53
- Mobile homes: 2,798
- Boats, RVs, vans, etc.: 43
Housing units in Marion County with a mortgage: 4,616 (392 second mortgage, 13 home equity loan, 243 both second mortgage and home equity loan)
Houses without a mortgage: 62
| Here: | 6.1% with mortgage |
| State: | 97.8% with mortgage |
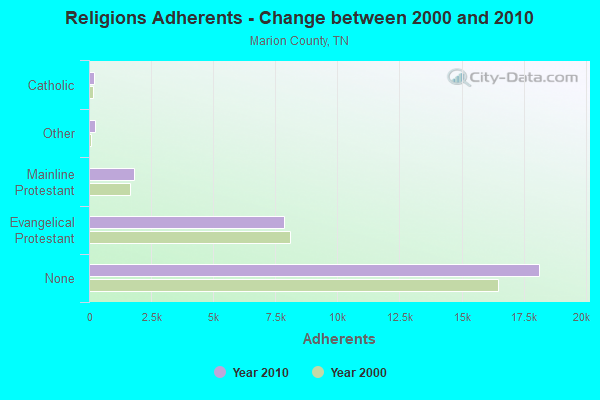
Religion statistics for Marion County
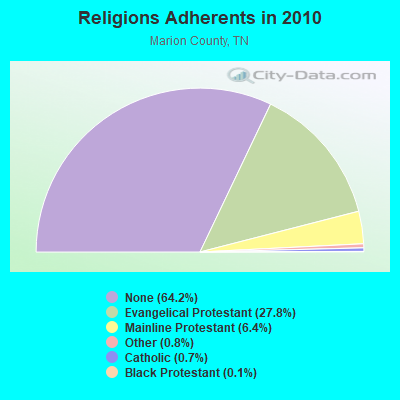
| Religion | Adherents | Congregations |
|---|---|---|
| Evangelical Protestant | 7,840 | 55 |
| Mainline Protestant | 1,803 | 15 |
| Other | 229 | 2 |
| Catholic | 200 | 2 |
| Black Protestant | 30 | 1 |
| None | 18,135 | - |
Source: Clifford Grammich, Kirk Hadaway, Richard Houseal, Dale E.Jones, Alexei Krindatch, Richie Stanley and Richard H.Taylor. 2012. 2010 U.S.Religion Census: Religious Congregations & Membership Study. Association of Statisticians of American Religious Bodies. Jones, Dale E., et al. 2002. Congregations and Membership in the United States 2000. Nashville, TN: Glenmary Research Center.
Food Environment Statistics:
| Marion County: | 1.78 / 10,000 pop. |
| State: | 1.99 / 10,000 pop. |
| Here: | 0.36 / 10,000 pop. |
| Tennessee: | 0.17 / 10,000 pop. |
| This county: | 1.42 / 10,000 pop. |
| Tennessee: | 0.65 / 10,000 pop. |
| Marion County: | 8.18 / 10,000 pop. |
| Tennessee: | 5.16 / 10,000 pop. |
| This county: | 8.18 / 10,000 pop. |
| State: | 6.56 / 10,000 pop. |
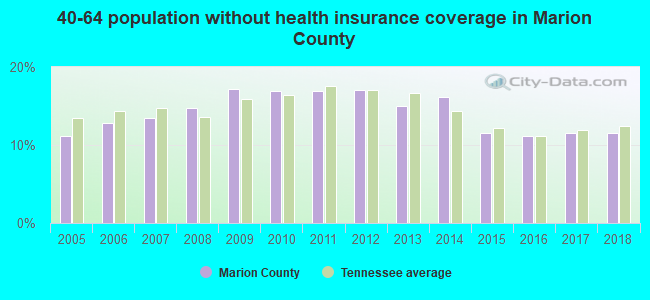
| Marion County: | 12.3% |
| Tennessee: | 11.4% |
| Marion County: | 30.9% |
| State: | 30.2% |
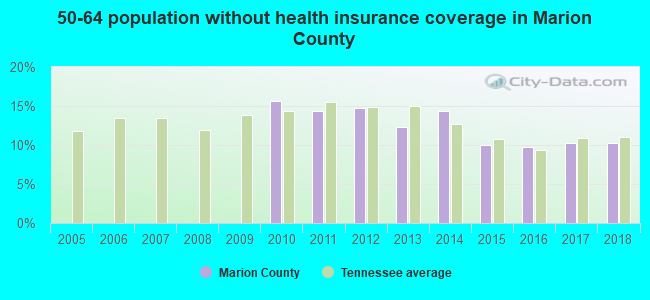
| Here: | 10.1% |
| State: | 13.5% |
Agriculture in Marion County:
Average size of farms: 171 acresAverage value of agricultural products sold per farm: $48,509
Average value of crops sold per acre for harvested cropland: $100.27
The value of nursery, greenhouse, floriculture, and sod as a percentage of the total market value of agricultural products sold: 0.57%
The value of livestock, poultry, and their products as a percentage of the total market value of agricultural products sold: 88.94%
Average total farm production expenses per farm: $48,537
Harvested cropland as a percentage of land in farms: 31.31%
Average market value of all machinery and equipment per farm: $49,964
The percentage of farms operated by a family or individual: 95.30%
Average age of principal farm operators: 56 years
Average number of cattle and calves per 100 acres of all land in farms: 19.57
Corn for grain: 2117 harvested acres
All wheat for grain: 791 harvested acres
Soybeans for beans: 4824 harvested acres
Vegetables: 13 harvested acres
Land in orchards: 28 acres
Earthquake activity:
Marion County-area historical earthquake activity is significantly above Tennessee state average. It is 130% greater than the overall U.S. average.On 4/29/2003 at 08:59:39, a magnitude 4.9 (4.4 MB, 4.6 MW, 4.9 LG, Class: Light, Intensity: IV - V) earthquake occurred 42.0 miles away from Marion County center
On 4/29/2003 at 08:59:39, a magnitude 4.6 (4.6 MW, Depth: 12.3 mi) earthquake occurred 42.0 miles away from the county center
On 11/30/1973 at 07:48:41, a magnitude 4.7 (4.7 MB, 4.6 ML) earthquake occurred 105.8 miles away from the county center
On 4/18/2008 at 09:36:59, a magnitude 5.4 (5.1 MB, 4.8 MS, 5.4 MW, 5.2 MW, Class: Moderate, Intensity: VI - VII) earthquake occurred 263.2 miles away from the county center
On 12/12/2018 at 09:14:43, a magnitude 4.4 (4.4 MW, Depth: 4.9 mi) earthquake occurred 61.9 miles away from Marion County center
On 1/18/1999 at 07:00:53, a magnitude 4.8 (4.8 MB, 4.0 LG, Depth: 0.6 mi) earthquake occurred 149.6 miles away from the county center
Magnitude types: regional Lg-wave magnitude (LG), body-wave magnitude (MB), local magnitude (ML), surface-wave magnitude (MS), moment magnitude (MW)
Most recent natural disasters:
- Tennessee Severe Storms, Tornadoes, Straight-line Winds, And Flooding, Incident Period: April 12, 2020 - April 13, 2020, FEMA Id: 4541, Natural disaster type: Storm, Tornado, Flood, Wind
- Tennessee Covid-19 Pandemic, Incident Period: January 20, 2020, FEMA Id: 4514, Natural disaster type: Other
- Tennessee Severe Storms, Flooding, Landslides, And Mudslides, Incident Period: February 19, 2019 - March 30, 2019, FEMA Id: 4427, Natural disaster type: Storm, Mudslide, Landslide, Flood
- Tennessee Severe Storms, Tornadoes, Straight-line Winds, and Flooding, Incident Period: June 05, 2014 to June 10, 2014, Major Disaster (Presidential) Declared DR-4189: August 13, 2014, FEMA Id: 4189, Natural disaster type: Storm, Tornado, Flood, Wind
- Tennessee Severe Storms, Straight-line Winds, Tornadoes, and Flooding, Incident Period: June 18, 2011 to June 24, 2011, Major Disaster (Presidential) Declared DR-4005: July 20, 2011, FEMA Id: 4005, Natural disaster type: Storm, Tornado, Flood, Wind
- Tennessee Severe Storms, Tornadoes, Straight-line Winds, and Associated Flooding, Incident Period: April 25, 2011 to April 28, 2011, Major Disaster (Presidential) Declared DR-1974: May 01, 2011, FEMA Id: 1974, Natural disaster type: Storm, Tornado, Flood, Wind
- Tennessee Hurricane Katrina Evacuation, Incident Period: August 29, 2005 to October 01, 2005, Emergency Declared EM-3217: September 05, 2005, FEMA Id: 3217, Natural disaster type: Hurricane
- Tennessee Severe Storms, Tornadoes and Flooding, Incident Period: May 04, 2003 to May 30, 2003, Major Disaster (Presidential) Declared DR-1464: May 08, 2003, FEMA Id: 1464, Natural disaster type: Storm, Tornado, Flood
- Tennessee Severe Storms and Flooding, Incident Period: February 14, 2003 to February 26, 2003, Major Disaster (Presidential) Declared DR-1456: March 20, 2003, FEMA Id: 1456, Natural disaster type: Storm, Flood
- Tennessee Chattanooga Complex Fire, Incident Period: November 03, 2001, Fire Management Assistance Declared: November 03, 2001, FEMA Id: 2387, Natural disaster type: Fire
- 9 other natural disasters have been reported since 1953.
The number of natural disasters in Marion County (19) is greater than the US average (15).
Major Disasters (Presidential) Declared: 12
Emergencies Declared: 2
Causes of natural disasters: Floods: 11, Storms: 10, Tornadoes: 6, Winds: 4, Fires: 2, Heavy Rains: 2, Winter Storms: 2, Flash Flood: 1, Hurricane: 1, Landslide: 1, Mudslide: 1, Snowfall: 1, Other: 1 (Note: some incidents may be assigned to more than one category).
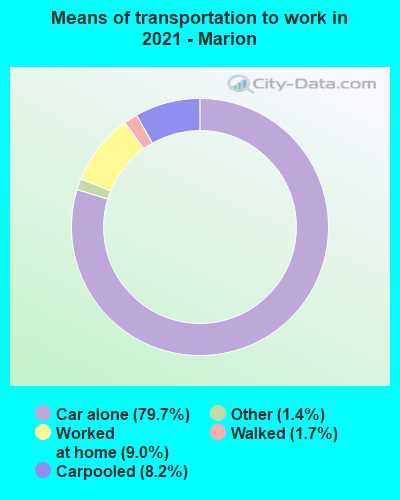
Means of transportation to work:
- Drove a car alone: 7,059 (74.1%)
- Carpooled: 806 (8.5%)
- Taxicab, motorcycle, or other means: 177 (1.9%)
- Bicycle: 20 (0.2%)
- Walked: 116 (1.2%)
- Worked at home: 1,411 (14.8%)

- Health care and social assistance (18%)
- Retail trade (10%)
- Finance and insurance (8%)
- Manufacturing (7%)
- Educational services (7%)
- Accommodation and food services (6%)
- Public administration (4%)
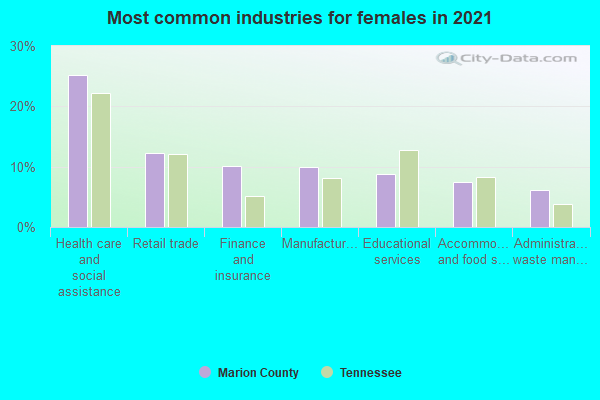
- Health care and social assistance (24%)
- Retail trade (14%)
- Finance and insurance (10%)
- Manufacturing (9%)
- Educational services (9%)
- Accommodation and food services (8%)
- Public administration (5%)

- Production occupations (18%)
- Construction and extraction occupations (14%)
- Management occupations (12%)
- Transportation occupations (9%)
- Installation, maintenance, and repair occupations (9%)
- Material moving occupations (7%)
- Sales and related occupations (6%)
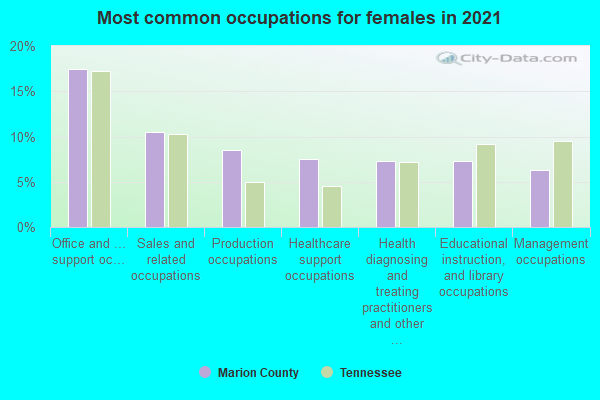
- Office and administrative support occupations (15%)
- Sales and related occupations (12%)
- Food preparation and serving related occupations (9%)
- Health diagnosing and treating practitioners and other technical occupations (9%)
- Production occupations (9%)
- Healthcare support occupations (6%)
- Educational instruction, and library occupations (6%)
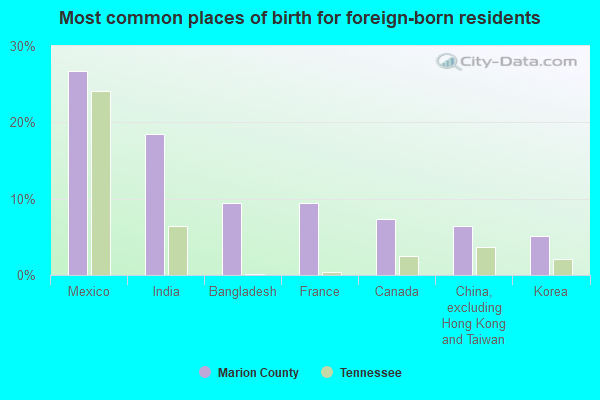
- Mexico (34%)
- Bangladesh (13%)
- India (10%)
- Korea (9%)
- France (6%)
- Canada (5%)
- China, excluding Hong Kong and Taiwan (5%)
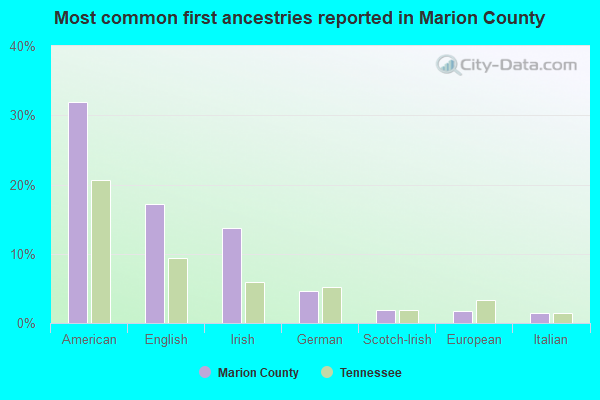
- American (37%)
- English (17%)
- Irish (11%)
- German (5%)
- Italian (2%)
- Scotch-Irish (2%)
- European (2%)
People in group quarters in Marion County, Tennessee in 2010:
- 133 people in nursing facilities/skilled-nursing facilities
- 67 people in local jails and other municipal confinement facilities
- 39 people in workers' group living quarters and job corps centers
- 9 people in group homes intended for adults
- 2 people in other noninstitutional facilities
People in group quarters in Marion County, Tennessee in 2000:
- 150 people in nursing homes
- 74 people in local jails and other confinement facilities (including police lockups)
- 25 people in other noninstitutional group quarters
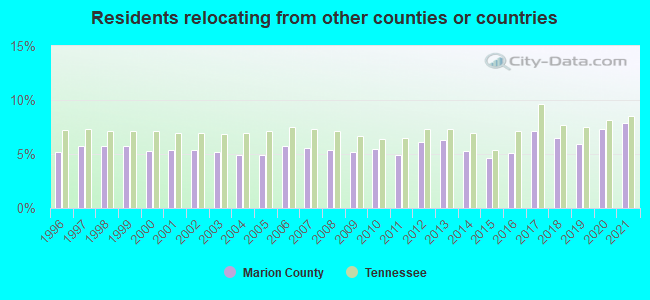
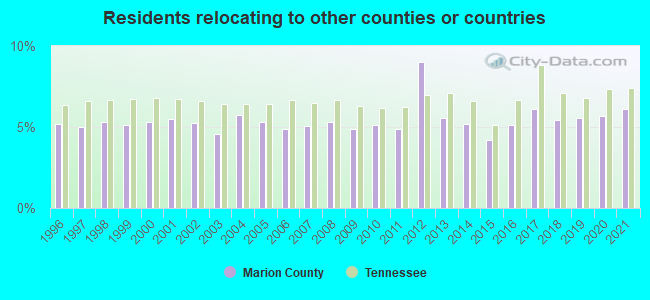
7.83% of this county's 2021 resident taxpayers lived in other counties in 2020 ($68,867 average adjusted gross income)
| Here: | 7.83% |
| Tennessee average: | 8.49% |
10 or fewer of this county's residents moved from foreign countries.
3.84% relocated from other counties in Tennessee ($26,229 average AGI)
4.00% relocated from other states ($42,636 average AGI)
Marion County: 4.00% Tennessee average: 4.34%
Top counties from which taxpayers relocated into this county between 2020 and 2021:
| from Hamilton County, TN | |
| from Sequatchie County, TN | |
| from Jackson County, AL | |
| from Grundy County, TN | |
| from Franklin County, TN | |
| from Davidson County, TN | |
| from Dade County, GA |
6.14% of this county's 2020 resident taxpayers moved to other counties in 2021 ($47,979 average adjusted gross income)
| Here: | 6.14% |
| Tennessee average: | 7.40% |
10 or fewer of this county's residents moved to foreign countries.
3.55% relocated to other counties in Tennessee ($26,350 average AGI)
2.59% relocated to other states ($21,629 average AGI)
Marion County: 2.59% Tennessee average: 3.20%
Top counties to which taxpayers relocated from this county between 2020 and 2021:
| to Hamilton County, TN | |
| to Jackson County, AL | |
| to Grundy County, TN | |
| to Sequatchie County, TN |
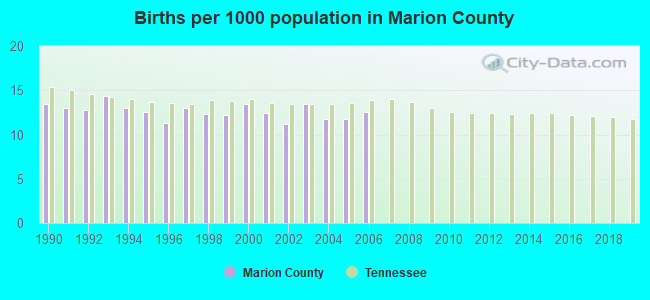
Births per 1000 population from 1990 to 1999: 12.8
Births per 1000 population from 2000 to 2006: 12.3
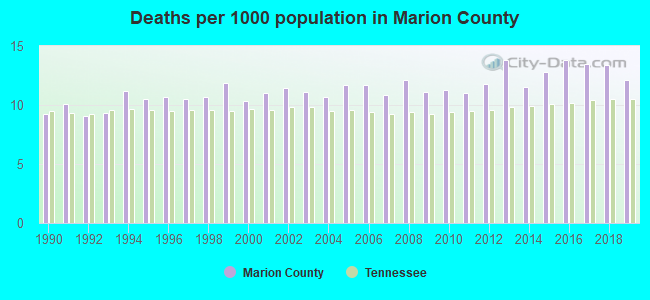
Deaths per 1000 population from 1990 to 1999: 10.3
Deaths per 1000 population from 2000 to 2009: 11.2
Deaths per 1000 population from 2010 to 2020: 12.7
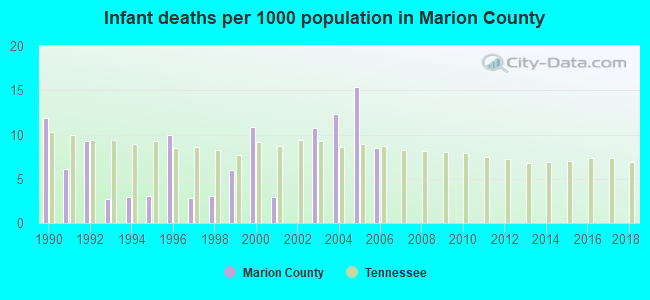
Infant deaths per 1000 live births from 1990 to 1999: 5.8
Infant deaths per 1000 live births from 2000 to 2006: 8.7
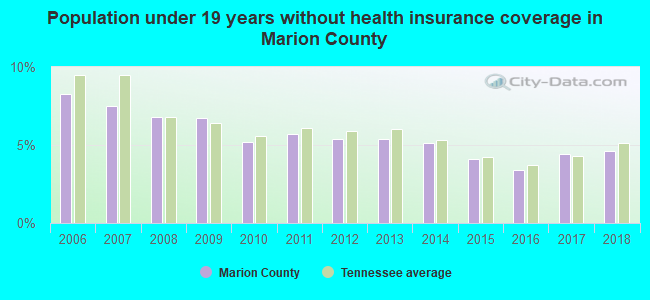
Persons under 19 years old without health insurance coverage in 2018: 4.6%

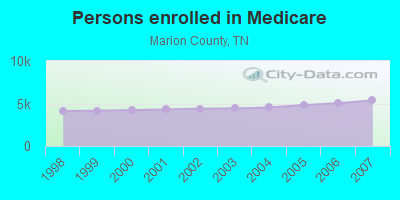
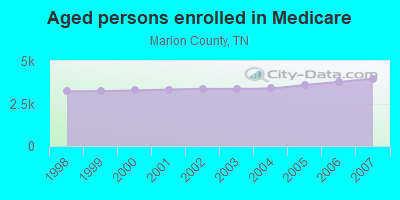
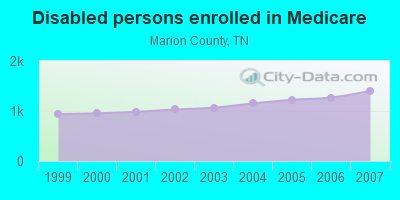
Persons enrolled in hospital insurance and/or supplemental medical insurance (Medicare) in July 1, 2007: 5,361 (3,959 aged, 1,402 disabled)
Children under 18 without health insurance coverage in 2007: 549 (8%)
Most common underlying causes of death in Marion County, Tennessee in 1999 - 2019:
- Atherosclerotic heart disease (540)
- Bronchus or lung, unspecified - Malignant neoplasms (527)
- Acute myocardial infarction, unspecified (521)
- Chronic obstructive pulmonary disease, unspecified (407)
- Alzheimer disease, unspecified (273)
- Stroke, not specified as haemorrhage or infarction (170)
- Unspecified dementia (65)
- Unspecified diabetes mellitus, without complications (40)
- Colon, unspecified - Malignant neoplasms (21)
- Pneumonia, unspecified (13)
Population without health insurance coverage in 2000: 11%
Children under 18 without health insurance coverage in 2000: 5%
Short term general hospital admissions per 100,000 population in 2004: 8,275
Short term general hospital beds per 100,000 population in 2004: 246
Emergency room visits per 100,000 population in 2004: 68,081
General practice office based MDs per 100,000 population in 2005: 1,138
Medical specialist MDs per 100,000 population in 2005: 1,182
Dentists per 100,000 population in 1998: 4
Total births per 100,000 population, July 2005 - July 2006 : 15
Total deaths per 100,000 population, July 2005 - July 2006: 72
Limited-service eating places per 100,000 population in 2005 : 7
Crimes per 100,000 population in 1996: 1
Household type by relationship:
Households: 29,383- Male householders: 6,391 (1,634 living alone), Female householders: 5,873 (1,409 living alone)
6,093 spouses (6,066 opposite-sex spouses), 1,277 unmarried partners, (1,227 opposite-sex unmarried partners), 7,089 children (6,292 natural, 147 adopted, 629 stepchildren), 916 grandchildren, 184 brothers or sisters, 248 parents, 40 foster children, 506 other relatives, 683 non-relatives
- In group quarters: 222
Size of family households: 3,871 2-persons, 2,061 3-persons, 1,447 4-persons, 747 5-persons, 270 6-persons, 40 7-or-more-persons.
Size of nonfamily households: 3,034 1-person, 639 2-persons, 87 3-persons, 77 4-persons.
3,367 married couples with children.
1,531 single-parent households (572 men, 959 women).
98.6% of residents of Marion speak English at home.
1.0% of residents speak Spanish at home (76% speak English very well, 14% speak English well, 7% speak English not well, 3% don't speak English at all).
0.1% of residents speak other Indo-European language at home (64% speak English very well, 28% speak English well, 8% speak English not well).
0.1% of residents speak Asian or Pacific Island language at home (36% speak English very well, 7% speak English well, 57% speak English not well).
In fiscal year 2004:
Federal Government expenditure: $179,381,000 ($6,485 per capita)
Department of Defense expenditure: $4,034,000
Federal direct payments to individuals for retirement and disability: $73,988,000
Federal other direct payments to individuals: $47,425,000
Federal direct payments not to individuals: $613,000
Federal grants: $51,459,000
Federal procurement contracts: $1,181,000 ($281,000 Department of Defense)
Federal salaries and wages: $4,715,000 ($586,000 Department of Defense)
Federal Government direct loans: $647,000
Federal guaranteed/insured loans: $4,704,000
Federal Government insurance: $23,003,000
Population change from April 1, 2000 to July 1, 2005:
Births: 1,841| Here: | 66 per 1000 residents |
| State: | 69 per 1000 residents |
Deaths: 1,613
| Here: | 58 per 1000 residents |
| State: | 50 per 1000 residents |
Net international migration: +43
| Here: | +2 per 1000 residents |
| State: | +8 per 1000 residents |
Net internal migration: -243
| Here: | |
| State: |
Total withdrawal of fresh water for public supply: 3.52 millions of gallons per day (22% from ground, 78% from surface)
| Here: | 6.0 |
| State: | 6.5 |
| Here: | 4.8 |
| State: | 4.4 |

- Year house built in Marion County, Tennessee
- 502020 or later
- 1,4112010 to 2019
- 2,3042000 to 2009
- 2,0831990 to 1999
- 2,7041980 to 1989
- 2,3321970 to 1979
- 1,1901960 to 1969
- 7081950 to 1959
- 2781940 to 1949
- 7011939 or earlier
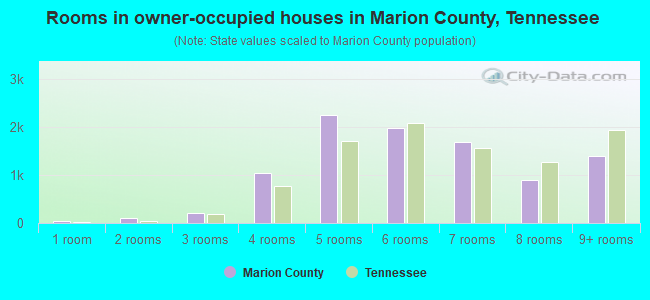
- Rooms in owner-occupied houses in Marion County, Tennessee
- 331 room
- 502 rooms
- 2023 rooms
- 1,0844 rooms
- 2,3495 rooms
- 2,0206 rooms
- 1,6217 rooms
- 7498 rooms
- 1,4499+ rooms

- Rooms in renter-occupied apartments in Marion County, Tennessee
- 431 room
- 712 rooms
- 4493 rooms
- 5184 rooms
- 6505 rooms
- 6036 rooms
- 2117 rooms
- 818 rooms
- 649+ rooms
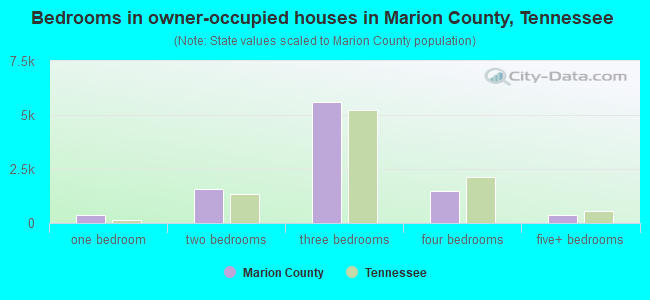
- Bedrooms in owner-occupied houses in Marion County, Tennessee
- 40no bedroom
- 3171 bedroom
- 1,5942 bedrooms
- 5,6403 bedrooms
- 1,5564 bedrooms
- 3945+ bedrooms

- Bedrooms in renter-occupied apartments in Marion County, Tennessee
- 44no bedroom
- 3751 bedroom
- 1,0092 bedrooms
- 9313 bedrooms
- 3254 bedrooms
- 275+ bedrooms

- Cars and other vehicles available in Marion County in owner-occupied houses/condos
- 240no vehicle
- 1,9341 vehicle
- 3,5132 vehicles
- 2,3233 vehicles
- 8674 vehicles
- 6755+ vehicles
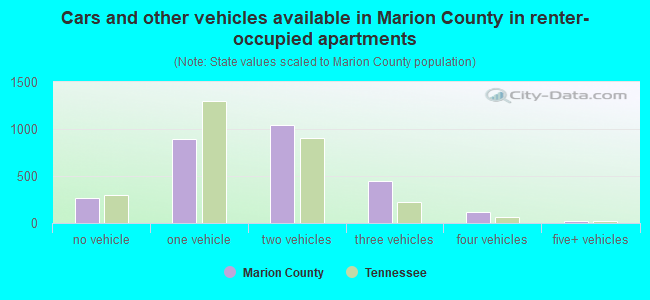
- Cars and other vehicles available in Marion County in renter-occupied apartments
- 288no vehicle
- 8621 vehicle
- 1,0112 vehicles
- 4433 vehicles
- 884 vehicles
- 275+ vehicles
89.9% of Marion County residents lived in the same house 1 years ago.
Out of people who lived in different houses, 28% lived in this county.
Out of people who lived in different counties, 76% lived in Tennessee.
| Marion County: | 89.9% |
| State average: | 87.0% |
Place of birth for U.S.-born residents:
- This state: 20,040
- Other state: 8,782
- Northeast: 786
- Midwest: 1,699
- South: 5,501
- West: 773
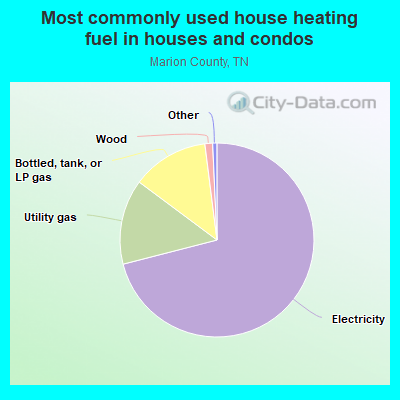
- 70.5%Electricity
- 14.5%Utility gas
- 12.7%Bottled, tank, or LP gas
- 1.5%Wood
- 0.3%Other fuel
- 0.3%No fuel used
- 0.1%Fuel oil, kerosene, etc.
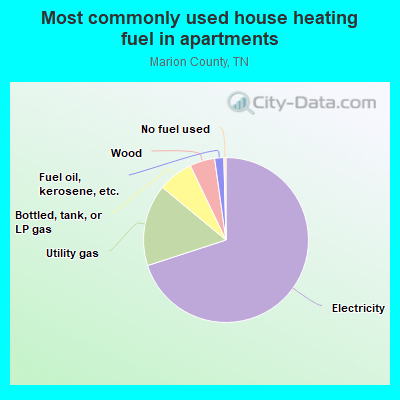
- 69.8%Electricity
- 14.1%Utility gas
- 7.1%Bottled, tank, or LP gas
- 5.9%Wood
- 2.0%Fuel oil, kerosene, etc.
- 1.1%No fuel used
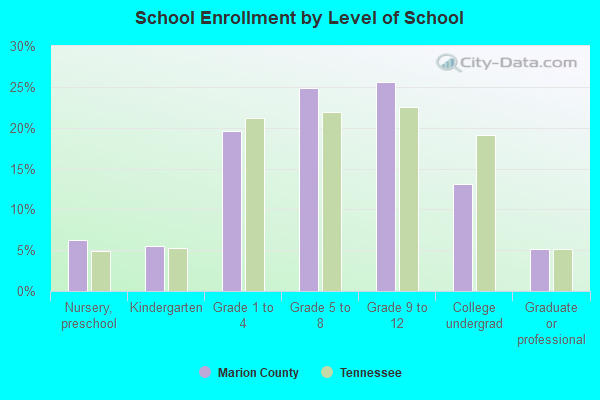
Private vs. public school enrollment:
| Here: | 12.2% |
| Tennessee: | 15.0% |
| Here: | 8.7% |
| Tennessee: | 16.2% |
| Here: | 11.1% |
| Tennessee: | 23.5% |
Marion County government finances - Expenditure in 2017:
- Bond Funds - Cash and Securities: $8,430,000
Cash and Securities: $904,000
- Charges - Elementary and Secondary Education - Other: $2,658,000
Elementary and Secondary Education - Other: $2,014,000
Other: $1,835,000
Other: $670,000
Elementary and Secondary Education School Lunch: $232,000
Elementary and Secondary Education School Lunch: $171,000
Regular Highways: $152,000
Regular Highways: $68,000
Air Transportation: $60,000
Air Transportation: $59,000
Solid Waste Management: $28,000
Solid Waste Management: $23,000
- Construction - Health - Other: $620,000
Elementary and Secondary Education: $226,000
Air Transportation: $126,000
General Public Buildings: $88,000
Elementary and Secondary Education: $77,000
General - Other: $25,000
Solid Waste Management: $14,000
- Current Operations - Elementary and Secondary Education: $36,543,000
Elementary and Secondary Education: $35,984,000
Police Protection: $3,163,000
Police Protection: $2,595,000
Regular Highways: $2,465,000
Regular Highways: $1,792,000
Correctional Institutions: $1,530,000
Correctional Institutions: $1,419,000
General - Other: $1,411,000
Judicial and Legal Services: $1,250,000
Judicial and Legal Services: $1,150,000
Financial Administration: $988,000
Central Staff Services: $958,000
General Public Buildings: $926,000
Air Transportation: $919,000
General Public Buildings: $855,000
Central Staff Services: $840,000
General - Other: $737,000
Financial Administration: $724,000
Solid Waste Management: $680,000
Solid Waste Management: $680,000
Health - Other: $558,000
Health - Other: $520,000
Local Fire Protection: $249,000
Local Fire Protection: $220,000
Air Transportation: $206,000
Libraries: $170,000
Libraries: $151,000
Natural Resources - Other: $103,000
Natural Resources - Other: $103,000
Parks and Recreation: $81,000
Parks and Recreation: $28,000
Corrections - Other: $21,000
Public Welfare - Other: $17,000
- Federal Intergovernmental - General Local Government Support: $195,000
General Local Government Support: $33,000
- General - Interest on Debt: $2,170,000
Interest on Debt: $1,299,000
- Intergovernmental to Local - Other - Elementary and Secondary Education: $21,000
- Local Intergovernmental - Other: $1,177,000
General Local Government Support: $947,000
General Local Government Support: $810,000
Other: $313,000
Education: $236,000
Education: $16,000
- Long Term Debt - Beginning Outstanding - Unspecified Public Purpose: $32,492,000
Outstanding Unspecified Public Purpose: $30,082,000
Beginning Outstanding - Unspecified Public Purpose: $24,831,000
Retired Unspecified Public Purpose: $24,831,000
Retired Unspecified Public Purpose: $2,410,000
- Miscellaneous - General Revenue - Other: $588,000
Interest Earnings: $381,000
Rents: $254,000
Fines and Forfeits: $188,000
General Revenue - Other: $155,000
Rents: $146,000
Sale of Property: $114,000
Interest Earnings: $104,000
Fines and Forfeits: $19,000
Donations From Private Sources: $9,000
Sale of Property: $4,000
Donations From Private Sources: $1,000
- Other Capital Outlay - Regular Highways: $1,361,000
Elementary and Secondary Education: $684,000
Elementary and Secondary Education: $465,000
Regular Highways: $457,000
Police Protection: $430,000
General Public Building: $17,000
General - Other: $12,000
Judicial and Legal Services: $8,000
Financial Administration: $3,000
Central Staff Services: $3,000
- Other Funds - Cash and Securities: $19,215,000
Cash and Securities: $15,622,000
- Sinking Funds - Cash and Securities: $13,188,000
Cash and Securities: $1,699,000
- State Intergovernmental - Education: $27,348,000
Education: $26,952,000
Highways: $4,390,000
Other: $1,115,000
Other: $862,000
General Local Government Support: $787,000
General Local Government Support: $596,000
Health and Hospitals: $281,000
Highways: $278,000
Health and Hospitals: $239,000
- Tax - Property: $15,422,000
Property: $9,636,000
General Sales and Gross Receipts: $6,819,000
Motor Vehicle License: $1,939,000
General Sales and Gross Receipts: $316,000
Other Selective Sales: $294,000
Occupation and Business License - Other: $283,000
Other License: $155,000
Public Utilities Sales: $129,000
Other License: $125,000
Public Utilities Sales: $120,000
Other Selective Sales: $115,000
Alcoholic Beverage Sales: $90,000
Alcoholic Beverage Sales: $14,000
Severance: $3,000
Alcoholic Beverage License: $2,000
- Total Salaries and Wages: $21,129,000
: $20,421,000
Marion County government finances - Revenue in 2017:
- Bond Funds - Cash and Securities: $8,430,000
Cash and Securities: $904,000
- Charges - Elementary and Secondary Education - Other: $2,658,000
Elementary and Secondary Education - Other: $2,014,000
Other: $1,835,000
Other: $670,000
Elementary and Secondary Education School Lunch: $232,000
Elementary and Secondary Education School Lunch: $171,000
Regular Highways: $152,000
Regular Highways: $68,000
Air Transportation: $60,000
Air Transportation: $59,000
Solid Waste Management: $28,000
Solid Waste Management: $23,000
- Construction - Health - Other: $620,000
Elementary and Secondary Education: $226,000
Air Transportation: $126,000
General Public Buildings: $88,000
Elementary and Secondary Education: $77,000
General - Other: $25,000
Solid Waste Management: $14,000
- Current Operations - Elementary and Secondary Education: $36,543,000
Elementary and Secondary Education: $35,984,000
Police Protection: $3,163,000
Police Protection: $2,595,000
Regular Highways: $2,465,000
Regular Highways: $1,792,000
Correctional Institutions: $1,530,000
Correctional Institutions: $1,419,000
General - Other: $1,411,000
Judicial and Legal Services: $1,250,000
Judicial and Legal Services: $1,150,000
Financial Administration: $988,000
Central Staff Services: $958,000
General Public Buildings: $926,000
Air Transportation: $919,000
General Public Buildings: $855,000
Central Staff Services: $840,000
General - Other: $737,000
Financial Administration: $724,000
Solid Waste Management: $680,000
Solid Waste Management: $680,000
Health - Other: $558,000
Health - Other: $520,000
Local Fire Protection: $249,000
Local Fire Protection: $220,000
Air Transportation: $206,000
Libraries: $170,000
Libraries: $151,000
Natural Resources - Other: $103,000
Natural Resources - Other: $103,000
Parks and Recreation: $81,000
Parks and Recreation: $28,000
Corrections - Other: $21,000
Public Welfare - Other: $17,000
- Federal Intergovernmental - General Local Government Support: $195,000
General Local Government Support: $33,000
- General - Interest on Debt: $2,170,000
Interest on Debt: $1,299,000
- Intergovernmental to Local - Other - Elementary and Secondary Education: $21,000
- Local Intergovernmental - Other: $1,177,000
General Local Government Support: $947,000
General Local Government Support: $810,000
Other: $313,000
Education: $236,000
Education: $16,000
- Long Term Debt - Beginning Outstanding - Unspecified Public Purpose: $32,492,000
Outstanding Unspecified Public Purpose: $30,082,000
Beginning Outstanding - Unspecified Public Purpose: $24,831,000
Retired Unspecified Public Purpose: $24,831,000
Retired Unspecified Public Purpose: $2,410,000
- Miscellaneous - General Revenue - Other: $588,000
Interest Earnings: $381,000
Rents: $254,000
Fines and Forfeits: $188,000
General Revenue - Other: $155,000
Rents: $146,000
Sale of Property: $114,000
Interest Earnings: $104,000
Fines and Forfeits: $19,000
Donations From Private Sources: $9,000
Sale of Property: $4,000
Donations From Private Sources: $1,000
- Other Capital Outlay - Regular Highways: $1,361,000
Elementary and Secondary Education: $684,000
Elementary and Secondary Education: $465,000
Regular Highways: $457,000
Police Protection: $430,000
General Public Building: $17,000
General - Other: $12,000
Judicial and Legal Services: $8,000
Financial Administration: $3,000
Central Staff Services: $3,000
- Other Funds - Cash and Securities: $19,215,000
Cash and Securities: $15,622,000
- Sinking Funds - Cash and Securities: $13,188,000
Cash and Securities: $1,699,000
- State Intergovernmental - Education: $27,348,000
Education: $26,952,000
Highways: $4,390,000
Other: $1,115,000
Other: $862,000
General Local Government Support: $787,000
General Local Government Support: $596,000
Health and Hospitals: $281,000
Highways: $278,000
Health and Hospitals: $239,000
- Tax - Property: $15,422,000
Property: $9,636,000
General Sales and Gross Receipts: $6,819,000
Motor Vehicle License: $1,939,000
General Sales and Gross Receipts: $316,000
Other Selective Sales: $294,000
Occupation and Business License - Other: $283,000
Other License: $155,000
Public Utilities Sales: $129,000
Other License: $125,000
Public Utilities Sales: $120,000
Other Selective Sales: $115,000
Alcoholic Beverage Sales: $90,000
Alcoholic Beverage Sales: $14,000
Severance: $3,000
Alcoholic Beverage License: $2,000
- Total Salaries and Wages: $21,129,000
: $20,421,000
Marion County government finances - Debt in 2017:
- Bond Funds - Cash and Securities: $8,430,000
Cash and Securities: $904,000
- Charges - Elementary and Secondary Education - Other: $2,658,000
Elementary and Secondary Education - Other: $2,014,000
Other: $1,835,000
Other: $670,000
Elementary and Secondary Education School Lunch: $232,000
Elementary and Secondary Education School Lunch: $171,000
Regular Highways: $152,000
Regular Highways: $68,000
Air Transportation: $60,000
Air Transportation: $59,000
Solid Waste Management: $28,000
Solid Waste Management: $23,000
- Construction - Health - Other: $620,000
Elementary and Secondary Education: $226,000
Air Transportation: $126,000
General Public Buildings: $88,000
Elementary and Secondary Education: $77,000
General - Other: $25,000
Solid Waste Management: $14,000
- Current Operations - Elementary and Secondary Education: $36,543,000
Elementary and Secondary Education: $35,984,000
Police Protection: $3,163,000
Police Protection: $2,595,000
Regular Highways: $2,465,000
Regular Highways: $1,792,000
Correctional Institutions: $1,530,000
Correctional Institutions: $1,419,000
General - Other: $1,411,000
Judicial and Legal Services: $1,250,000
Judicial and Legal Services: $1,150,000
Financial Administration: $988,000
Central Staff Services: $958,000
General Public Buildings: $926,000
Air Transportation: $919,000
General Public Buildings: $855,000
Central Staff Services: $840,000
General - Other: $737,000
Financial Administration: $724,000
Solid Waste Management: $680,000
Solid Waste Management: $680,000
Health - Other: $558,000
Health - Other: $520,000
Local Fire Protection: $249,000
Local Fire Protection: $220,000
Air Transportation: $206,000
Libraries: $170,000
Libraries: $151,000
Natural Resources - Other: $103,000
Natural Resources - Other: $103,000
Parks and Recreation: $81,000
Parks and Recreation: $28,000
Corrections - Other: $21,000
Public Welfare - Other: $17,000
- Federal Intergovernmental - General Local Government Support: $195,000
General Local Government Support: $33,000
- General - Interest on Debt: $2,170,000
Interest on Debt: $1,299,000
- Intergovernmental to Local - Other - Elementary and Secondary Education: $21,000
- Local Intergovernmental - Other: $1,177,000
General Local Government Support: $947,000
General Local Government Support: $810,000
Other: $313,000
Education: $236,000
Education: $16,000
- Long Term Debt - Beginning Outstanding - Unspecified Public Purpose: $32,492,000
Outstanding Unspecified Public Purpose: $30,082,000
Beginning Outstanding - Unspecified Public Purpose: $24,831,000
Retired Unspecified Public Purpose: $24,831,000
Retired Unspecified Public Purpose: $2,410,000
- Miscellaneous - General Revenue - Other: $588,000
Interest Earnings: $381,000
Rents: $254,000
Fines and Forfeits: $188,000
General Revenue - Other: $155,000
Rents: $146,000
Sale of Property: $114,000
Interest Earnings: $104,000
Fines and Forfeits: $19,000
Donations From Private Sources: $9,000
Sale of Property: $4,000
Donations From Private Sources: $1,000
- Other Capital Outlay - Regular Highways: $1,361,000
Elementary and Secondary Education: $684,000
Elementary and Secondary Education: $465,000
Regular Highways: $457,000
Police Protection: $430,000
General Public Building: $17,000
General - Other: $12,000
Judicial and Legal Services: $8,000
Financial Administration: $3,000
Central Staff Services: $3,000
- Other Funds - Cash and Securities: $19,215,000
Cash and Securities: $15,622,000
- Sinking Funds - Cash and Securities: $13,188,000
Cash and Securities: $1,699,000
- State Intergovernmental - Education: $27,348,000
Education: $26,952,000
Highways: $4,390,000
Other: $1,115,000
Other: $862,000
General Local Government Support: $787,000
General Local Government Support: $596,000
Health and Hospitals: $281,000
Highways: $278,000
Health and Hospitals: $239,000
- Tax - Property: $15,422,000
Property: $9,636,000
General Sales and Gross Receipts: $6,819,000
Motor Vehicle License: $1,939,000
General Sales and Gross Receipts: $316,000
Other Selective Sales: $294,000
Occupation and Business License - Other: $283,000
Other License: $155,000
Public Utilities Sales: $129,000
Other License: $125,000
Public Utilities Sales: $120,000
Other Selective Sales: $115,000
Alcoholic Beverage Sales: $90,000
Alcoholic Beverage Sales: $14,000
Severance: $3,000
Alcoholic Beverage License: $2,000
- Total Salaries and Wages: $21,129,000
: $20,421,000
Marion County government finances - Cash and Securities in 2017:
- Bond Funds - Cash and Securities: $8,430,000
Cash and Securities: $904,000
- Charges - Elementary and Secondary Education - Other: $2,658,000
Elementary and Secondary Education - Other: $2,014,000
Other: $1,835,000
Other: $670,000
Elementary and Secondary Education School Lunch: $232,000
Elementary and Secondary Education School Lunch: $171,000
Regular Highways: $152,000
Regular Highways: $68,000
Air Transportation: $60,000
Air Transportation: $59,000
Solid Waste Management: $28,000
Solid Waste Management: $23,000
- Construction - Health - Other: $620,000
Elementary and Secondary Education: $226,000
Air Transportation: $126,000
General Public Buildings: $88,000
Elementary and Secondary Education: $77,000
General - Other: $25,000
Solid Waste Management: $14,000
- Current Operations - Elementary and Secondary Education: $36,543,000
Elementary and Secondary Education: $35,984,000
Police Protection: $3,163,000
Police Protection: $2,595,000
Regular Highways: $2,465,000
Regular Highways: $1,792,000
Correctional Institutions: $1,530,000
Correctional Institutions: $1,419,000
General - Other: $1,411,000
Judicial and Legal Services: $1,250,000
Judicial and Legal Services: $1,150,000
Financial Administration: $988,000
Central Staff Services: $958,000
General Public Buildings: $926,000
Air Transportation: $919,000
General Public Buildings: $855,000
Central Staff Services: $840,000
General - Other: $737,000
Financial Administration: $724,000
Solid Waste Management: $680,000
Solid Waste Management: $680,000
Health - Other: $558,000
Health - Other: $520,000
Local Fire Protection: $249,000
Local Fire Protection: $220,000
Air Transportation: $206,000
Libraries: $170,000
Libraries: $151,000
Natural Resources - Other: $103,000
Natural Resources - Other: $103,000
Parks and Recreation: $81,000
Parks and Recreation: $28,000
Corrections - Other: $21,000
Public Welfare - Other: $17,000
- Federal Intergovernmental - General Local Government Support: $195,000
General Local Government Support: $33,000
- General - Interest on Debt: $2,170,000
Interest on Debt: $1,299,000
- Intergovernmental to Local - Other - Elementary and Secondary Education: $21,000
- Local Intergovernmental - Other: $1,177,000
General Local Government Support: $947,000
General Local Government Support: $810,000
Other: $313,000
Education: $236,000
Education: $16,000
- Long Term Debt - Beginning Outstanding - Unspecified Public Purpose: $32,492,000
Outstanding Unspecified Public Purpose: $30,082,000
Beginning Outstanding - Unspecified Public Purpose: $24,831,000
Retired Unspecified Public Purpose: $24,831,000
Retired Unspecified Public Purpose: $2,410,000
- Miscellaneous - General Revenue - Other: $588,000
Interest Earnings: $381,000
Rents: $254,000
Fines and Forfeits: $188,000
General Revenue - Other: $155,000
Rents: $146,000
Sale of Property: $114,000
Interest Earnings: $104,000
Fines and Forfeits: $19,000
Donations From Private Sources: $9,000
Sale of Property: $4,000
Donations From Private Sources: $1,000
- Other Capital Outlay - Regular Highways: $1,361,000
Elementary and Secondary Education: $684,000
Elementary and Secondary Education: $465,000
Regular Highways: $457,000
Police Protection: $430,000
General Public Building: $17,000
General - Other: $12,000
Judicial and Legal Services: $8,000
Financial Administration: $3,000
Central Staff Services: $3,000
- Other Funds - Cash and Securities: $19,215,000
Cash and Securities: $15,622,000
- Sinking Funds - Cash and Securities: $13,188,000
Cash and Securities: $1,699,000
- State Intergovernmental - Education: $27,348,000
Education: $26,952,000
Highways: $4,390,000
Other: $1,115,000
Other: $862,000
General Local Government Support: $787,000
General Local Government Support: $596,000
Health and Hospitals: $281,000
Highways: $278,000
Health and Hospitals: $239,000
- Tax - Property: $15,422,000
Property: $9,636,000
General Sales and Gross Receipts: $6,819,000
Motor Vehicle License: $1,939,000
General Sales and Gross Receipts: $316,000
Other Selective Sales: $294,000
Occupation and Business License - Other: $283,000
Other License: $155,000
Public Utilities Sales: $129,000
Other License: $125,000
Public Utilities Sales: $120,000
Other Selective Sales: $115,000
Alcoholic Beverage Sales: $90,000
Alcoholic Beverage Sales: $14,000
Severance: $3,000
Alcoholic Beverage License: $2,000
- Total Salaries and Wages: $21,129,000
: $20,421,000
Supplemental Security Income (SSI) in 2006:
- Total number of recipients: 1,017
- Number of aged recipients: 90
- Number of blind and disabled recipients: 927
- Number of recipients under 18: 97
- Number of recipients between 18 and 64: 666
- Number of recipients older than 64: 254
- Number of recipients also receiving OASDI: 434
- Amount of payments (thousands of dollars): 451
| Most common first names in Marion County, TN among deceased individuals | ||
| Name | Count | Lived (average) |
|---|---|---|
| James | 307 | 69.8 years |
| William | 296 | 73.1 years |
| John | 260 | 72.1 years |
| Mary | 219 | 77.6 years |
| Charles | 140 | 69.0 years |
| Robert | 122 | 70.0 years |
| George | 112 | 73.8 years |
| Thomas | 76 | 71.3 years |
| Willie | 70 | 77.6 years |
| Paul | 62 | 67.7 years |
| Most common last names in Marion County, TN among deceased individuals | ||
| Last name | Count | Lived (average) |
|---|---|---|
| Smith | 162 | 75.6 years |
| Layne | 148 | 73.0 years |
| Kilgore | 119 | 71.9 years |
| Thomas | 92 | 71.6 years |
| Brown | 82 | 75.9 years |
| Griffith | 73 | 75.9 years |
| Morrison | 69 | 71.9 years |
| Turner | 68 | 74.9 years |
| Pickett | 61 | 75.1 years |
| Jones | 60 | 70.3 years |
| Businesses in Marion County, TN | ||||
| Name | Count | Name | Count | |
|---|---|---|---|---|
| Advance Auto Parts | 1 | Lane Furniture | 1 | |
| Arby's | 1 | Long John Silver's | 1 | |
| AutoZone | 1 | Lowe's | 1 | |
| Best Western | 1 | McDonald's | 2 | |
| CVS | 2 | Nike | 1 | |
| Chevrolet | 1 | Pizza Hut | 2 | |
| Comfort Inn | 1 | Quiznos | 1 | |
| Cracker Barrel | 1 | RadioShack | 1 | |
| Dairy Queen | 1 | SONIC Drive-In | 3 | |
| Days Inn | 1 | Subway | 4 | |
| FedEx | 3 | Super 8 | 2 | |
| Ford | 1 | T-Mobile | 2 | |
| GNC | 1 | Taco Bell | 1 | |
| GameStop | 1 | True Value | 1 | |
| Goodwill | 1 | U-Haul | 3 | |
| H&R Block | 1 | UPS | 1 | |
| Hardee's | 3 | Waffle House | 2 | |
| Holiday Inn | 1 | Walmart | 1 | |
| KFC | 1 | Wendy's | 1 | |