Johnston County, North Carolina (NC)
County owner-occupied free and clear houses and condos in 2010: 10,730
County owner-occupied houses and condos in 2000: 34,222
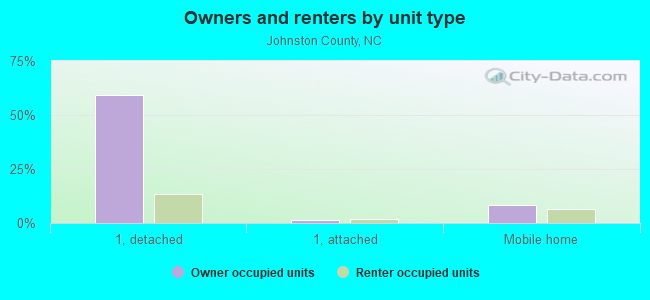
Renter-occupied apartments: 16,591 (it was 12,373 in 2000)
| % of renters here: | 27% |
| State: | 33% |
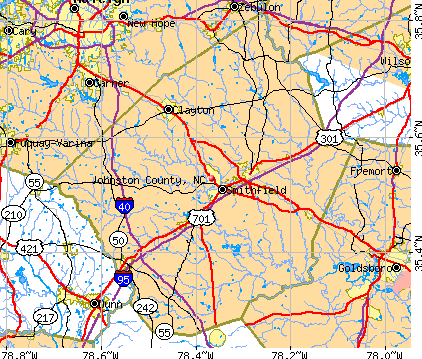
Land area: 792 sq. mi.
Water area: 3.9 sq. mi.
Population density: 296 people per square mile (high).
Industries providing employment: Educational, health and social services (19.3%), Professional, scientific, management, administrative, and waste management services (11.9%), Construction (11.5%), Retail trade (11.2%), Manufacturing (11.1%).
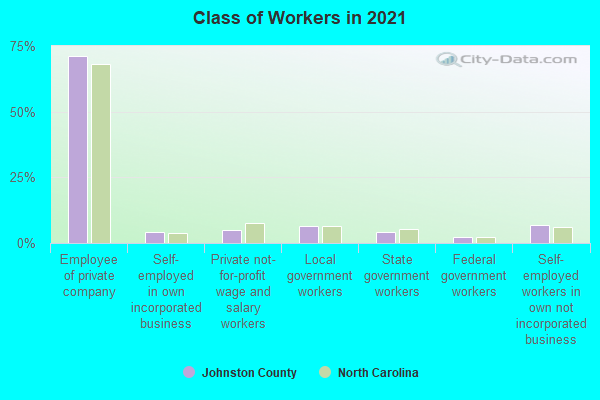
Type of workers:
- Private wage or salary: 78%
- Government: 16%
- Self-employed, not incorporated: 5%
- Unpaid family work: 0%
- OSM Map
- General Map
- Google Map
- MSN Map

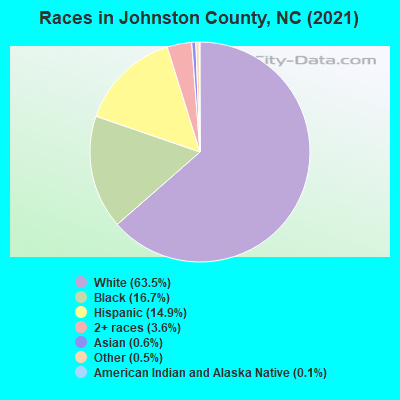
- 147,15962.7%White Non-Hispanic Alone
- 40,02517.0%Black Non-Hispanic Alone
- 35,73615.2%Hispanic or Latino
- 8,9163.8%Two or more races
- 1,6640.7%Asian alone
- 7690.3%Some other race alone
- 3750.2%American Indian and Alaska Native alone
- 1340.06%Native Hawaiian and Other
Pacific Islander alone
| Median resident age: | 38.4 years |
| North Carolina median age: | 39.2 years |
| Males: 116,010 | |
| Females: 118,768 |

 | Why is Johnston County growing faster than Granville County, etc. (39 replies) |
| Other NC cities to boom? (122 replies) |
| Looking for a couple of acres in Johnston County, NC (2 replies) |
| Amazon will build distribution center, create 500 jobs in Johnston County (0 replies) |
| Property Search in Johnston County (31 replies) |
| Johnston County Lands Major New Employer (3 replies) |
| Johnston County: | 2.0 people |
| North Carolina: | 2 people |
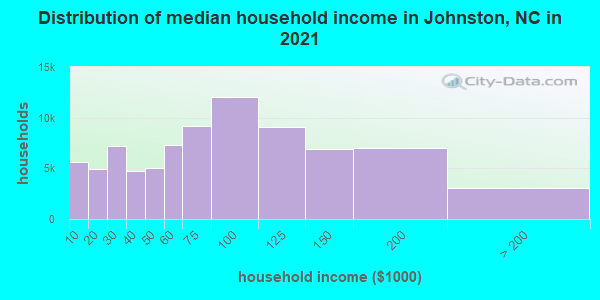
Estimated median household income in 2022: $81,725 ($40,872 in 1999)
| This county: | $81,725 |
| North Carolina: | $67,481 |
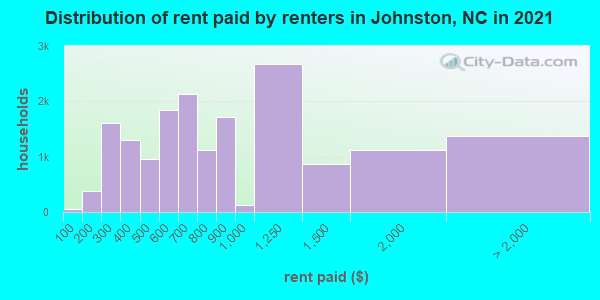
Median contract rent in 2022 for apartments: $832 (lower quartile is $608, upper quartile is $1,420)
| This county: | $832 |
| State: | $945 |
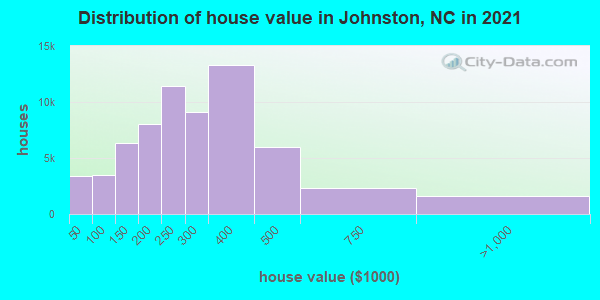
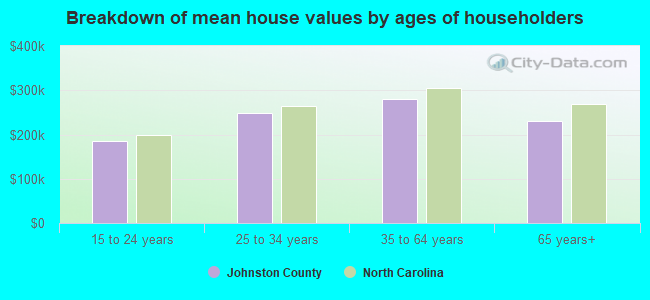
Estimated median house or condo value in 2022: $289,600 (it was $97,100 in 2000)
| Johnston: | $289,600 |
| North Carolina: | $280,600 |
Mean price in 2022:
Median monthly housing costs for homes and condos with a mortgage: $1,512Detached houses: $253,151
Here: $253,151 State: $375,326 Townhouses or other attached units: $220,820
Here: $220,820 State: $317,935 In 2-unit structures: $160,163
Here: $160,163 State: $250,488 In 3-to-4-unit structures: $138,247
Here: $138,247 State: $254,939 In 5-or-more-unit structures: $260,973
Here: $260,973 State: $329,290 Mobile homes: $107,643
Here: $107,643 State: $124,933
Median monthly housing costs for units without a mortgage: $409
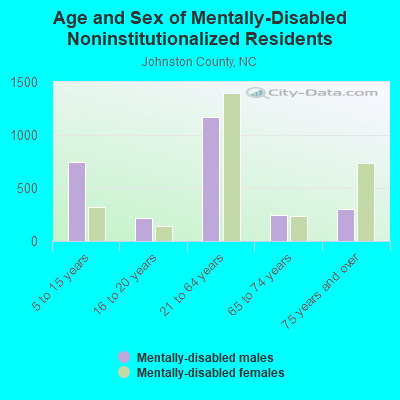
Institutionalized population: 1,477
Crime in 2021 (reported by the sheriff's office or county police, not the county total):
- Murders: 2
- Rapes: 25
- Robberies: 10
- Assaults: 96
- Burglaries: 280
- Thefts: 1047
- Auto thefts: 158
Crime in 2020 (reported by the sheriff's office or county police, not the county total):
- Murders: 4
- Rapes: 27
- Robberies: 20
- Assaults: 85
- Burglaries: 356
- Thefts: 1001
- Auto thefts: 114
Health of residents in Johnston County based on CDC Behavioral Risk Factor Surveillance System Survey Questionnaires from 2013 to 2021:
General health status score of residents in this county from 1 (poor) to 5 (excellent) is 3.6. This is better than average.79.1% of residents exercised in the past month. This is about average.
35.9% of residents smoked 100+ cigarettes in their lives. This is less than average.
55.9% of adult residents drank alcohol in the past 30 days. This is less than average.
70.9% of residents visited a dentist within the past year. This is about average.
Average weight of males is 194 pounds. This is about average.
Average weight of females is 164 pounds. This is about average.
Health of residents in Johnston County based on CDC Behavioral Risk Factor Surveillance System Survey Questionnaires from 2003 to 2012:
General health status score of residents in this county from 1 (poor) to 5 (excellent) is 3.3. This is worse than average.70.7% of residents exercised in the past month. This is about average.
49.0% of residents smoked 100+ cigarettes in their lives. This is about average.
71.1% of adult residents drank alcohol in the past 30 days. This is about average.
66.9% of residents visited a dentist within the past year. This is less than average.
Average weight of males is 200 pounds. This is more than average.
Average weight of females is 164 pounds. This is about average.
39.2% of residents keep firearms around their homes. This is more than average.
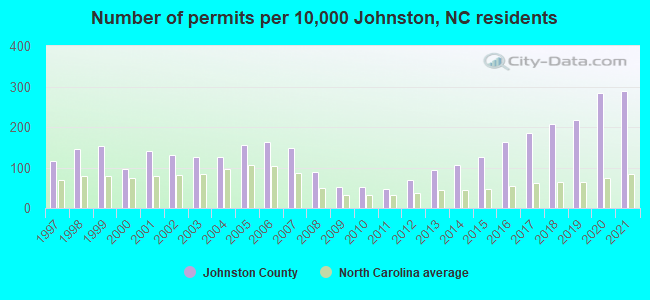
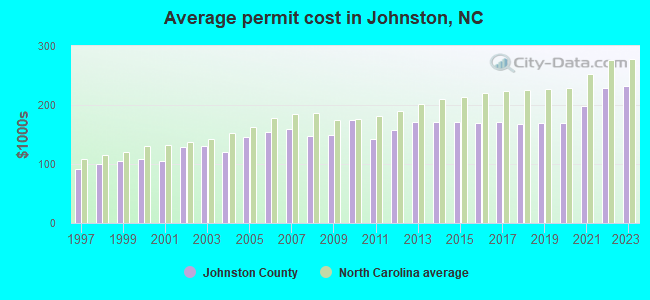
Single-family new house construction building permits:
- 2022: 2662 buildings, average cost: $229,100
- 2021: 3520 buildings, average cost: $197,900
- 2020: 3447 buildings, average cost: $170,400
- 2019: 2643 buildings, average cost: $169,600
- 2018: 2539 buildings, average cost: $167,300
- 2017: 2251 buildings, average cost: $171,500
- 2016: 1998 buildings, average cost: $170,200
- 2015: 1545 buildings, average cost: $171,900
- 2014: 1280 buildings, average cost: $171,600
- 2013: 1151 buildings, average cost: $170,500
- 2012: 826 buildings, average cost: $156,800
- 2011: 588 buildings, average cost: $143,200
- 2010: 641 buildings, average cost: $174,200
- 2009: 636 buildings, average cost: $148,700
- 2008: 1073 buildings, average cost: $148,000
- 2007: 1796 buildings, average cost: $159,100
- 2006: 2002 buildings, average cost: $154,200
- 2005: 1894 buildings, average cost: $144,800
- 2004: 1529 buildings, average cost: $119,800
- 2003: 1537 buildings, average cost: $129,900
- 2002: 1585 buildings, average cost: $128,600
- 2001: 1709 buildings, average cost: $105,000
- 2000: 1180 buildings, average cost: $107,600
- 1999: 1871 buildings, average cost: $105,100
- 1998: 1783 buildings, average cost: $99,900
- 1997: 1407 buildings, average cost: $91,600
Median real estate property taxes paid for housing units with mortgages in 2022: $1,968 (0.6%)
Median real estate property taxes paid for housing units with no mortgage in 2022: $1,304 (0.7%)
| Johnston County: | 9.6% |
| North Carolina: | 12.8% |
Median age of residents in 2022: 38.4 years old
(Males: 38.4 years old, Females: 38.3 years old)
(Median age for: White residents: 42.9 years old, Black residents: 38.1 years old, American Indian residents: 21.8 years old, Asian residents: 48.3 years old, Hispanic or Latino residents: 25.2 years old, Other race residents: 28.7 years old)
Area name: Raleigh-Cary, NC MSA
Fair market rent in 2006 for a 1-bedroom apartment in Johnston County is $734 a month.
Fair market rent for a 2-bedroom apartment is $817 a month.
Fair market rent for a 3-bedroom apartment is $1027 a month.
Cities in this county include: Smithfield, Clayton, Selma, Archer Lodge, Benson, Kenly, Four Oaks, Pine Level, Wilson's Mills, Princeton.
2023 air pollution in Johnston County:
Ozone (1-hour): 0.032 ppm (standard limit: 0.12 ppm). Near U.S. average.
Particulate Matter (PM2.5) Annual: 8.8 µg/m3(standard limit: 15.0 µg/m3). Near U.S. average.
Neighboring counties: Cumberland County, Tennessee  , Davidson County , Kingfisher County, Oklahoma , Graham County , McIntosh County, Oklahoma , Montgomery County .
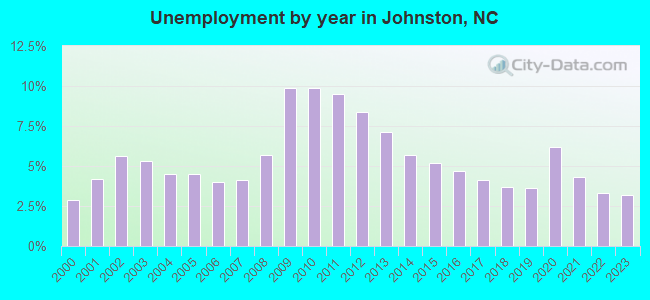
| Here: | 2.9% |
| North Carolina: | 3.2% |
Current college students: 4,186
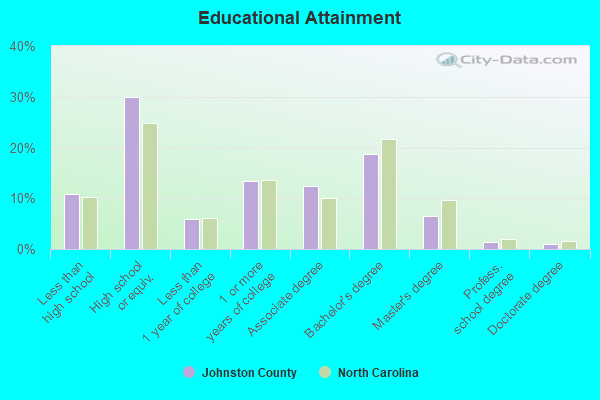
People 25 years of age or older with a high school degree or higher: 90.4%
People 25 years of age or older with a bachelor's degree or higher: 29.6%
Number of foreign born residents: 19,602 (36.0% naturalized citizens)
| Johnston County: | 8.3% |
| Whole state: | 8.6% |
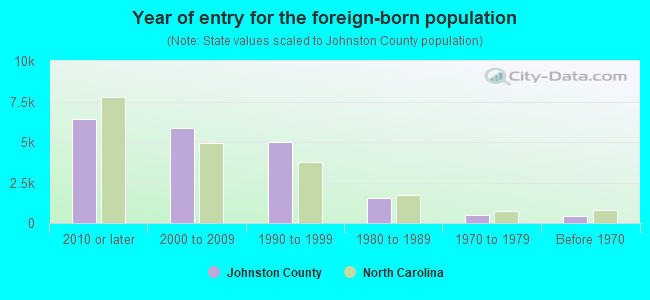
- Year of entry for the foreign-born population
- 4,2632010 or later
- 5,5562000 to 2009
- 4,4871990 to 1999
- 1,5221980 to 1989
- 4701970 to 1979
- 414Before 1970
Mean travel time to work (commute): ! minutes
Percentage of county residents living and working in this county: 99.8%
Housing units in structures:
- One, detached: 69,914
- One, attached: 2,376
- Two: 1,280
- 3 or 4: 1,197
- 5 to 9: 1,479
- 10 to 19: 1,842
- 20 to 49: 607
- 50 or more: 36
- Mobile homes: 13,019
- Boats, RVs, vans, etc.: 90
Housing units in Johnston County with a mortgage: 46,682 (2,656 second mortgage, 0 home equity loan, 2,061 both second mortgage and home equity loan)
Houses without a mortgage: 1,339
| Here: | 97.9% with mortgage |
| State: | 97.0% with mortgage |
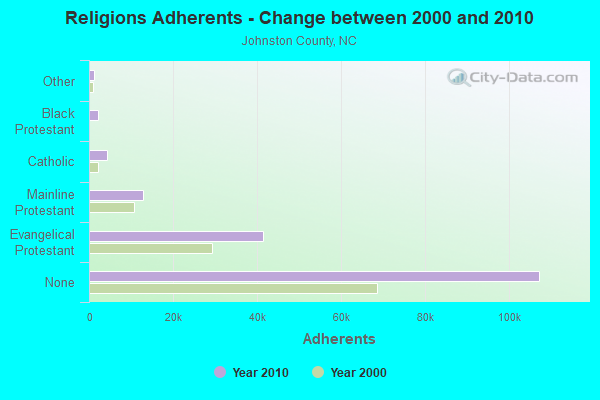
Religion statistics for Johnston County
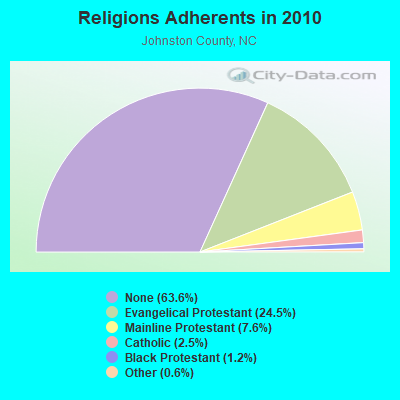
| Religion | Adherents | Congregations |
|---|---|---|
| Evangelical Protestant | 41,366 | 173 |
| Mainline Protestant | 12,784 | 59 |
| Catholic | 4,263 | 1 |
| Black Protestant | 2,049 | 20 |
| Other | 1,092 | 6 |
| None | 107,324 | - |
Source: Clifford Grammich, Kirk Hadaway, Richard Houseal, Dale E.Jones, Alexei Krindatch, Richie Stanley and Richard H.Taylor. 2012. 2010 U.S.Religion Census: Religious Congregations & Membership Study. Association of Statisticians of American Religious Bodies. Jones, Dale E., et al. 2002. Congregations and Membership in the United States 2000. Nashville, TN: Glenmary Research Center.
Food Environment Statistics:
| Johnston County: | 2.10 / 10,000 pop. |
| State: | 2.05 / 10,000 pop. |
| Here: | 0.19 / 10,000 pop. |
| North Carolina: | 0.14 / 10,000 pop. |
| This county: | 0.32 / 10,000 pop. |
| North Carolina: | 0.92 / 10,000 pop. |
| Johnston County: | 4.53 / 10,000 pop. |
| North Carolina: | 4.75 / 10,000 pop. |
| This county: | 6.18 / 10,000 pop. |
| State: | 7.57 / 10,000 pop. |
| Johnston County: | 8.3% |
| North Carolina: | 9.8% |
| Johnston County: | 31.9% |
| State: | 28.3% |
| Here: | 17.0% |
| State: | 15.6% |
Agriculture in Johnston County:
Average size of farms: 170 acresAverage value of agricultural products sold per farm: $127,197
Average value of crops sold per acre for harvested cropland: $605.40
The value of nursery, greenhouse, floriculture, and sod as a percentage of the total market value of agricultural products sold: 7.40%
The value of livestock, poultry, and their products as a percentage of the total market value of agricultural products sold: 54.18%
Average total farm production expenses per farm: $108,902
Harvested cropland as a percentage of land in farms: 56.71%
Irrigated harvested cropland as a percentage of land in farms: 5.02%
Average market value of all machinery and equipment per farm: $67,625
The percentage of farms operated by a family or individual: 89.16%
Average age of principal farm operators: 55 years
Average number of cattle and calves per 100 acres of all land in farms: 6.46
Milk cows as a percentage of all cattle and calves: 0.51%
Corn for grain: 7643 harvested acres
All wheat for grain: 7098 harvested acres
Upland cotton: 18538 harvested acres
Soybeans for beans: 51523 harvested acres
Vegetables: 1,466 harvested acres
Land in orchards: 182 acres
Earthquake activity:
Johnston County-area historical earthquake activity is significantly above North Carolina state average. It is 51% smaller than the overall U.S. average.On 8/23/2011 at 17:51:04, a magnitude 5.8 (5.8 MW, Depth: 3.7 mi, Class: Moderate, Intensity: VI - VII) earthquake occurred 166.6 miles away from Johnston County center
On 8/9/2020 at 12:07:37, a magnitude 5.1 (5.1 MW, Depth: 4.7 mi) earthquake occurred 166.0 miles away from the county center
On 12/9/2003 at 20:59:14, a magnitude 4.5 (4.5 MB, 4.5 LG, Class: Light, Intensity: IV - V) earthquake occurred 144.9 miles away from the county center
On 12/9/2003 at 20:59:18, a magnitude 4.5 (4.5 ML, Depth: 6.2 mi) earthquake occurred 156.2 miles away from the county center
On 8/25/2011 at 05:07:52, a magnitude 4.5 (4.5 ML, Depth: 4.2 mi) earthquake occurred 168.9 miles away from Johnston County center
On 11/22/1974 at 05:25:55, a magnitude 4.7 (4.7 MB) earthquake occurred 208.1 miles away from the county center
Magnitude types: regional Lg-wave magnitude (LG), body-wave magnitude (MB), local magnitude (ML), moment magnitude (MW)
Most recent natural disasters:
- North Carolina Covid-19 Pandemic, Incident Period: January 20, 2020, FEMA Id: 4487, Natural disaster type: Other
- North Carolina Hurricane Florence, Incident Period: September 7, 2018 - September 29, 2018, FEMA Id: 4393, Natural disaster type: Hurricane
- North Carolina Hurricane Matthew, Incident Period: October 04, 2016 to October 24, 2016, Emergency Declared EM-3380: October 07, 2016, FEMA Id: 3380, Natural disaster type: Hurricane
- North Carolina Hurricane Matthew, Incident Period: October 04, 2016 to October 24, 2016, Major Disaster (Presidential) Declared DR-4285: October 10, 2016, FEMA Id: 4285, Natural disaster type: Hurricane
- North Carolina Hurricane Irene, Incident Period: August 25, 2011 to September 01, 2011, Emergency Declared EM-3327: August 25, 2011, FEMA Id: 3327, Natural disaster type: Hurricane
- North Carolina Hurricane Irene, Incident Period: August 25, 2011 to September 01, 2011, Major Disaster (Presidential) Declared DR-4019: August 31, 2011, FEMA Id: 4019, Natural disaster type: Hurricane
- North Carolina Severe Storms, Tornadoes, and Flooding, Incident Period: April 16, 2011, Major Disaster (Presidential) Declared DR-1969: April 19, 2011, FEMA Id: 1969, Natural disaster type: Storm, Tornado, Flood
- North Carolina Hurricane Ophelia, Incident Period: September 11, 2005 to September 17, 2005, Emergency Declared EM-3254: September 14, 2005, FEMA Id: 3254, Natural disaster type: Hurricane
- North Carolina Hurricane Katrina Evacuation, Incident Period: August 29, 2005 to October 01, 2005, Emergency Declared EM-3222: September 05, 2005, FEMA Id: 3222, Natural disaster type: Hurricane
- North Carolina Hurricane Isabel, Incident Period: September 18, 2003 to September 26, 2003, Major Disaster (Presidential) Declared DR-1490: September 18, 2003, FEMA Id: 1490, Natural disaster type: Hurricane
- 9 other natural disasters have been reported since 1953.
The number of natural disasters in Johnston County (19) is greater than the US average (15).
Major Disasters (Presidential) Declared: 10
Emergencies Declared: 7
Causes of natural disasters: Hurricanes: 11, Droughts: 2, Ice Storms: 2, Blizzard: 1, Flood: 1, Freeze: 1, Storm: 1, Tornado: 1, Winter Storm: 1, Other: 1 (Note: some incidents may be assigned to more than one category).
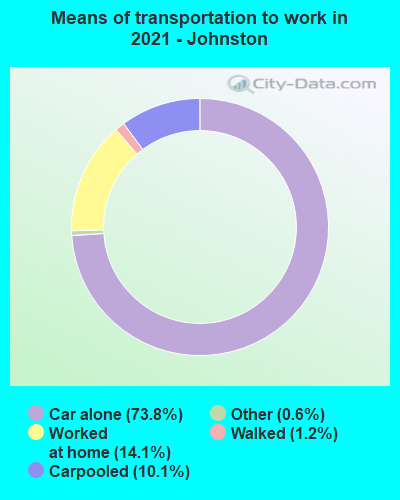
Means of transportation to work:
- Drove a car alone: 46,352 (67.3%)
- Carpooled: 6,384 (9.3%)
- Bus: 31 (0.0%)
- Taxicab, motorcycle, or other means: 365 (0.5%)
- Bicycle: 92 (0.1%)
- Walked: 835 (1.2%)
- Worked at home: 16,373 (23.8%)
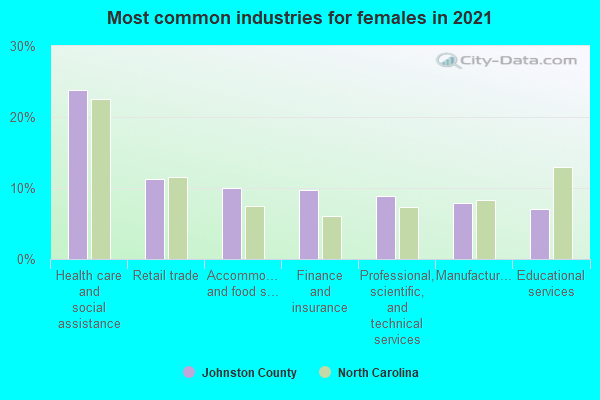
- Health care and social assistance (14%)
- Educational services (12%)
- Retail trade (11%)
- Accommodation and food services (9%)
- Public administration (7%)
- Finance and insurance (7%)
- Manufacturing (6%)
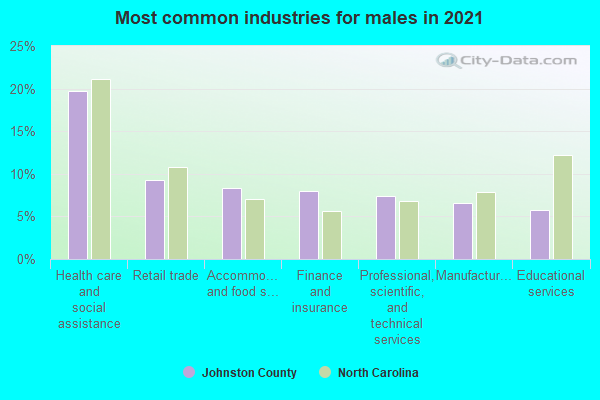
- Health care and social assistance (15%)
- Educational services (14%)
- Retail trade (13%)
- Accommodation and food services (10%)
- Public administration (8%)
- Finance and insurance (8%)
- Manufacturing (7%)
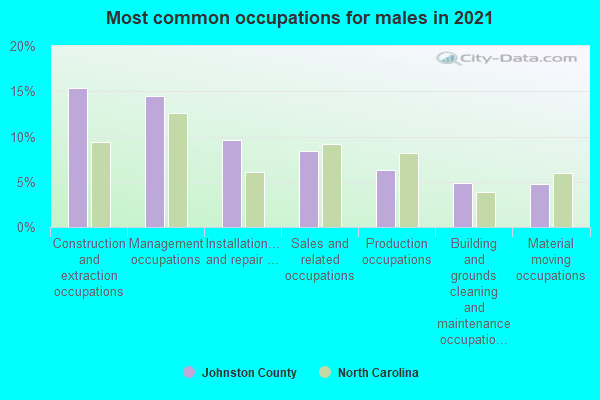
- Construction and extraction occupations (13%)
- Management occupations (13%)
- Installation, maintenance, and repair occupations (9%)
- Sales and related occupations (7%)
- Production occupations (7%)
- Transportation occupations (6%)
- Computer and mathematical occupations (6%)
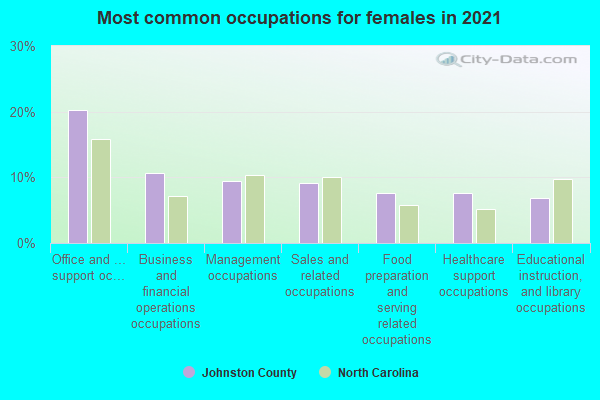
- Office and administrative support occupations (20%)
- Sales and related occupations (12%)
- Management occupations (11%)
- Educational instruction, and library occupations (9%)
- Business and financial operations occupations (9%)
- Food preparation and serving related occupations (7%)
- Health diagnosing and treating practitioners and other technical occupations (6%)
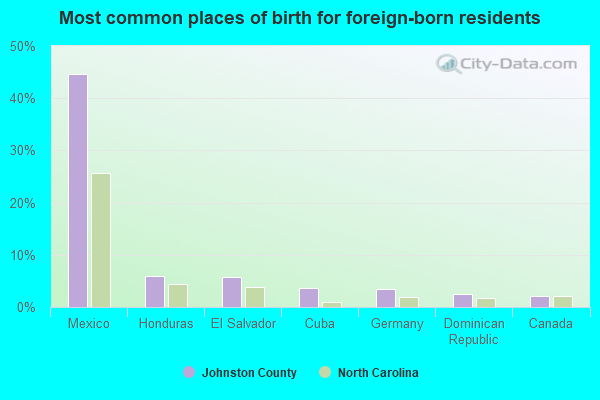
- Mexico (41%)
- Honduras (8%)
- El Salvador (4%)
- Cuba (4%)
- Germany (3%)
- Nicaragua (3%)
- Dominican Republic (3%)
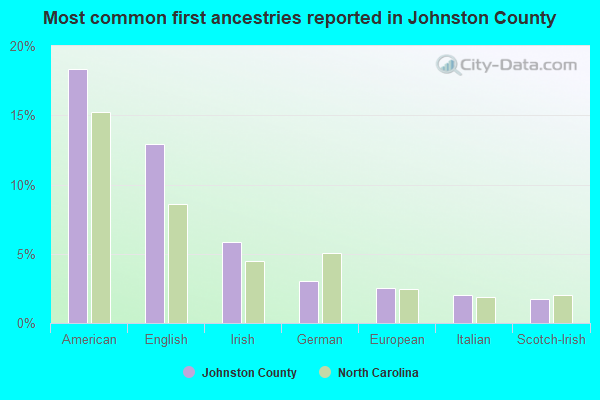
- American (16%)
- English (13%)
- Irish (5%)
- German (3%)
- European (2%)
- Italian (2%)
- Scotch-Irish (1%)
People in group quarters in Johnston County, North Carolina in 2010:
- 639 people in state prisons
- 634 people in nursing facilities/skilled-nursing facilities
- 177 people in local jails and other municipal confinement facilities
- 137 people in group homes intended for adults
- 66 people in other noninstitutional facilities
- 59 people in workers' group living quarters and job corps centers
- 24 people in emergency and transitional shelters (with sleeping facilities) for people experiencing homelessness
- 11 people in group homes for juveniles (non-correctional)
- 10 people in residential treatment centers for juveniles (non-correctional)
- 8 people in residential treatment centers for adults
- 6 people in mental (psychiatric) hospitals and psychiatric units in other hospitals
People in group quarters in Johnston County, North Carolina in 2000:
- 643 people in state prisons
- 589 people in nursing homes
- 193 people in local jails and other confinement facilities (including police lockups)
- 104 people in other nonhousehold living situations
- 87 people in other noninstitutional group quarters
- 64 people in other group homes
- 16 people in hospitals or wards for drug/alcohol abuse
- 12 people in homes for the mentally retarded
- 5 people in agriculture workers' dormitories on farms
- 4 people in unknown juvenile institutions
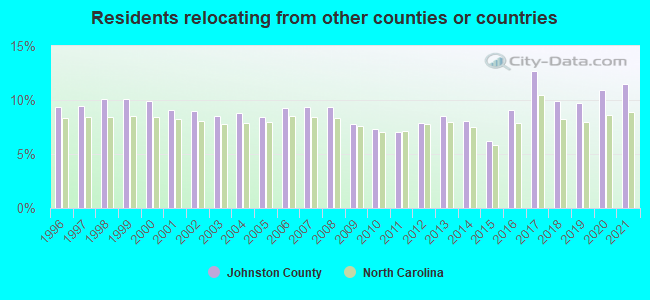
11.44% of this county's 2021 resident taxpayers lived in other counties in 2020 ($58,563 average adjusted gross income)
| Here: | 11.44% |
| North Carolina average: | 8.85% |
0.03% of residents moved from foreign countries ($145 average AGI)
Johnston County: 0.03% North Carolina average: 0.04%
7.92% relocated from other counties in North Carolina ($37,731 average AGI)
3.49% relocated from other states ($20,687 average AGI)
Johnston County: 3.49% North Carolina average: 4.18%
Top counties from which taxpayers relocated into this county between 2020 and 2021:
| from Wake County, NC | |
| from Harnett County, NC | |
| from Wayne County, NC | |
| from Durham County, NC | |
| from Cumberland County, NC | |
| from Nash County, NC | |
| from Wilson County, NC |
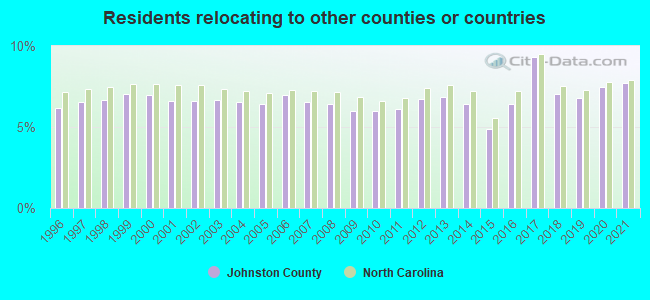
7.69% of this county's 2020 resident taxpayers moved to other counties in 2021 ($59,107 average adjusted gross income)
| Here: | 7.69% |
| North Carolina average: | 7.89% |
0.03% of residents moved to foreign countries ($212 average AGI)
Johnston County: 0.03% North Carolina average: 0.03%
5.67% relocated to other counties in North Carolina ($43,068 average AGI)
1.99% relocated to other states ($15,827 average AGI)
Johnston County: 1.99% North Carolina average: 3.18%
Top counties to which taxpayers relocated from this county between 2020 and 2021:
| to Wake County, NC | |
| to Harnett County, NC | |
| to Wayne County, NC | |
| to Wilson County, NC | |
| to Sampson County, NC | |
| to Nash County, NC | |
| to Cumberland County, NC |
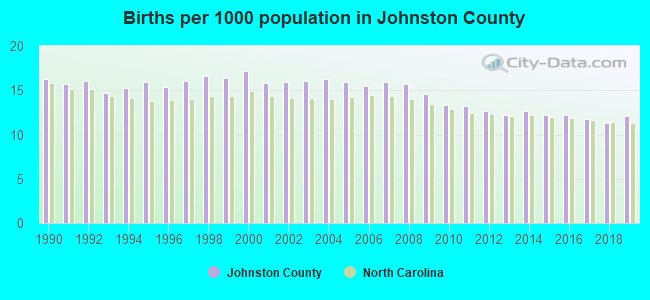
Births per 1000 population from 1990 to 1999: 15.8
Births per 1000 population from 2000 to 2009: 15.9
Births per 1000 population from 2010 to 2022: 10.4
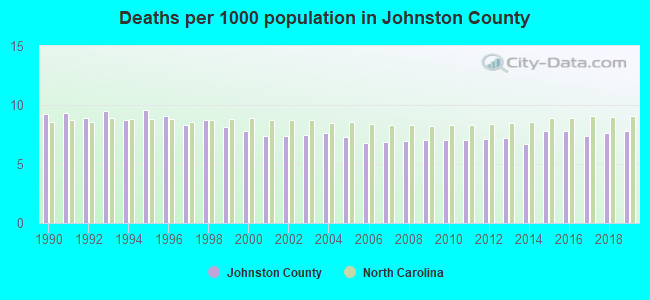
Deaths per 1000 population from 1990 to 1999: 8.9
Deaths per 1000 population from 2000 to 2009: 7.3
Deaths per 1000 population from 2010 to 2020: 7.4
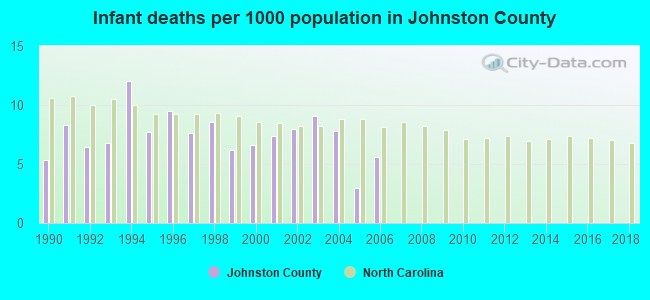
Infant deaths per 1000 live births from 1990 to 1999: 7.8
Infant deaths per 1000 live births from 2000 to 2006: 6.8
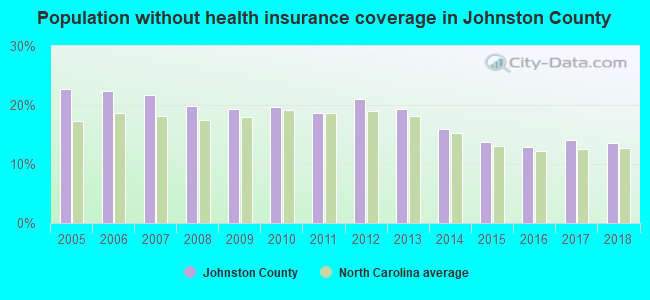
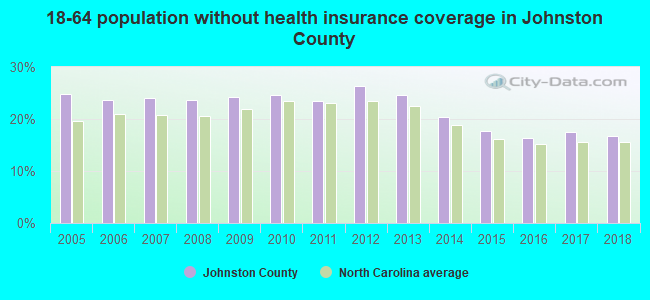
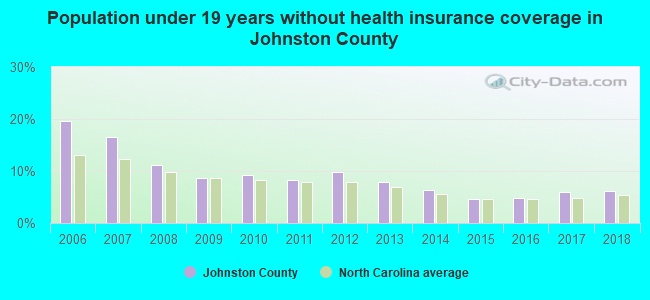
Persons under 19 years old without health insurance coverage in 2018: 6.1%
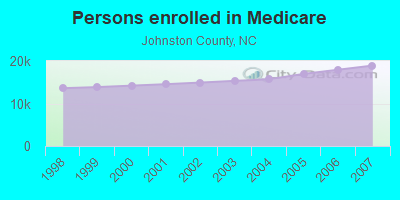
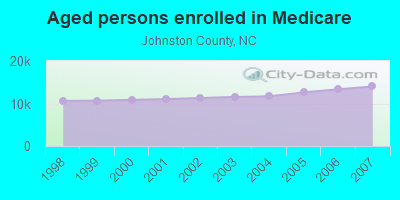
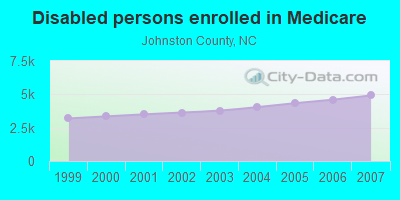
Persons enrolled in hospital insurance and/or supplemental medical insurance (Medicare) in July 1, 2007: 18,925 (14,008 aged, 4,917 disabled)
Children under 18 without health insurance coverage in 2007: 7,280 (16%)
Most common underlying causes of death in Johnston County, North Carolina in 1999 - 2019:
- Bronchus or lung, unspecified - Malignant neoplasms (1,849)
- Atherosclerotic heart disease (1,455)
- Chronic ischaemic heart disease, unspecified (1,448)
- Chronic obstructive pulmonary disease, unspecified (975)
- Acute myocardial infarction, unspecified (934)
- Unspecified dementia (677)
- Alzheimer disease, unspecified (632)
- Stroke, not specified as haemorrhage or infarction (606)
- Atherosclerotic cardiovascular disease, so described (573)
- Congestive heart failure (449)
Population without health insurance coverage in 2000: 14%
Children under 18 without health insurance coverage in 2000: 12%
Short term general hospital admissions per 100,000 population in 2004: 5,606
Short term general hospital beds per 100,000 population in 2004: 113
Emergency room visits per 100,000 population in 2004: 31,132
General practice office based MDs per 100,000 population in 2005: 1,656
Medical specialist MDs per 100,000 population in 2005: 753
Dentists per 100,000 population in 1998: 3
Total births per 100,000 population, July 2005 - July 2006 : 17
Total deaths per 100,000 population, July 2005 - July 2006: 75
Limited-service eating places per 100,000 population in 2005 : 12
Beer, wine & liquor stores per 100,000 population in 2005: 1
Homicides per 1,000,000 population from 2000 to 2006: 63.9. This is less than state average.
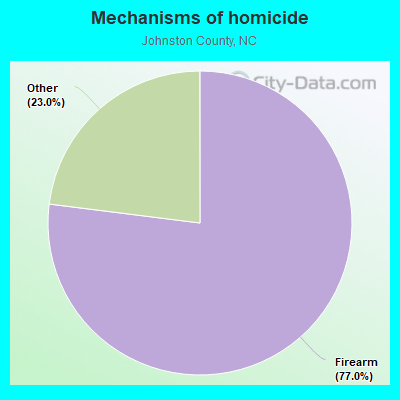
- Firearm - 49.2
- Other - 14.7
Suicides per 1,000,000 population from 2000 to 2006: 113.2. This is less than state average.
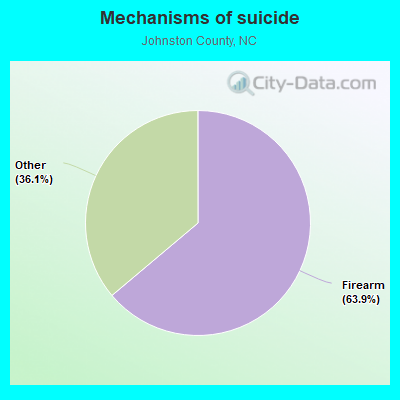
- Firearm - 72.3
- Other - 40.9
Household type by relationship:
Households: 234,778- Male householders: 42,455 (7,261 living alone), Female householders: 43,451 (9,428 living alone)
49,735 spouses (49,269 opposite-sex spouses), 6,412 unmarried partners, (6,390 opposite-sex unmarried partners), 74,205 children (67,305 natural, 1,937 adopted, 4,963 stepchildren), 2,360 grandchildren, 1,412 brothers or sisters, 2,659 parents, 39 foster children, 5,476 other relatives, 4,539 non-relatives
- In group quarters: 2,035
Size of family households: 27,059 2-persons, 15,463 3-persons, 12,984 4-persons, 5,344 5-persons, 2,423 6-persons, 1,261 7-or-more-persons.
Size of nonfamily households: 16,689 1-person, 4,179 2-persons, 146 3-persons, 358 4-persons.
33,583 married couples with children.
18,983 single-parent households (7,489 men, 11,494 women).
85.5% of residents of Johnston speak English at home.
12.0% of residents speak Spanish at home (60% speak English very well, 20% speak English well, 14% speak English not well, 7% don't speak English at all).
1.0% of residents speak other Indo-European language at home (82% speak English very well, 16% speak English well, 2% speak English not well).
0.6% of residents speak Asian or Pacific Island language at home (69% speak English very well, 15% speak English well, 16% speak English not well).
0.6% of residents speak other language at home (82% speak English very well, 16% speak English well, 2% speak English not well).
In fiscal year 2004:
Federal Government expenditure: $553,026,000 ($3,904 per capita)
Department of Defense expenditure: $30,368,000
Federal direct payments to individuals for retirement and disability: $243,014,000
Federal other direct payments to individuals: $119,404,000
Federal direct payments not to individuals: $9,180,000
Federal grants: $151,939,000
Federal procurement contracts: $8,882,000 ($5,800,000 Department of Defense)
Federal salaries and wages: $20,607,000 ($7,855,000 Department of Defense)
Federal Government direct loans: $8,256,000
Federal guaranteed/insured loans: $176,431,000
Federal Government insurance: $91,933,000
Population change from April 1, 2000 to July 1, 2005:
Births: 11,313| Here: | 77 per 1000 residents |
| State: | 72 per 1000 residents |
Deaths: 5,307
| Here: | 36 per 1000 residents |
| State: | 44 per 1000 residents |
Net international migration: +2,880
| Here: | +20 per 1000 residents |
| State: | +18 per 1000 residents |
Net internal migration: +15,837
| Here: | +108 per 1000 residents |
| State: | +27 per 1000 residents |
Total withdrawal of fresh water for public supply: 6.89 millions of gallons per day (20% from ground, 80% from surface)
| Here: | 6.5 |
| State: | 6.4 |
| Here: | 5.0 |
| State: | 4.4 |
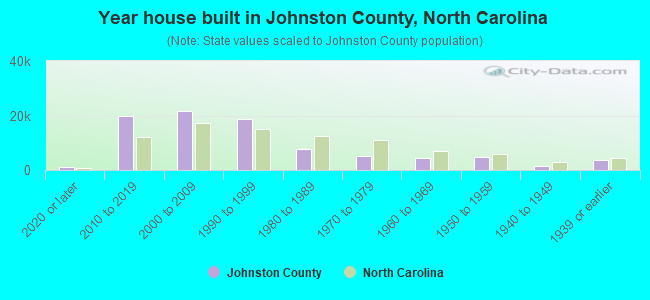
- Year house built in Johnston County, North Carolina
- 4,5822020 or later
- 21,9832010 to 2019
- 21,0582000 to 2009
- 16,8141990 to 1999
- 10,0781980 to 1989
- 4,9091970 to 1979
- 4,8541960 to 1969
- 2,2661950 to 1959
- 1,7321940 to 1949
- 3,5641939 or earlier
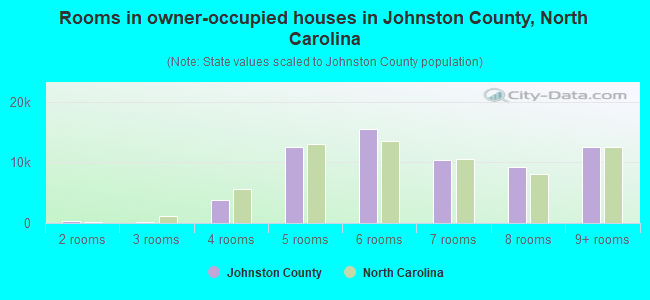
- Rooms in owner-occupied houses in Johnston County, North Carolina
- 751 room
- 662 rooms
- 8153 rooms
- 5,6874 rooms
- 15,2525 rooms
- 12,4986 rooms
- 11,2877 rooms
- 8,6378 rooms
- 13,4519+ rooms
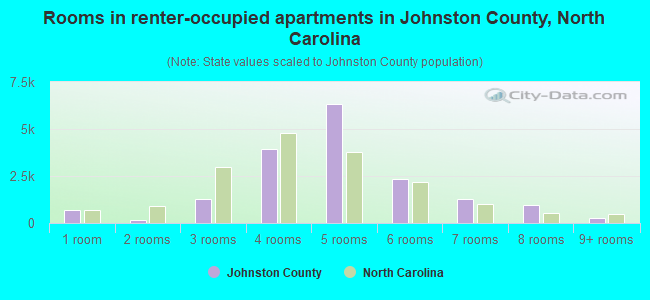
- Rooms in renter-occupied apartments in Johnston County, North Carolina
- 01 room
- 3372 rooms
- 7443 rooms
- 5,8984 rooms
- 4,0485 rooms
- 3,7726 rooms
- 7697 rooms
- 1,0448 rooms
- 1,5269+ rooms
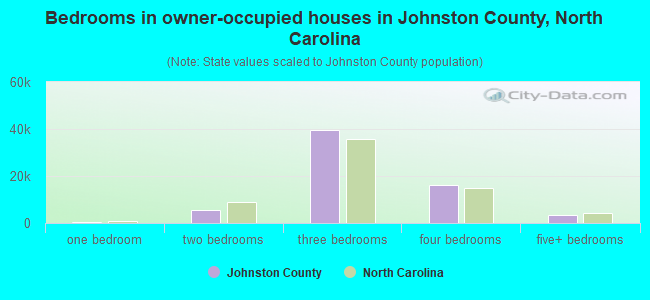
- Bedrooms in owner-occupied houses in Johnston County, North Carolina
- 133no bedroom
- 2291 bedroom
- 6,8152 bedrooms
- 40,6543 bedrooms
- 15,8234 bedrooms
- 4,1145+ bedrooms
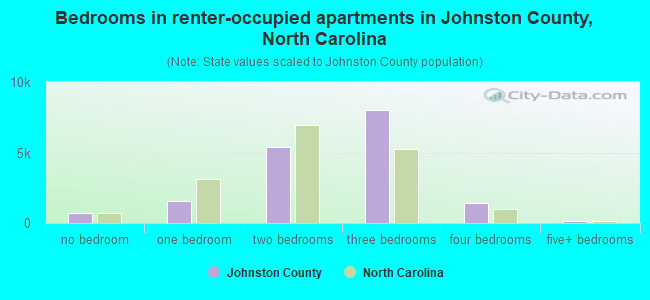
- Bedrooms in renter-occupied apartments in Johnston County, North Carolina
- 0no bedroom
- 1,2241 bedroom
- 6,5192 bedrooms
- 7,3813 bedrooms
- 2,8394 bedrooms
- 1755+ bedrooms
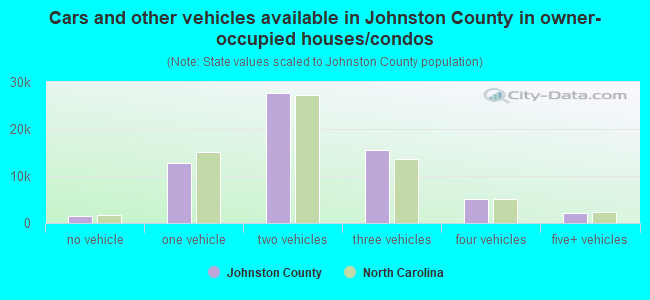
- Cars and other vehicles available in Johnston County in owner-occupied houses/condos
- 1,097no vehicle
- 13,3491 vehicle
- 24,8452 vehicles
- 19,9213 vehicles
- 5,4284 vehicles
- 3,1285+ vehicles
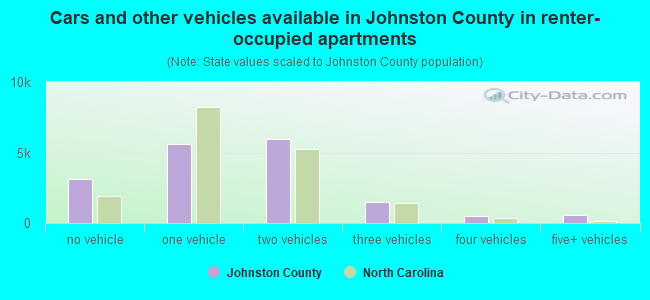
- Cars and other vehicles available in Johnston County in renter-occupied apartments
- 773no vehicle
- 7,7011 vehicle
- 6,0782 vehicles
- 3,1783 vehicles
- 2114 vehicles
- 1975+ vehicles
90.6% of Johnston County residents lived in the same house 1 years ago.
Out of people who lived in different houses, 21% lived in this county.
Out of people who lived in different counties, 59% lived in North Carolina.
| Johnston County: | 90.6% |
| State average: | 87.3% |
Place of birth for U.S.-born residents:
- This state: 139,601
- Other state: 72,651
- Northeast: 25,808
- Midwest: 14,489
- South: 26,712
- West: 5,642
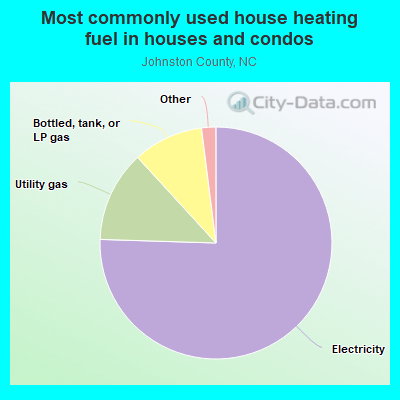
- 76.5%Electricity
- 12.2%Utility gas
- 9.4%Bottled, tank, or LP gas
- 0.5%Wood
- 0.5%Fuel oil, kerosene, etc.
- 0.4%Solar energy
- 0.4%No fuel used
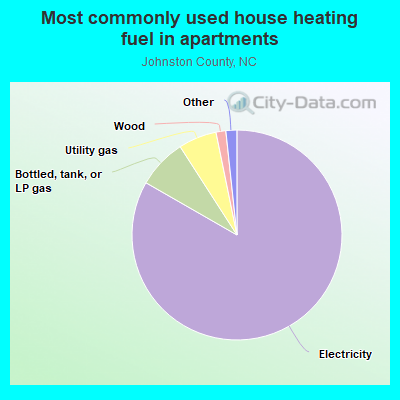
- 82.6%Electricity
- 6.9%Utility gas
- 6.8%Bottled, tank, or LP gas
- 1.5%Wood
- 1.3%Fuel oil, kerosene, etc.
- 0.9%No fuel used
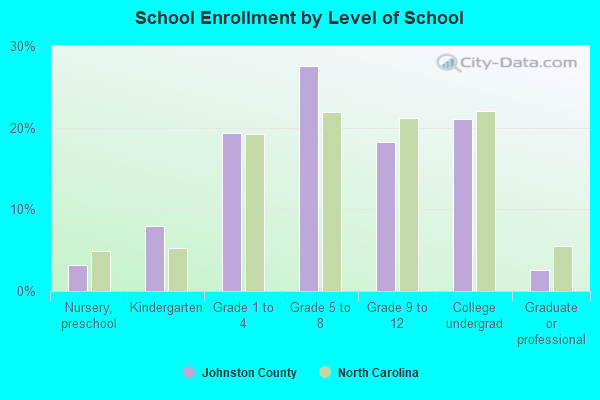
Private vs. public school enrollment:
| Here: | 8.5% |
| North Carolina: | 13.8% |
| Here: | 11.5% |
| North Carolina: | 11.9% |
| Here: | 23.0% |
| North Carolina: | 19.3% |
Johnston County government finances - Expenditure in 2020:
- Bond Funds - Cash and Securities: $2,469,000
Cash and Securities: $2,469,000
- Charges - Other: $2,415,000
Other: $2,415,000
Regular Highways: $139,000
Regular Highways: $139,000
Parks and Recreation: $113,000
Parks and Recreation: $113,000
Housing and Community Development: $19,000
Housing and Community Development: $19,000
- Construction - General - Other: $323,000
General - Other: $323,000
Correctional Institutions: $94,000
Correctional Institutions: $94,000
Parks and Recreation: $37,000
Parks and Recreation: $37,000
Health - Other: $7,000
Health - Other: $7,000
- Current Operations - General - Other: $8,995,000
General - Other: $8,647,000
Regular Highways: $6,219,000
Regular Highways: $5,979,000
Correctional Institutions: $5,728,000
Correctional Institutions: $5,507,000
Housing and Community Development: $2,774,000
Housing and Community Development: $2,667,000
Financial Administration: $1,045,000
Financial Administration: $1,005,000
Judicial and Legal Services: $904,000
Judicial and Legal Services: $869,000
Health - Other: $867,000
Health - Other: $833,000
Central Staff Services: $461,000
Central Staff Services: $443,000
Parks and Recreation: $240,000
Parks and Recreation: $231,000
Transit Utilities: $163,000
Transit Utilities: $163,000
General Public Buildings: $54,000
General Public Buildings: $52,000
Libraries: $50,000
Libraries: $48,000
Public Welfare - Other: $3,000
Public Welfare - Other: $3,000
- Federal Intergovernmental - Other: $145,000
Other: $145,000
- Local Intergovernmental - Other: $412,000
Other: $412,000
- Miscellaneous - General Revenue - Other: $20,241,000
General Revenue - Other: $15,047,000
Interest Earnings: $159,000
Interest Earnings: $118,000
Royalties: $1,000
Royalties: $1,000
- Other Funds - Cash and Securities: $18,000,000
Cash and Securities: $18,000,000
- Sinking Funds - Cash and Securities: $2,289,000
Cash and Securities: $2,289,000
- State Intergovernmental - Highways: $4,159,000
Highways: $4,016,000
Other: $299,000
Other: $289,000
General Local Government Support: $75,000
General Local Government Support: $73,000
Health and Hospitals: $9,000
Health and Hospitals: $8,000
- Tax - Property: $8,273,000
Property: $7,844,000
Johnston County government finances - Revenue in 2020:
- Bond Funds - Cash and Securities: $2,469,000
Cash and Securities: $2,469,000
- Charges - Other: $2,415,000
Other: $2,415,000
Regular Highways: $139,000
Regular Highways: $139,000
Parks and Recreation: $113,000
Parks and Recreation: $113,000
Housing and Community Development: $19,000
Housing and Community Development: $19,000
- Construction - General - Other: $323,000
General - Other: $323,000
Correctional Institutions: $94,000
Correctional Institutions: $94,000
Parks and Recreation: $37,000
Parks and Recreation: $37,000
Health - Other: $7,000
Health - Other: $7,000
- Current Operations - General - Other: $8,995,000
General - Other: $8,647,000
Regular Highways: $6,219,000
Regular Highways: $5,979,000
Correctional Institutions: $5,728,000
Correctional Institutions: $5,507,000
Housing and Community Development: $2,774,000
Housing and Community Development: $2,667,000
Financial Administration: $1,045,000
Financial Administration: $1,005,000
Judicial and Legal Services: $904,000
Judicial and Legal Services: $869,000
Health - Other: $867,000
Health - Other: $833,000
Central Staff Services: $461,000
Central Staff Services: $443,000
Parks and Recreation: $240,000
Parks and Recreation: $231,000
Transit Utilities: $163,000
Transit Utilities: $163,000
General Public Buildings: $54,000
General Public Buildings: $52,000
Libraries: $50,000
Libraries: $48,000
Public Welfare - Other: $3,000
Public Welfare - Other: $3,000
- Federal Intergovernmental - Other: $145,000
Other: $145,000
- Local Intergovernmental - Other: $412,000
Other: $412,000
- Miscellaneous - General Revenue - Other: $20,241,000
General Revenue - Other: $15,047,000
Interest Earnings: $159,000
Interest Earnings: $118,000
Royalties: $1,000
Royalties: $1,000
- Other Funds - Cash and Securities: $18,000,000
Cash and Securities: $18,000,000
- Sinking Funds - Cash and Securities: $2,289,000
Cash and Securities: $2,289,000
- State Intergovernmental - Highways: $4,159,000
Highways: $4,016,000
Other: $299,000
Other: $289,000
General Local Government Support: $75,000
General Local Government Support: $73,000
Health and Hospitals: $9,000
Health and Hospitals: $8,000
- Tax - Property: $8,273,000
Property: $7,844,000
Johnston County government finances - Debt in 2020:
- Bond Funds - Cash and Securities: $2,469,000
Cash and Securities: $2,469,000
- Charges - Other: $2,415,000
Other: $2,415,000
Regular Highways: $139,000
Regular Highways: $139,000
Parks and Recreation: $113,000
Parks and Recreation: $113,000
Housing and Community Development: $19,000
Housing and Community Development: $19,000
- Construction - General - Other: $323,000
General - Other: $323,000
Correctional Institutions: $94,000
Correctional Institutions: $94,000
Parks and Recreation: $37,000
Parks and Recreation: $37,000
Health - Other: $7,000
Health - Other: $7,000
- Current Operations - General - Other: $8,995,000
General - Other: $8,647,000
Regular Highways: $6,219,000
Regular Highways: $5,979,000
Correctional Institutions: $5,728,000
Correctional Institutions: $5,507,000
Housing and Community Development: $2,774,000
Housing and Community Development: $2,667,000
Financial Administration: $1,045,000
Financial Administration: $1,005,000
Judicial and Legal Services: $904,000
Judicial and Legal Services: $869,000
Health - Other: $867,000
Health - Other: $833,000
Central Staff Services: $461,000
Central Staff Services: $443,000
Parks and Recreation: $240,000
Parks and Recreation: $231,000
Transit Utilities: $163,000
Transit Utilities: $163,000
General Public Buildings: $54,000
General Public Buildings: $52,000
Libraries: $50,000
Libraries: $48,000
Public Welfare - Other: $3,000
Public Welfare - Other: $3,000
- Federal Intergovernmental - Other: $145,000
Other: $145,000
- Local Intergovernmental - Other: $412,000
Other: $412,000
- Miscellaneous - General Revenue - Other: $20,241,000
General Revenue - Other: $15,047,000
Interest Earnings: $159,000
Interest Earnings: $118,000
Royalties: $1,000
Royalties: $1,000
- Other Funds - Cash and Securities: $18,000,000
Cash and Securities: $18,000,000
- Sinking Funds - Cash and Securities: $2,289,000
Cash and Securities: $2,289,000
- State Intergovernmental - Highways: $4,159,000
Highways: $4,016,000
Other: $299,000
Other: $289,000
General Local Government Support: $75,000
General Local Government Support: $73,000
Health and Hospitals: $9,000
Health and Hospitals: $8,000
- Tax - Property: $8,273,000
Property: $7,844,000
Johnston County government finances - Cash and Securities in 2020:
- Bond Funds - Cash and Securities: $2,469,000
Cash and Securities: $2,469,000
- Charges - Other: $2,415,000
Other: $2,415,000
Regular Highways: $139,000
Regular Highways: $139,000
Parks and Recreation: $113,000
Parks and Recreation: $113,000
Housing and Community Development: $19,000
Housing and Community Development: $19,000
- Construction - General - Other: $323,000
General - Other: $323,000
Correctional Institutions: $94,000
Correctional Institutions: $94,000
Parks and Recreation: $37,000
Parks and Recreation: $37,000
Health - Other: $7,000
Health - Other: $7,000
- Current Operations - General - Other: $8,995,000
General - Other: $8,647,000
Regular Highways: $6,219,000
Regular Highways: $5,979,000
Correctional Institutions: $5,728,000
Correctional Institutions: $5,507,000
Housing and Community Development: $2,774,000
Housing and Community Development: $2,667,000
Financial Administration: $1,045,000
Financial Administration: $1,005,000
Judicial and Legal Services: $904,000
Judicial and Legal Services: $869,000
Health - Other: $867,000
Health - Other: $833,000
Central Staff Services: $461,000
Central Staff Services: $443,000
Parks and Recreation: $240,000
Parks and Recreation: $231,000
Transit Utilities: $163,000
Transit Utilities: $163,000
General Public Buildings: $54,000
General Public Buildings: $52,000
Libraries: $50,000
Libraries: $48,000
Public Welfare - Other: $3,000
Public Welfare - Other: $3,000
- Federal Intergovernmental - Other: $145,000
Other: $145,000
- Local Intergovernmental - Other: $412,000
Other: $412,000
- Miscellaneous - General Revenue - Other: $20,241,000
General Revenue - Other: $15,047,000
Interest Earnings: $159,000
Interest Earnings: $118,000
Royalties: $1,000
Royalties: $1,000
- Other Funds - Cash and Securities: $18,000,000
Cash and Securities: $18,000,000
- Sinking Funds - Cash and Securities: $2,289,000
Cash and Securities: $2,289,000
- State Intergovernmental - Highways: $4,159,000
Highways: $4,016,000
Other: $299,000
Other: $289,000
General Local Government Support: $75,000
General Local Government Support: $73,000
Health and Hospitals: $9,000
Health and Hospitals: $8,000
- Tax - Property: $8,273,000
Property: $7,844,000
Supplemental Security Income (SSI) in 2006:
- Total number of recipients: 3,527
- Number of aged recipients: 472
- Number of blind and disabled recipients: 3,055
- Number of recipients under 18: 677
- Number of recipients between 18 and 64: 1,925
- Number of recipients older than 64: 925
- Number of recipients also receiving OASDI: 1,600
- Amount of payments (thousands of dollars): 1,451
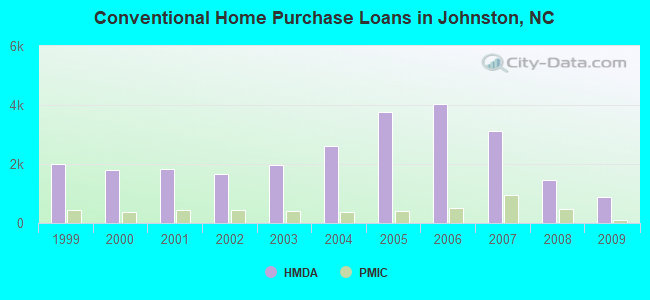
| Home Mortgage Disclosure Act Aggregated Statistics For Year 2009 (Based on 15 full tracts) | ||||||||||||||
| A) FHA, FSA/RHS & VA Home Purchase Loans | B) Conventional Home Purchase Loans | C) Refinancings | D) Home Improvement Loans | E) Loans on Dwellings For 5+ Families | F) Non-occupant Loans on < 5 Family Dwellings (A B C & D) | G) Loans On Manufactured Home Dwelling (A B C & D) | ||||||||
|---|---|---|---|---|---|---|---|---|---|---|---|---|---|---|
| Number | Average Value | Number | Average Value | Number | Average Value | Number | Average Value | Number | Average Value | Number | Average Value | Number | Average Value | |
| LOANS ORIGINATED | 1,179 | $152,881 | 891 | $154,569 | 3,702 | $163,033 | 149 | $62,195 | 3 | $288,333 | 296 | $117,503 | 213 | $74,211 |
| APPLICATIONS APPROVED, NOT ACCEPTED | 42 | $162,190 | 62 | $116,355 | 272 | $165,824 | 23 | $64,435 | 0 | $0 | 29 | $97,241 | 36 | $61,583 |
| APPLICATIONS DENIED | 211 | $135,967 | 137 | $103,788 | 1,103 | $154,694 | 134 | $41,425 | 0 | $0 | 84 | $103,869 | 142 | $70,268 |
| APPLICATIONS WITHDRAWN | 127 | $152,386 | 124 | $171,040 | 849 | $158,419 | 28 | $69,893 | 0 | $0 | 48 | $116,521 | 37 | $90,486 |
| FILES CLOSED FOR INCOMPLETENESS | 25 | $165,040 | 17 | $185,706 | 233 | $162,064 | 24 | $38,792 | 0 | $0 | 7 | $108,143 | 12 | $73,000 |
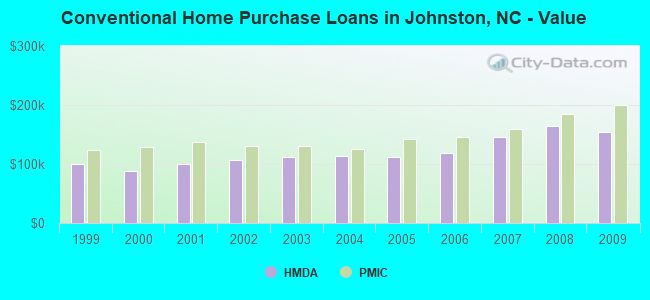
| Private Mortgage Insurance Companies Aggregated Statistics For Year 2009 (Based on 15 full tracts) | ||||||||
| A) Conventional Home Purchase Loans | B) Refinancings | C) Non-occupant Loans on < 5 Family Dwellings (A & B) | D) Loans On Manufactured Home Dwelling (A & B) | |||||
|---|---|---|---|---|---|---|---|---|
| Number | Average Value | Number | Average Value | Number | Average Value | Number | Average Value | |
| LOANS ORIGINATED | 103 | $199,621 | 167 | $190,323 | 8 | $154,375 | 1 | $200,000 |
| APPLICATIONS APPROVED, NOT ACCEPTED | 34 | $235,588 | 60 | $192,700 | 2 | $247,000 | 0 | $0 |
| APPLICATIONS DENIED | 15 | $254,133 | 26 | $211,885 | 3 | $230,333 | 0 | $0 |
| APPLICATIONS WITHDRAWN | 1 | $150,000 | 8 | $236,500 | 0 | $0 | 0 | $0 |
| FILES CLOSED FOR INCOMPLETENESS | 2 | $201,000 | 5 | $181,000 | 0 | $0 | 0 | $0 |
| Most common first names in Johnston County, NC among deceased individuals | ||
| Name | Count | Lived (average) |
|---|---|---|
| James | 899 | 68.7 years |
| William | 681 | 72.1 years |
| Mary | 535 | 76.1 years |
| John | 523 | 72.6 years |
| Robert | 317 | 70.2 years |
| Joseph | 261 | 72.2 years |
| George | 245 | 71.2 years |
| Willie | 234 | 71.5 years |
| Charles | 231 | 67.5 years |
| Annie | 219 | 79.0 years |
| Most common last names in Johnston County, NC among deceased individuals | ||
| Last name | Count | Lived (average) |
|---|---|---|
| Johnson | 688 | 74.1 years |
| Lee | 421 | 74.1 years |
| Jones | 407 | 72.0 years |
| Williams | 364 | 70.3 years |
| Creech | 318 | 75.5 years |
| Allen | 311 | 72.3 years |
| Barbour | 289 | 74.4 years |
| Smith | 281 | 73.0 years |
| Sanders | 254 | 73.7 years |
| Mclamb | 225 | 74.6 years |
| Businesses in Johnston County, NC | ||||
| Name | Count | Name | Count | |
|---|---|---|---|---|
| AT&T | 2 | Journeys | 1 | |
| Ace Hardware | 1 | Just Tires | 1 | |
| Advance Auto Parts | 5 | Justice | 1 | |
| Aeropostale | 1 | KFC | 6 | |
| Ann Taylor | 1 | Kmart | 1 | |
| Applebee's | 1 | Kroger | 2 | |
| Arby's | 3 | La-Z-Boy | 1 | |
| Ashley Furniture | 1 | Lane Bryant | 1 | |
| AutoZone | 5 | Levi Strauss & Co. | 1 | |
| Banana Republic | 1 | Little Caesars Pizza | 3 | |
| Baskin-Robbins | 1 | Lowe's | 1 | |
| Bath & Body Works | 1 | MasterBrand Cabinets | 6 | |
| Best Western | 2 | Maurices | 1 | |
| Blockbuster | 2 | McDonald's | 11 | |
| Brooks Brothers | 1 | Microtel | 1 | |
| Burger King | 6 | Motel 6 | 1 | |
| CVS | 6 | Motherhood Maternity | 1 | |
| Casual Male XL | 1 | New Balance | 1 | |
| Catherines | 1 | New York & Co | 1 | |
| Chevrolet | 2 | Nike | 6 | |
| Chick-Fil-A | 1 | Office Depot | 1 | |
| Chico's | 1 | OfficeMax | 1 | |
| Church's Chicken | 1 | Outback | 1 | |
| Clarks | 1 | Outback Steakhouse | 1 | |
| Cold Stone Creamery | 1 | Pac Sun | 1 | |
| Comfort Inn | 1 | Papa John's Pizza | 3 | |
| Comfort Suites | 2 | Payless | 1 | |
| Cracker Barrel | 1 | Pizza Hut | 3 | |
| Cricket Wireless | 6 | Popeyes | 1 | |
| Curves | 1 | Quality | 1 | |
| Dairy Queen | 3 | Quiznos | 4 | |
| Days Inn | 3 | RadioShack | 2 | |
| Dennys | 2 | Rite Aid | 3 | |
| Domino's Pizza | 3 | Ruby Tuesday | 2 | |
| DressBarn | 2 | Rue21 | 1 | |
| Dressbarn | 2 | SAS Shoes | 1 | |
| Dunkin Donuts | 8 | Sears | 1 | |
| Econo Lodge | 1 | Skechers USA | 1 | |
| Eddie Bauer | 1 | Sleep Inn | 1 | |
| FedEx | 21 | Sprint Nextel | 4 | |
| Firestone Complete Auto Care | 1 | Starbucks | 2 | |
| Ford | 2 | Subway | 10 | |
| GNC | 3 | Super 8 | 3 | |
| GameStop | 3 | T-Mobile | 5 | |
| Gap | 1 | Taco Bell | 4 | |
| Goodwill | 1 | Talbots | 1 | |
| Gymboree | 1 | True Value | 2 | |
| H&R Block | 5 | U-Haul | 14 | |
| Hardee's | 4 | U.S. Cellular | 1 | |
| Hilton | 1 | UPS | 23 | |
| Holiday Inn | 1 | Vans | 1 | |
| IZOD | 1 | Waffle House | 6 | |
| J.Crew | 1 | Walgreens | 4 | |
| Jones New York | 2 | Walmart | 3 | |
Johnston County on our top lists:
- #23 on the list of "Top 101 counties with the lowest percentage of residents that drank alcohol in the past 30 days"
- #25 on the list of "Top 101 counties with the smallest number of people without health insurance coverage in 2000 (pop. 50,000+)"
- #49 on the list of "Top 101 counties with the largest number of people moving in compared to moving out (pop. 50,000+)"
- #52 on the list of "Top 101 counties with the worst general health status score of residents (1-5), 3 years of data"
- #52 on the list of "Top 101 counties with the highest percentage of residents that keep firearms around their homes"
- #61 on the list of "Top 101 counties with the largest decrease in the number of births per 1000 residents 2000-2006 to 2007-2013 (pop 50,000+)"
- #70 on the list of "Top 101 counties with the lowest percentage of residents that visited a dentist within the past year"
- #96 on the list of "Top 101 counties with the highest percentage of residents that smoked 100+ cigarettes in their lives"
- #100 on the list of "Top 101 counties with the lowest percentage of residents that exercised in the past month"