Johnson County, Texas (TX)
County owner-occupied free and clear houses and condos in 2010: 13,106
County owner-occupied houses and condos in 2000: 34,420
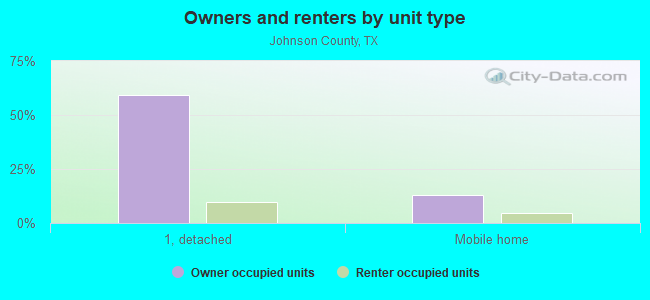
Renter-occupied apartments: 12,495 (it was 9,216 in 2000)
| % of renters here: | 21% |
| State: | 36% |
Land area: 729 sq. mi.
Water area: 5.0 sq. mi.
Population density: 268 people per square mile (high).
Industries providing employment: Educational, health and social services (21.9%), Retail trade (17.1%), Manufacturing (10.7%).
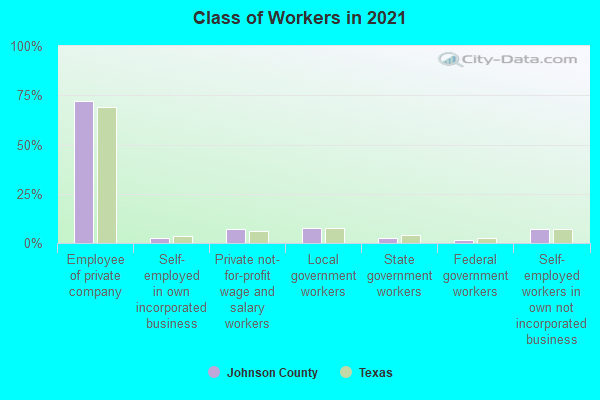
Type of workers:
- Private wage or salary: 79%
- Government: 12%
- Self-employed, not incorporated: 8%
- Unpaid family work: 0%
- OSM Map
- General Map
- Google Map
- MSN Map

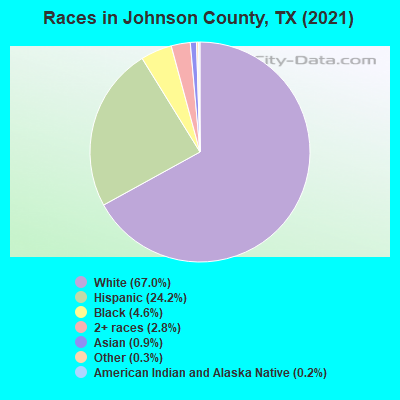
- 126,58064.7%White Non-Hispanic Alone
- 49,08925.1%Hispanic or Latino
- 8,9834.6%Black Non-Hispanic Alone
- 7,6643.9%Two or more races
- 2,0091.0%Asian alone
- 8070.4%Some other race alone
- 3740.2%American Indian and Alaska Native alone
| Median resident age: | 37.4 years |
| Texas median age: | 35.6 years |
| Males: 98,495 | |
| Females: 97,011 |

 | When will Sherman/Denison Be In DFW Metro? (68 replies) |
| How much bigger will DFW population be? (57 replies) |
| HEB announces Plano and Frisco stores (100 replies) |
| What are Texans' stance on Kansas? (55 replies) |
| General Relocation Advice! (37 replies) |
| General Relocation Advice (8 replies) |
| Johnson County: | 2.0 people |
| Texas: | 3 people |
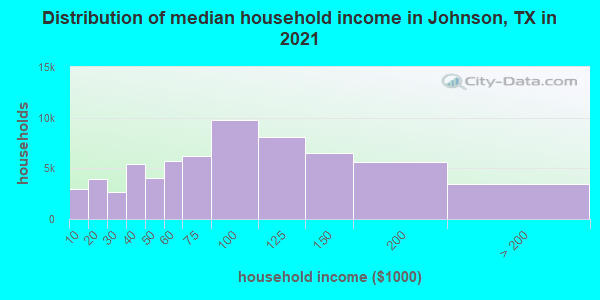
Estimated median household income in 2022: $76,320 ($44,621 in 1999)
| This county: | $76,320 |
| Texas: | $72,284 |
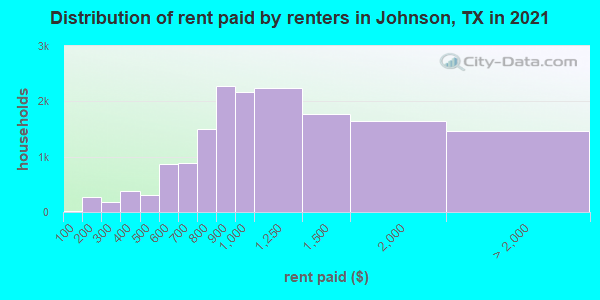
Median contract rent in 2022 for apartments: $1,042 (lower quartile is $787, upper quartile is $1,310)
| This county: | $1042 |
| State: | $1117 |
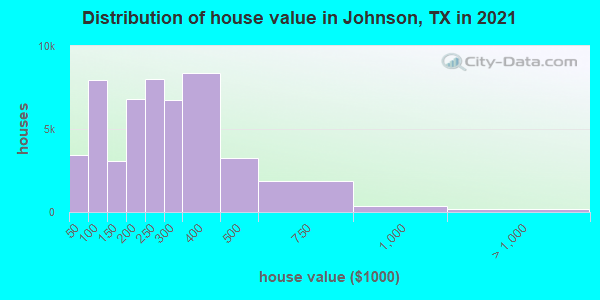
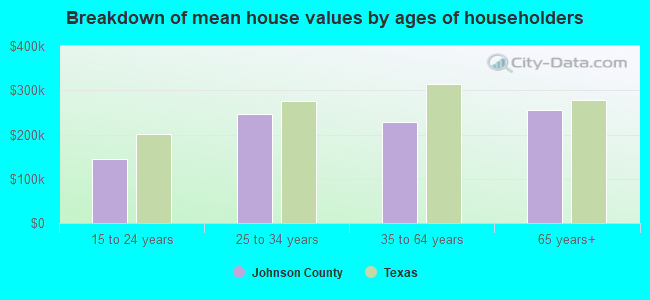
Estimated median house or condo value in 2022: $284,500 (it was $76,000 in 2000)
| Johnson: | $284,500 |
| Texas: | $275,400 |
Mean price in 2022:
Median monthly housing costs for homes and condos with a mortgage: $1,818Detached houses: $335,354
Here: $335,354 State: $369,058 Townhouses or other attached units: $375,347
Here: $375,347 State: $327,631 In 2-unit structures: $249,037
Here: $249,037 State: $374,947 In 3-to-4-unit structures: $156,555
Here: $156,555 State: $209,652 In 5-or-more-unit structures: $279,141
Here: $279,141 State: $413,944 Mobile homes: $147,755
Here: $147,755 State: $124,413 Occupied boats, RVs, vans, etc.: $33,472
Here: $33,472 State: $73,921
Median monthly housing costs for units without a mortgage: $649
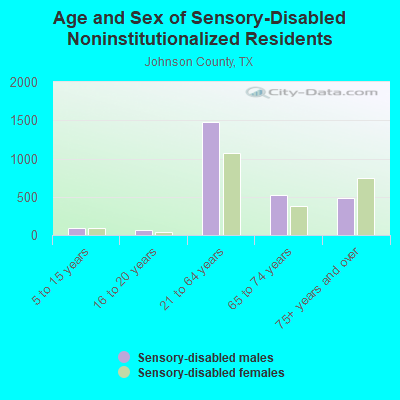
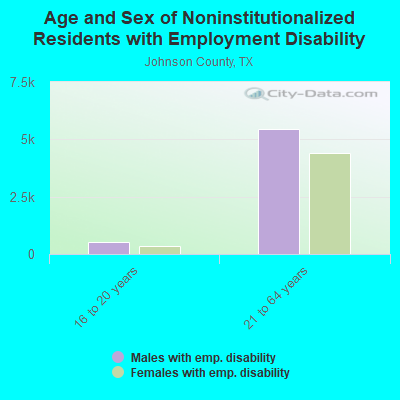
Institutionalized population: 2,199
Crime in 2021 (reported by the sheriff's office or county police, not the county total):
- Murders: 2
- Rapes: 45
- Robberies: 7
- Assaults: 146
- Burglaries: 102
- Thefts: 388
- Auto thefts: 83
Crime in 2020 (reported by the sheriff's office or county police, not the county total):
- Murders: 1
- Rapes: 34
- Robberies: 9
- Assaults: 144
- Burglaries: 151
- Thefts: 407
- Auto thefts: 85
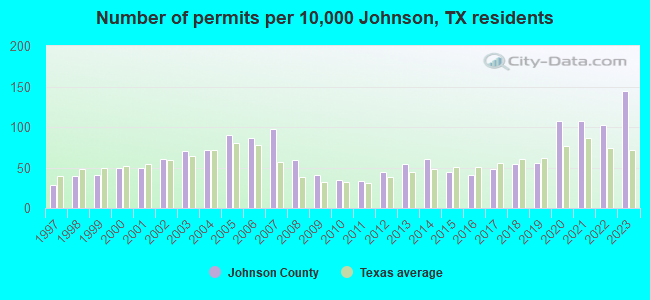
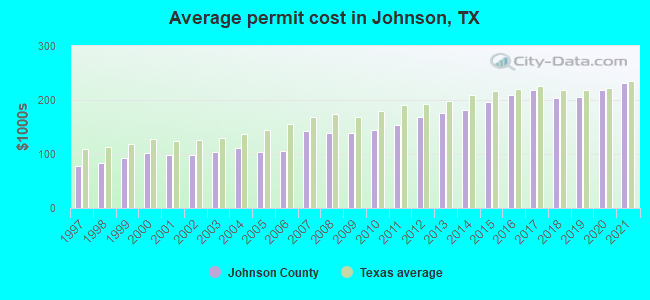
Single-family new house construction building permits:
- 2022: 1292 buildings, average cost: $248,500
- 2021: 1358 buildings, average cost: $232,000
- 2020: 1365 buildings, average cost: $217,700
- 2019: 712 buildings, average cost: $205,900
- 2018: 683 buildings, average cost: $204,400
- 2017: 604 buildings, average cost: $219,000
- 2016: 516 buildings, average cost: $208,900
- 2015: 558 buildings, average cost: $196,300
- 2014: 774 buildings, average cost: $182,300
- 2013: 691 buildings, average cost: $175,800
- 2012: 558 buildings, average cost: $168,400
- 2011: 415 buildings, average cost: $154,300
- 2010: 436 buildings, average cost: $144,700
- 2009: 514 buildings, average cost: $138,500
- 2008: 750 buildings, average cost: $139,100
- 2007: 1240 buildings, average cost: $142,400
- 2006: 1086 buildings, average cost: $106,100
- 2005: 1145 buildings, average cost: $104,300
- 2004: 911 buildings, average cost: $112,100
- 2003: 894 buildings, average cost: $103,000
- 2002: 755 buildings, average cost: $98,500
- 2001: 618 buildings, average cost: $99,200
- 2000: 639 buildings, average cost: $100,700
- 1999: 514 buildings, average cost: $92,700
- 1998: 496 buildings, average cost: $84,100
- 1997: 361 buildings, average cost: $77,300
Median real estate property taxes paid for housing units with mortgages in 2022: $4,568 (1.5%)
Median real estate property taxes paid for housing units with no mortgage in 2022: $2,265 (0.9%)
| Johnson County: | 9.9% |
| Texas: | 14.0% |
Median age of residents in 2022: 37.4 years old
(Males: 35.7 years old, Females: 38.4 years old)
(Median age for: White residents: 42.0 years old, Black residents: 32.0 years old, American Indian residents: 44.9 years old, Asian residents: 34.7 years old, Hispanic or Latino residents: 29.1 years old, Other race residents: 29.3 years old)
Area name: Fort Worth-Arlington, TX HUD Metro FMR Area
Fair market rent in 2006 for a 1-bedroom apartment in Johnson County is $589 a month.
Fair market rent for a 2-bedroom apartment is $725 a month.
Fair market rent for a 3-bedroom apartment is $983 a month.
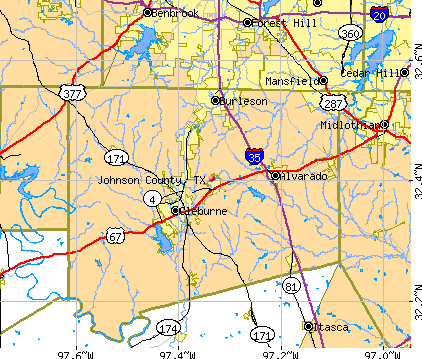
Cities in this county include: Cleburne, Burleson, Keene, Joshua, Alvarado, Grandview, Venus, Godley, Rio Vista, Briaroaks.
2023 air pollution in Johnson County:
Ozone (1-hour): 0.033 ppm (standard limit: 0.12 ppm). Near U.S. average.
Notable locations in this county outside city limits:
Notable locations in Johnson County: Camp Hoblitzelle (A), Center Point (B), Derrs Chapel (C), Lone Elm (D), Avalon Volunteer Fire Department (E), Central High Rural Volunteer Fire Department (F), Forreston Volunteer Fire Department (G), Garrett Area Rural Volunteer Fire Department Main Station (H), Telico Volunteer Fire Department (I), Ennis Railroad and Cultural Heritage Museum (J). Display/hide their locations on the map
Churches in Johnson County include: Shiloh Cumberland Church (A), Telico Church (B), True Vine Church (C), Weavers Chapel (D), Zion Hill Church (E), Austonia Church (F), Bell Branch Church (G), Bethel Church (H), Cedar Grove Church (I). Display/hide their locations on the map
Cemeteries: Walnut Springs Cemetery (1), Sardis Cemetery (2), Smith Cemetery (3), Auburn Cemetery (4), Austonia Cemetery (5), Bardwell Cemetery (6), Bee Creek Cemetery (7). Display/hide their locations on the map
Lakes and reservoirs: Sand Lake (A), Massey Lake (B), Cutoff Slough (C), Fort Lake (D), Lake Clopton (E), Bardwell Lake (F), Soil Conservation Service Site 102 Reservoir (G), Soil Conservation Service Site 83 Reservoir (H). Display/hide their locations on the map
Streams, rivers, and creeks: Wolf Branch (A), White Rock Branch (B), West Soap Creek (C), Weakly Branch (D), Walker Creek (E), Village Creek (F), Valley Branch (G), Spring Branch (H), South Fork Chambers Creek (I). Display/hide their locations on the map
Parks in Johnson County include: Little Mustang Creek Park (1), High View Park (2), Mott Park (3), Lower Love Park (4), Waxahachie Creek Park (5), Yellow Jacket Stadium (6), Bluebonnet City Park (7), Big Mustang Creek Park (8). Display/hide their locations on the map
Neighboring counties: De Soto Parish, Louisiana  , Crawford County, Georgia , Sumter County, Alabama , Wilcox County, Alabama , Hood County
  , Panola County , Tarrant County
  .
.
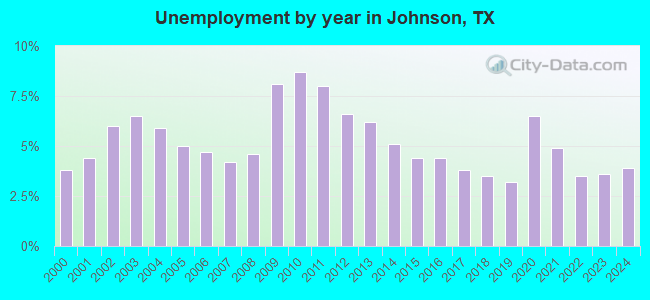
| Here: | 3.2% |
| Texas: | 3.5% |
Current college students: 4,806
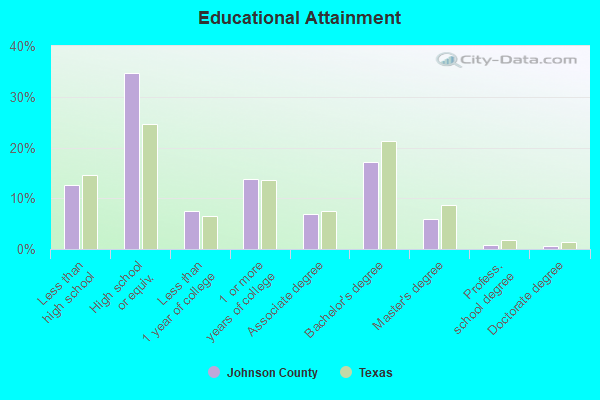
People 25 years of age or older with a high school degree or higher: 88.8%
People 25 years of age or older with a bachelor's degree or higher: 24.0%
Number of foreign born residents: 15,274 (42.8% naturalized citizens)
| Johnson County: | 7.8% |
| Whole state: | 17.2% |
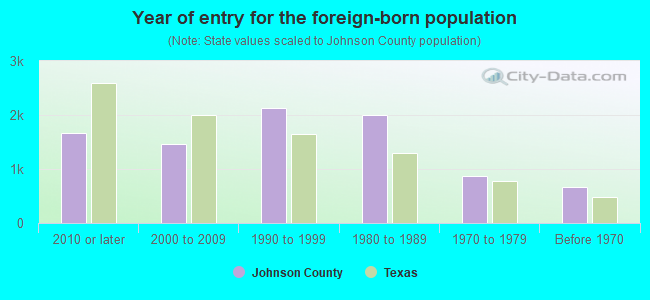
- Year of entry for the foreign-born population
- 2,5082010 or later
- 2,0262000 to 2009
- 2,6701990 to 1999
- 2,0001980 to 1989
- 8701970 to 1979
- 666Before 1970
Mean travel time to work (commute): minutes
Percentage of county residents living and working in this county: 99.8%
Housing units in structures:
- One, detached: 48,081
- One, attached: 1,470
- Two: 649
- 3 or 4: 2,900
- 5 to 9: 2,294
- 10 to 19: 752
- 20 to 49: 1,167
- 50 or more: 1,624
- Mobile homes: 11,259
- Boats, RVs, vans, etc.: 673
Housing units in Johnson County with a mortgage: 28,437 (1,049 second mortgage, 49 home equity loan, 597 both second mortgage and home equity loan)
Houses without a mortgage: 278
| Here: | 9.2% with mortgage |
| State: | 98.4% with mortgage |
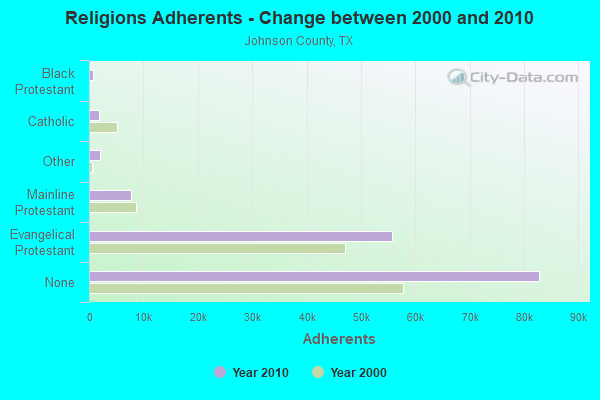
Religion statistics for Johnson County
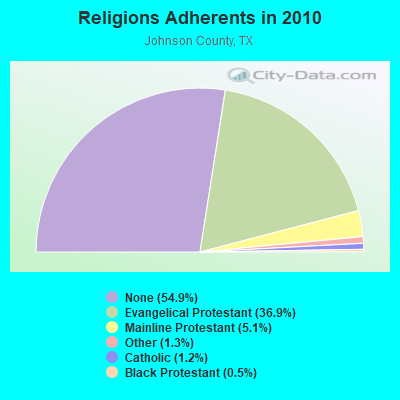
| Religion | Adherents | Congregations |
|---|---|---|
| Evangelical Protestant | 55,674 | 163 |
| Mainline Protestant | 7,711 | 18 |
| Other | 2,014 | 6 |
| Catholic | 1,878 | 1 |
| Black Protestant | 823 | 6 |
| None | 82,834 | - |
Source: Clifford Grammich, Kirk Hadaway, Richard Houseal, Dale E.Jones, Alexei Krindatch, Richie Stanley and Richard H.Taylor. 2012. 2010 U.S.Religion Census: Religious Congregations & Membership Study. Association of Statisticians of American Religious Bodies. Jones, Dale E., et al. 2002. Congregations and Membership in the United States 2000. Nashville, TN: Glenmary Research Center.
Food Environment Statistics:
| Johnson County: | 1.00 / 10,000 pop. |
| State: | 1.47 / 10,000 pop. |
| Here: | 0.13 / 10,000 pop. |
| Texas: | 0.14 / 10,000 pop. |
| This county: | 0.47 / 10,000 pop. |
| Texas: | 1.11 / 10,000 pop. |
| Johnson County: | 3.68 / 10,000 pop. |
| Texas: | 3.95 / 10,000 pop. |
| This county: | 3.82 / 10,000 pop. |
| State: | 6.13 / 10,000 pop. |
| Johnson County: | 9.4% |
| Texas: | 8.9% |
| Johnson County: | 28.7% |
| State: | 26.6% |
| Here: | 13.7% |
| State: | 15.7% |
Agriculture in Johnson County:
Average size of farms: 140 acresAverage value of agricultural products sold per farm: $16,906
Average value of crops sold per acre for harvested cropland: $83.52
The value of nursery, greenhouse, floriculture, and sod as a percentage of the total market value of agricultural products sold: 1.21%
The value of livestock, poultry, and their products as a percentage of the total market value of agricultural products sold: 84.51%
Average total farm production expenses per farm: $19,332
Harvested cropland as a percentage of land in farms: 22.34%
Irrigated harvested cropland as a percentage of land in farms: 0.75%
Average market value of all machinery and equipment per farm: $23,935
The percentage of farms operated by a family or individual: 95.66%
Average age of principal farm operators: 55 years
Average number of cattle and calves per 100 acres of all land in farms: 18.65
Milk cows as a percentage of all cattle and calves: 11.97%
Corn for grain: 1539 harvested acres
All wheat for grain: 12769 harvested acres
Upland cotton: 623 harvested acres
Soybeans for beans: 394 harvested acres
Vegetables: 33 harvested acres
Land in orchards: 645 acres
Tornado activity:
Johnson County historical area-adjusted tornado activity is significantly below Texas state average. It is 1653146.7 times below overall U.S. average.Tornadoes in this county have caused 67 injuries recorded between 1950 and 2004.
On 4/28/1971, a category 2 (max. wind speeds 113-157 mph) tornado injured 20 people and caused between $50,000 and $500,000 in damages.
Earthquake activity:
Johnson County-area historical earthquake activity is significantly above Texas state average. It is 423% greater than the overall U.S. average.On 11/6/2011 at 03:53:10, a magnitude 5.7 (5.7 MW, Depth: 3.2 mi, Class: Moderate, Intensity: VI - VII) earthquake occurred 219.0 miles away from Johnson County center
On 9/3/2016 at 12:02:44, a magnitude 5.8 (5.8 MW, Depth: 3.5 mi) earthquake occurred 279.2 miles away from the county center
On 6/16/1978 at 11:46:54, a magnitude 5.3 (4.4 MB, 4.6 UK, 5.3 ML) earthquake occurred 204.2 miles away from the county center
On 5/17/2012 at 08:12:00, a magnitude 4.8 (4.8 MW, Depth: 3.1 mi, Class: Light, Intensity: IV - V) earthquake occurred 176.9 miles away from the county center
On 5/7/2015 at 22:58:05, a magnitude 4.0 (4.0 MW, Depth: 1.6 mi) earthquake occurred 14.8 miles away from Johnson County center
On 11/7/2016 at 01:44:24, a magnitude 5.0 (5.0 MW, Depth: 2.8 mi) earthquake occurred 250.1 miles away from the county center
Magnitude types: body-wave magnitude (MB), local magnitude (ML), moment magnitude (MW)
Most recent natural disasters:
- Texas Covid-19 Pandemic, Incident Period: January 20, 2020, FEMA Id: 4485, Natural disaster type: Other
- Texas Severe Storms, Tornadoes, Straight-line Winds, and Flooding, Incident Period: May 04, 2015 to June 23, 2015, Major Disaster (Presidential) Declared DR-4223: May 29, 2015, FEMA Id: 4223, Natural disaster type: Storm, Tornado, Flood, Wind
- Texas Wildfires, Incident Period: March 14, 2008 to September 01, 2008, Emergency Declared EM-3284: March 14, 2008, FEMA Id: 3284, Natural disaster type: Fire
- Texas Huntington Brook Fire, Incident Period: January 17, 2006, Fire Management Assistance Declared: January 19, 2006, FEMA Id: 2621, Natural disaster type: Fire
- Texas Extreme Wildfire Threat, Incident Period: November 27, 2005 to May 14, 2006, Major Disaster (Presidential) Declared DR-1624: January 11, 2006, FEMA Id: 1624, Natural disaster type: Fire
- Texas Hurricane Rita, Incident Period: September 23, 2005 to October 14, 2005, Major Disaster (Presidential) Declared DR-1606: September 24, 2005, FEMA Id: 1606, Natural disaster type: Hurricane
- Texas Hurricane Rita, Incident Period: September 20, 2005 to October 14, 2005, Emergency Declared EM-3261: September 21, 2005, FEMA Id: 3261, Natural disaster type: Hurricane
- Texas Hurricane Katrina, Incident Period: August 29, 2005 to October 01, 2005, Emergency Declared EM-3216: September 02, 2005, FEMA Id: 3216, Natural disaster type: Hurricane
- Texas Loss of the Space Shuttle Columbia, Incident Period: February 01, 2003, Emergency Declared EM-3171: February 01, 2003, FEMA Id: 3171, Natural disaster type: Other
- Texas Alsbury Fire, Incident Period: August 28, 2000 to September 13, 2000, Fire Management Assistance Declared: January 05, 2001, FEMA Id: 2351, Natural disaster type: Fire
- 5 other natural disasters have been reported since 1953.
The number of natural disasters in Johnson County (15) is near the US average (15).
Major Disasters (Presidential) Declared: 6
Emergencies Declared: 6
Causes of natural disasters: Fires: 6, Storms: 4, Floods: 3, Hurricanes: 3, Tornadoes: 3, Wind: 1, Other: 2 (Note: some incidents may be assigned to more than one category).
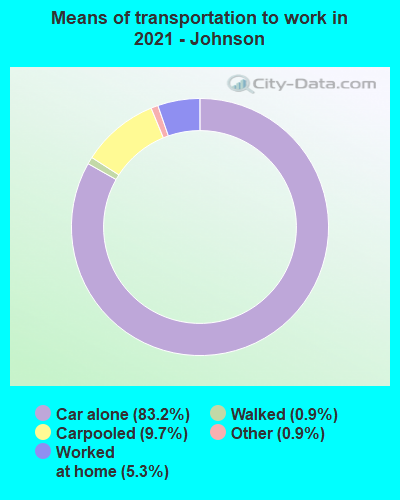
Means of transportation to work:
- Drove a car alone: 48,582 (77.6%)
- Carpooled: 6,101 (9.8%)
- Bus: 18 (0.0%)
- Taxicab, motorcycle, or other means: 411 (0.7%)
- Bicycle: 47 (0.1%)
- Walked: 519 (0.8%)
- Worked at home: 5,907 (9.4%)
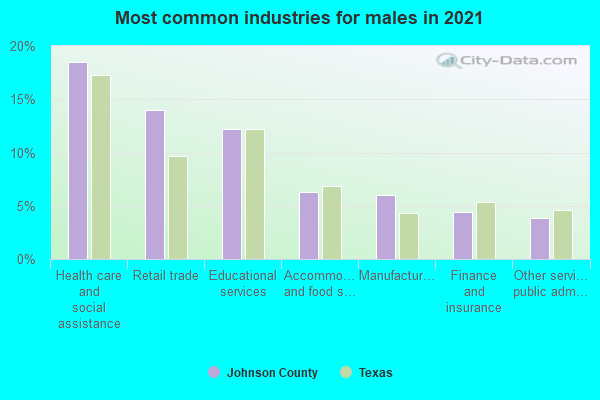
- Health care and social assistance (17%)
- Educational services (16%)
- Retail trade (11%)
- Manufacturing (6%)
- Accommodation and food services (6%)
- Finance and insurance (5%)
- Other services, except public administration (5%)
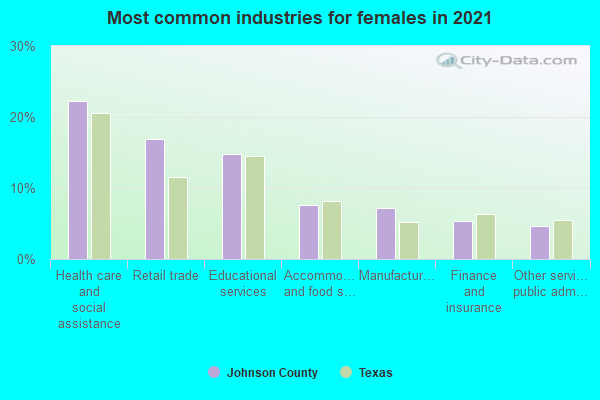
- Health care and social assistance (19%)
- Educational services (18%)
- Retail trade (13%)
- Manufacturing (7%)
- Accommodation and food services (6%)
- Finance and insurance (6%)
- Other services, except public administration (6%)
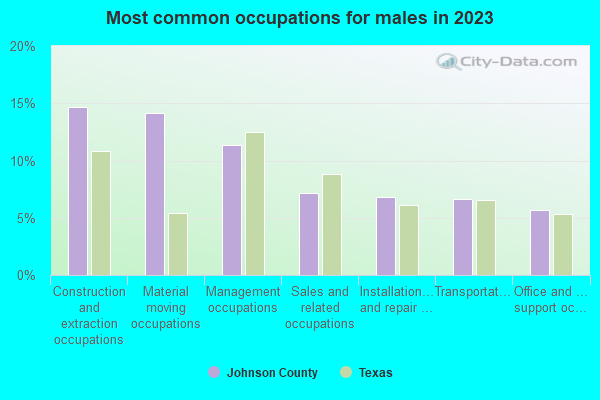
- Management occupations (12%)
- Construction and extraction occupations (12%)
- Material moving occupations (11%)
- Production occupations (10%)
- Sales and related occupations (10%)
- Installation, maintenance, and repair occupations (9%)
- Office and administrative support occupations (5%)
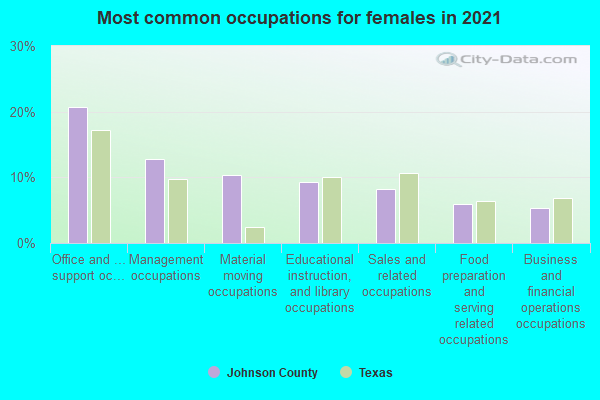
- Office and administrative support occupations (18%)
- Educational instruction, and library occupations (14%)
- Management occupations (10%)
- Material moving occupations (9%)
- Sales and related occupations (7%)
- Healthcare support occupations (7%)
- Business and financial operations occupations (7%)
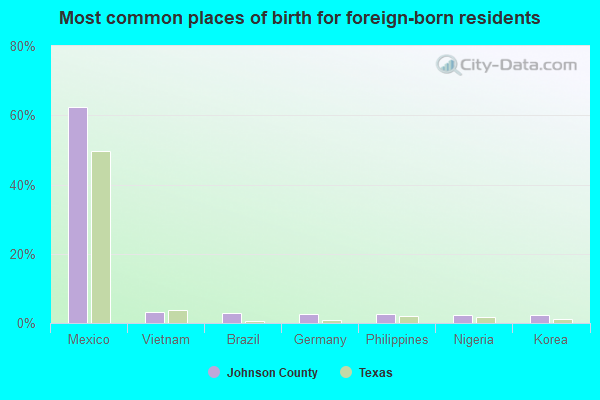
- Mexico (62%)
- Philippines (3%)
- Vietnam (2%)
- Brazil (2%)
- Korea (2%)
- Nigeria (2%)
- Germany (2%)
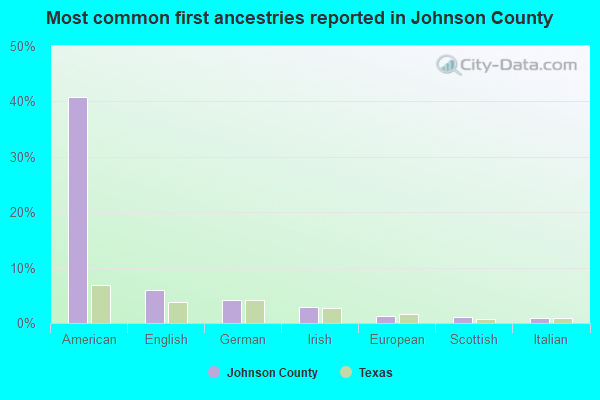
- American (40%)
- English (7%)
- German (4%)
- Irish (3%)
- European (1%)
- Scottish (1%)
- Italian (1%)
People in group quarters in Johnson County, Texas in 2010:
- 1,042 people in state prisons
- 677 people in nursing facilities/skilled-nursing facilities
- 478 people in local jails and other municipal confinement facilities
- 287 people in college/university student housing
- 69 people in group homes intended for adults
- 56 people in other noninstitutional facilities
- 33 people in workers' group living quarters and job corps centers
- 2 people in group homes for juveniles (non-correctional)
People in group quarters in Johnson County, Texas in 2000:
- 982 people in state prisons
- 777 people in nursing homes
- 302 people in local jails and other confinement facilities (including police lockups)
- 288 people in college dormitories (includes college quarters off campus)
- 108 people in homes for the mentally retarded
- 27 people in agriculture workers' dormitories on farms
- 5 people in unknown juvenile institutions
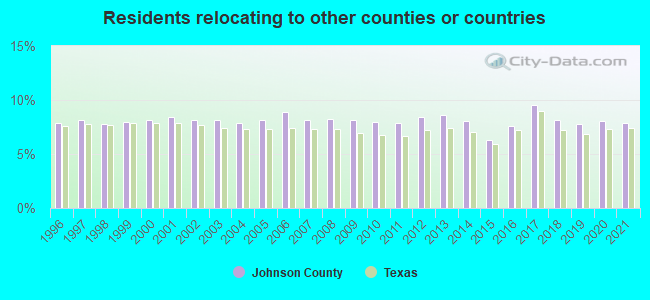
11.51% of this county's 2021 resident taxpayers lived in other counties in 2020 ($65,103 average adjusted gross income)
| Here: | 11.51% |
| Texas average: | 8.12% |
10 or fewer of this county's residents moved from foreign countries.
9.40% relocated from other counties in Texas ($53,266 average AGI)
2.11% relocated from other states ($11,837 average AGI)
Johnson County: 2.11% Texas average: 2.83%

Top counties from which taxpayers relocated into this county between 2020 and 2021:
| from Tarrant County, TX | |
| from Dallas County, TX | |
| from Ellis County, TX | |
| from Hood County, TX | |
| from Hill County, TX | |
| from Denton County, TX | |
| from Parker County, TX |
7.85% of this county's 2020 resident taxpayers moved to other counties in 2021 ($58,216 average adjusted gross income)
| Here: | 7.85% |
| Texas average: | 7.40% |
10 or fewer of this county's residents moved to foreign countries.
6.41% relocated to other counties in Texas ($45,606 average AGI)
1.44% relocated to other states ($12,610 average AGI)
Johnson County: 1.44% Texas average: 2.08%
Top counties to which taxpayers relocated from this county between 2020 and 2021:
| to Tarrant County, TX | |
| to Dallas County, TX | |
| to Ellis County, TX | |
| to Hood County, TX | |
| to Hill County, TX | |
| to Parker County, TX | |
| to Denton County, TX |
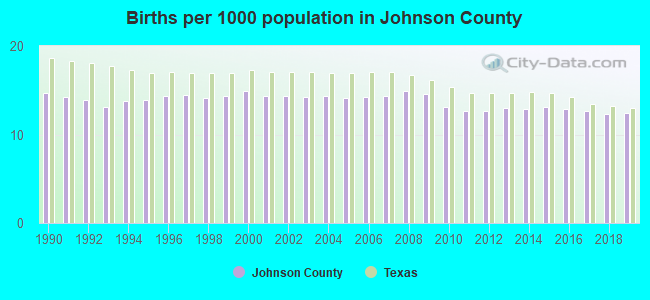
Births per 1000 population from 1990 to 1999: 14.1
Births per 1000 population from 2000 to 2009: 14.4
Births per 1000 population from 2010 to 2022: 10.7
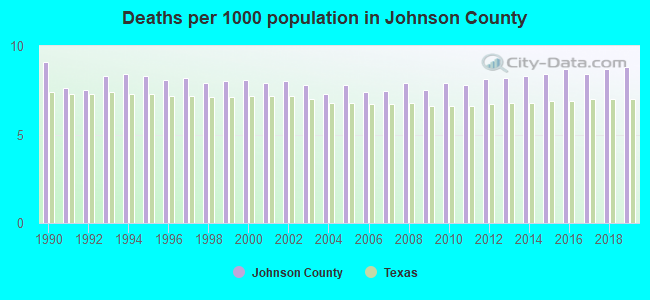
Deaths per 1000 population from 1990 to 1999: 8.1
Deaths per 1000 population from 2000 to 2009: 7.7
Deaths per 1000 population from 2010 to 2020: 8.5
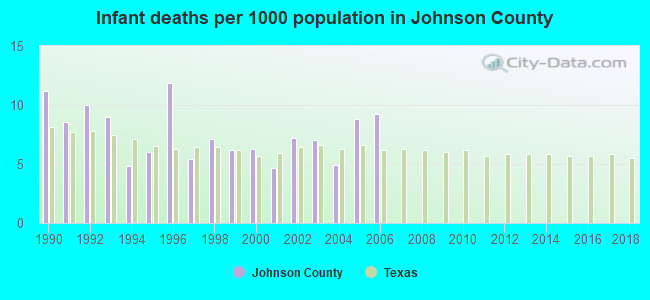
Infant deaths per 1000 live births from 1990 to 1999: 8.0
Infant deaths per 1000 live births from 2000 to 2006: 6.9
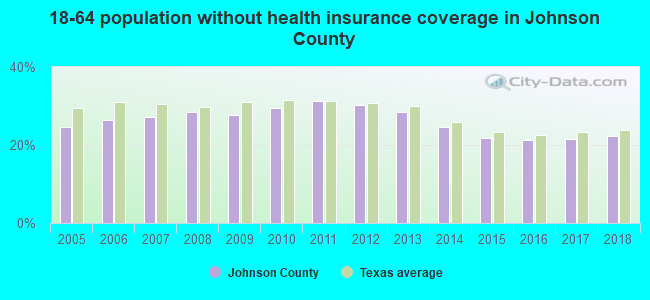
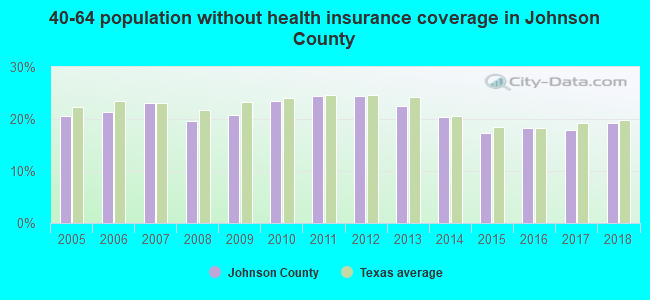
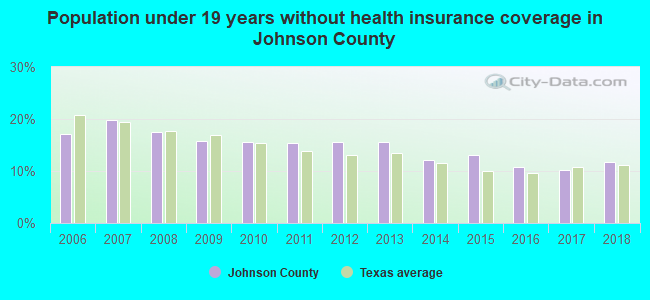
Persons under 19 years old without health insurance coverage in 2018: 11.7%
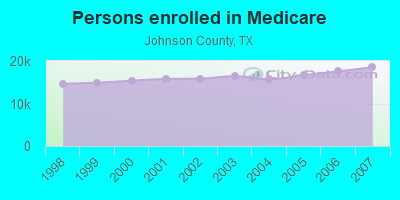
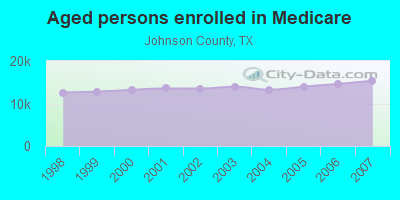
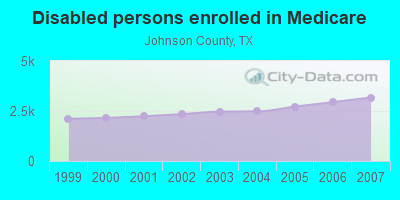
Persons enrolled in hospital insurance and/or supplemental medical insurance (Medicare) in July 1, 2007: 18,531 (15,357 aged, 3,174 disabled)
Children under 18 without health insurance coverage in 2007: 7,638 (19%)
Most common underlying causes of death in Johnson County, Texas in 1999 - 2019:
- Atherosclerotic heart disease (1,745)
- Bronchus or lung, unspecified - Malignant neoplasms (1,681)
- Acute myocardial infarction, unspecified (1,499)
- Chronic obstructive pulmonary disease, unspecified (1,250)
- Stroke, not specified as haemorrhage or infarction (851)
- Unspecified dementia (794)
- Congestive heart failure (791)
- Alzheimer disease, unspecified (757)
- Atherosclerotic cardiovascular disease, so described (506)
- Breast, unspecified - Malignant neoplasms (402)
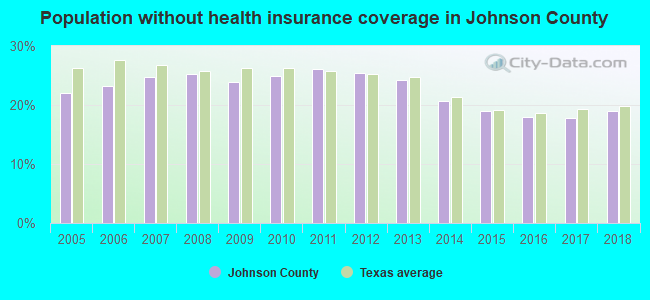
Population without health insurance coverage in 2000: 15%
Children under 18 without health insurance coverage in 2000: 14%
Short term general hospital admissions per 100,000 population in 2004: 2,844
Short term general hospital beds per 100,000 population in 2004: 87
Emergency room visits per 100,000 population in 2004: 15,973
General practice office based MDs per 100,000 population in 2005: 1,440
Medical specialist MDs per 100,000 population in 2005: 749
Total births per 100,000 population, July 2005 - July 2006 : 25
Total deaths per 100,000 population, July 2005 - July 2006: 64
Limited-service eating places per 100,000 population in 2005 : 7
Beer, wine & liquor stores per 100,000 population in 2005: 1
Homicides per 1,000,000 population from 2000 to 2006: 32.2. This is less than state average.
Suicides per 1,000,000 population from 2000 to 2006: 112.2. This is more than state average.
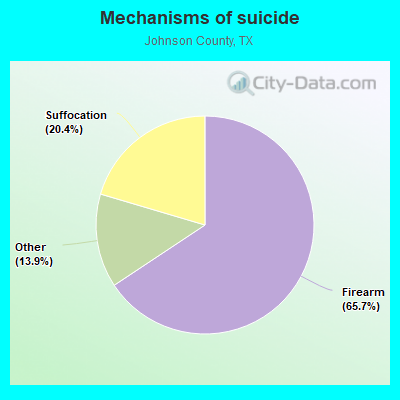
- Firearm - 73.7
- Suffocation - 22.9
- Other - 15.6
Household type by relationship:
Households: 195,506- Male householders: 33,959 (6,418 living alone), Female householders: 32,727 (8,370 living alone)
38,842 spouses (38,472 opposite-sex spouses), 2,886 unmarried partners, (2,854 opposite-sex unmarried partners), 62,488 children (57,314 natural, 1,546 adopted, 3,628 stepchildren), 5,617 grandchildren, 1,828 brothers or sisters, 5,250 parents, 0 foster children, 5,334 other relatives, 3,611 non-relatives
- In group quarters: 2,964
Size of family households: 19,276 2-persons, 11,061 3-persons, 11,125 4-persons, 4,581 5-persons, 3,103 6-persons, 873 7-or-more-persons.
Size of nonfamily households: 14,788 1-person, 1,704 2-persons, 175 3-persons.
33,848 married couples with children.
9,301 single-parent households (1,711 men, 7,590 women).
83.5% of residents of Johnson speak English at home.
14.3% of residents speak Spanish at home (60% speak English very well, 21% speak English well, 13% speak English not well, 6% don't speak English at all).
0.6% of residents speak other Indo-European language at home (63% speak English very well, 29% speak English well, 9% speak English not well).
1.1% of residents speak Asian or Pacific Island language at home (55% speak English very well, 31% speak English well, 14% speak English not well).
0.3% of residents speak other language at home (80% speak English very well, 20% speak English well).
In fiscal year 2004:
Federal Government expenditure: $503,443,000 ($3,510 per capita)
Department of Defense expenditure: $20,869,000
Federal direct payments to individuals for retirement and disability: $292,332,000
Federal other direct payments to individuals: $121,745,000
Federal direct payments not to individuals: $1,343,000
Federal grants: $66,920,000
Federal procurement contracts: $4,748,000 ($644,000 Department of Defense)
Federal salaries and wages: $16,356,000 ($73,000 Department of Defense)
Federal Government direct loans: $1,381,000
Federal guaranteed/insured loans: $182,674,000
Federal Government insurance: $53,867,000
Population change from April 1, 2000 to July 1, 2005:
Births: 10,107| Here: | 69 per 1000 residents |
| State: | 85 per 1000 residents |
Deaths: 5,660
| Here: | 39 per 1000 residents |
| State: | 35 per 1000 residents |
Net international migration: +1,467
| Here: | +10 per 1000 residents |
| State: | +29 per 1000 residents |
Net internal migration: +13,861
| Here: | +95 per 1000 residents |
| State: | +10 per 1000 residents |
Total withdrawal of fresh water for public supply: 12.89 millions of gallons per day (61% from ground, 39% from surface)
| Here: | 6.2 |
| State: | 6.3 |
| Here: | 4.4 |
| State: | 4.0 |
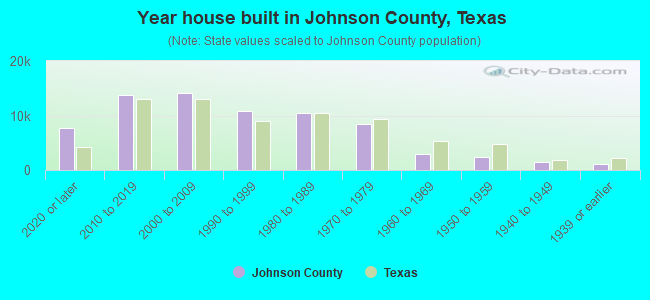
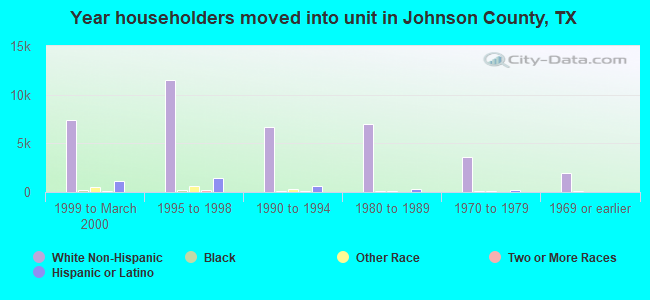
- Year house built in Johnson County, Texas
- 4,4342020 or later
- 14,5942010 to 2019
- 16,3652000 to 2009
- 6,9651990 to 1999
- 9,8371980 to 1989
- 9,7931970 to 1979
- 4,2091960 to 1969
- 1,6001950 to 1959
- 6711940 to 1949
- 2,4011939 or earlier
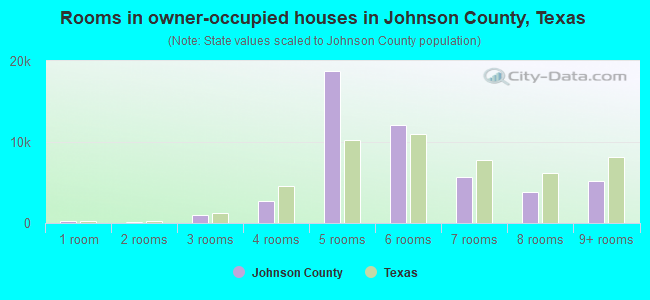
- Rooms in owner-occupied houses in Johnson County, Texas
- 6241 room
- 1322 rooms
- 1,2103 rooms
- 2,6754 rooms
- 11,3665 rooms
- 13,7336 rooms
- 7,7217 rooms
- 5,3948 rooms
- 7,3709+ rooms
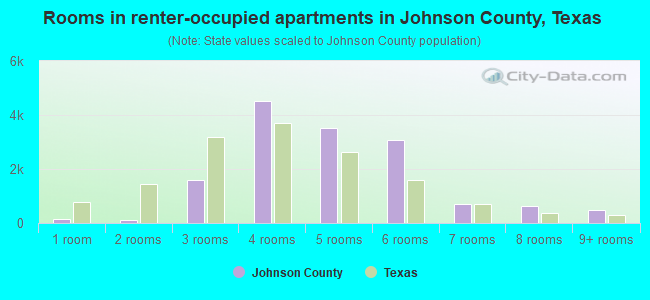
- Rooms in renter-occupied apartments in Johnson County, Texas
- 3481 room
- 9282 rooms
- 3,0633 rooms
- 4,1454 rooms
- 4,7285 rooms
- 1,7106 rooms
- 1,1467 rooms
- 1738 rooms
- 2209+ rooms
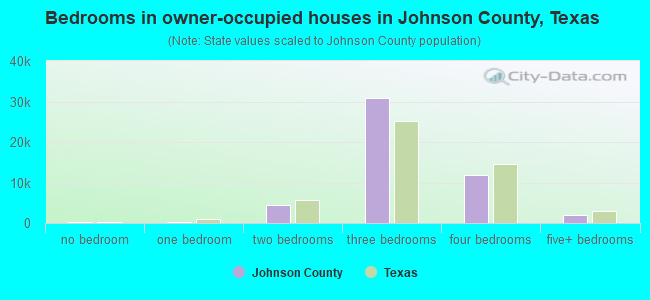
- Bedrooms in owner-occupied houses in Johnson County, Texas
- 624no bedroom
- 8431 bedroom
- 3,2422 bedrooms
- 29,8033 bedrooms
- 12,7374 bedrooms
- 2,9765+ bedrooms
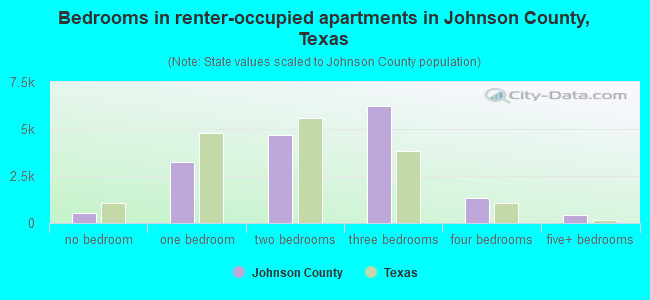
- Bedrooms in renter-occupied apartments in Johnson County, Texas
- 348no bedroom
- 3,5851 bedroom
- 6,2082 bedrooms
- 5,7433 bedrooms
- 4564 bedrooms
- 1215+ bedrooms
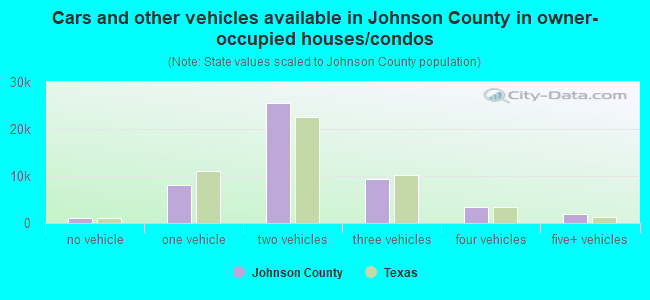
- Cars and other vehicles available in Johnson County in owner-occupied houses/condos
- 689no vehicle
- 10,2241 vehicle
- 20,5992 vehicles
- 12,1683 vehicles
- 4,7654 vehicles
- 1,7805+ vehicles
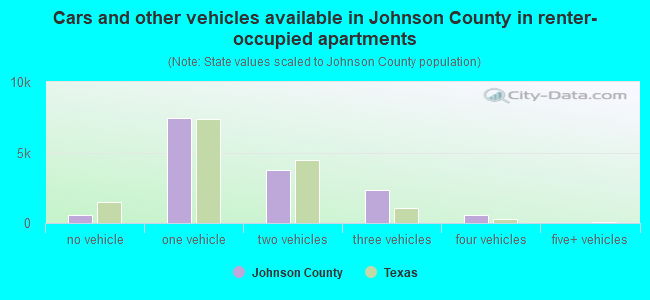
- Cars and other vehicles available in Johnson County in renter-occupied apartments
- 725no vehicle
- 7,7451 vehicle
- 5,5372 vehicles
- 1,6793 vehicles
- 6744 vehicles
- 1015+ vehicles
91.8% of Johnson County residents lived in the same house 1 years ago.
Out of people who lived in different houses, 27% lived in this county.
Out of people who lived in different counties, 76% lived in Texas.
| Johnson County: | 91.8% |
| State average: | 85.7% |
Place of birth for U.S.-born residents:
- This state: 134,762
- Other state: 43,192
- Northeast: 5,516
- Midwest: 10,070
- South: 15,540
- West: 12,066
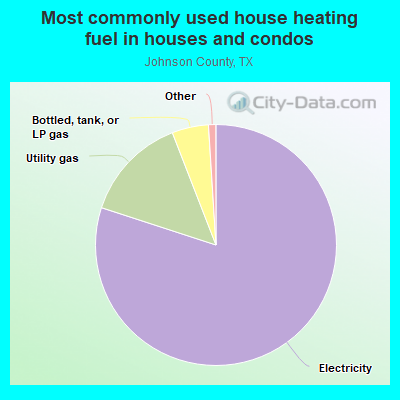
- 78.4%Electricity
- 15.8%Utility gas
- 4.7%Bottled, tank, or LP gas
- 0.3%No fuel used
- 0.2%Wood
- 0.2%Solar energy
- 0.2%Fuel oil, kerosene, etc.
- 0.2%Other fuel
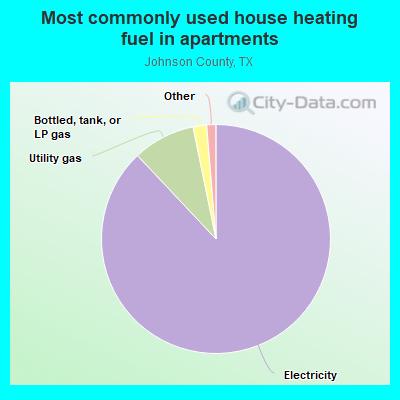
- 87.7%Electricity
- 9.1%Utility gas
- 2.2%Bottled, tank, or LP gas
- 0.7%No fuel used
- 0.3%Wood
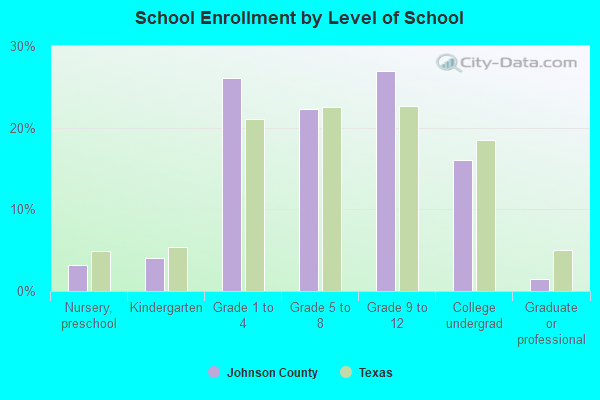
Private vs. public school enrollment:
| Here: | 11.9% |
| Texas: | 8.8% |
| Here: | 5.5% |
| Texas: | 8.0% |
| Here: | 26.7% |
| Texas: | 16.2% |

Johnson County government finances - Expenditure in 2017:
- Bond Funds - Cash and Securities: $9,674,000
- Charges - Other: $4,866,000
Regular Highways: $2,158,000
Regular Highways: $345,000
Parks and Recreation: $61,000
Parks and Recreation: $48,000
- Construction - Correctional Institutions: $17,313,000
Regular Highways: $1,853,000
Central Staff Services: $439,000
- Current Operations - Correctional Institutions: $23,526,000
Correctional Institutions: $18,297,000
Police Protection: $17,751,000
Police Protection: $13,949,000
Central Staff Services: $13,944,000
Judicial and Legal Services: $11,838,000
Judicial and Legal Services: $7,943,000
Regular Highways: $6,974,000
Central Staff Services: $6,935,000
Regular Highways: $5,778,000
General - Other: $2,401,000
Public Welfare, Vendor Payments for Medical Care: $1,559,000
Health - Other: $1,233,000
Financial Administration: $1,114,000
Financial Administration: $963,000
Parks and Recreation: $261,000
Parks and Recreation: $248,000
Natural Resources - Other: $192,000
Natural Resources - Other: $150,000
- Federal Intergovernmental - Other: $9,251,000
Other: $1,000
- General - Interest on Debt: $865,000
Interest on Debt: $513,000
- Intergovernmental to Local - Other - General - Other: $191,000
Other - Transit Utilities: $56,000
- Long Term Debt - Outstanding Unspecified Public Purpose: $31,860,000
Beginning Outstanding - Unspecified Public Purpose: $24,425,000
Outstanding Unspecified Public Purpose: $21,760,000
Issue, Unspecified Public Purpose: $20,605,000
Beginning Outstanding - Unspecified Public Purpose: $12,816,000
Retired Unspecified Public Purpose: $2,665,000
Retired Unspecified Public Purpose: $1,561,000
- Miscellaneous - General Revenue - Other: $20,784,000
Fines and Forfeits: $2,707,000
Interest Earnings: $1,717,000
Fines and Forfeits: $1,309,000
General Revenue - Other: $822,000
Interest Earnings: $334,000
Donations From Private Sources: $165,000
Rents: $163,000
Royalties: $130,000
Royalties: $72,000
Rents: $13,000
- Other Capital Outlay - Central Staff Services: $919,000
Police Protection: $728,000
Regular Highways: $610,000
Central Staff Services: $463,000
Police Protection: $427,000
Regular Highways: $197,000
Correctional Institutions: $47,000
Health - Other: $41,000
Health - Other: $7,000
Judicial and Legal Services: $4,000
Parks and Recreation: $3,000
Financial Administration: $2,000
- Other Funds - Cash and Securities: $68,937,000
- Short Term Debt Outstanding - Beginning: $2,605,000
End of Fiscal Year: $2,445,000
- Sinking Funds - Cash and Securities: $39,700,000
Cash and Securities: $1,319,000
- State Intergovernmental - Other: $1,605,000
Other: $1,410,000
Highways: $669,000
Highways: $61,000
Health and Hospitals: $47,000
Public Welfare: $31,000
- Tax - Property: $54,344,000
Property: $49,309,000
Motor Vehicle License: $1,922,000
Motor Vehicle License: $1,876,000
Other License: $508,000
Other License: $336,000
Alcoholic Beverage License: $196,000
Alcoholic Beverage License: $126,000
Amusements License: $48,000
- Total Salaries and Wages: $26,856,000
: $22,355,000
Johnson County government finances - Revenue in 2017:
- Bond Funds - Cash and Securities: $9,674,000
- Charges - Other: $4,866,000
Regular Highways: $2,158,000
Regular Highways: $345,000
Parks and Recreation: $61,000
Parks and Recreation: $48,000
- Construction - Correctional Institutions: $17,313,000
Regular Highways: $1,853,000
Central Staff Services: $439,000
- Current Operations - Correctional Institutions: $23,526,000
Correctional Institutions: $18,297,000
Police Protection: $17,751,000
Police Protection: $13,949,000
Central Staff Services: $13,944,000
Judicial and Legal Services: $11,838,000
Judicial and Legal Services: $7,943,000
Regular Highways: $6,974,000
Central Staff Services: $6,935,000
Regular Highways: $5,778,000
General - Other: $2,401,000
Public Welfare, Vendor Payments for Medical Care: $1,559,000
Health - Other: $1,233,000
Financial Administration: $1,114,000
Financial Administration: $963,000
Parks and Recreation: $261,000
Parks and Recreation: $248,000
Natural Resources - Other: $192,000
Natural Resources - Other: $150,000
- Federal Intergovernmental - Other: $9,251,000
Other: $1,000
- General - Interest on Debt: $865,000
Interest on Debt: $513,000
- Intergovernmental to Local - Other - General - Other: $191,000
Other - Transit Utilities: $56,000
- Long Term Debt - Outstanding Unspecified Public Purpose: $31,860,000
Beginning Outstanding - Unspecified Public Purpose: $24,425,000
Outstanding Unspecified Public Purpose: $21,760,000
Issue, Unspecified Public Purpose: $20,605,000
Beginning Outstanding - Unspecified Public Purpose: $12,816,000
Retired Unspecified Public Purpose: $2,665,000
Retired Unspecified Public Purpose: $1,561,000
- Miscellaneous - General Revenue - Other: $20,784,000
Fines and Forfeits: $2,707,000
Interest Earnings: $1,717,000
Fines and Forfeits: $1,309,000
General Revenue - Other: $822,000
Interest Earnings: $334,000
Donations From Private Sources: $165,000
Rents: $163,000
Royalties: $130,000
Royalties: $72,000
Rents: $13,000
- Other Capital Outlay - Central Staff Services: $919,000
Police Protection: $728,000
Regular Highways: $610,000
Central Staff Services: $463,000
Police Protection: $427,000
Regular Highways: $197,000
Correctional Institutions: $47,000
Health - Other: $41,000
Health - Other: $7,000
Judicial and Legal Services: $4,000
Parks and Recreation: $3,000
Financial Administration: $2,000
- Other Funds - Cash and Securities: $68,937,000
- Short Term Debt Outstanding - Beginning: $2,605,000
End of Fiscal Year: $2,445,000
- Sinking Funds - Cash and Securities: $39,700,000
Cash and Securities: $1,319,000
- State Intergovernmental - Other: $1,605,000
Other: $1,410,000
Highways: $669,000
Highways: $61,000
Health and Hospitals: $47,000
Public Welfare: $31,000
- Tax - Property: $54,344,000
Property: $49,309,000
Motor Vehicle License: $1,922,000
Motor Vehicle License: $1,876,000
Other License: $508,000
Other License: $336,000
Alcoholic Beverage License: $196,000
Alcoholic Beverage License: $126,000
Amusements License: $48,000
- Total Salaries and Wages: $26,856,000
: $22,355,000
Johnson County government finances - Debt in 2017:
- Bond Funds - Cash and Securities: $9,674,000
- Charges - Other: $4,866,000
Regular Highways: $2,158,000
Regular Highways: $345,000
Parks and Recreation: $61,000
Parks and Recreation: $48,000
- Construction - Correctional Institutions: $17,313,000
Regular Highways: $1,853,000
Central Staff Services: $439,000
- Current Operations - Correctional Institutions: $23,526,000
Correctional Institutions: $18,297,000
Police Protection: $17,751,000
Police Protection: $13,949,000
Central Staff Services: $13,944,000
Judicial and Legal Services: $11,838,000
Judicial and Legal Services: $7,943,000
Regular Highways: $6,974,000
Central Staff Services: $6,935,000
Regular Highways: $5,778,000
General - Other: $2,401,000
Public Welfare, Vendor Payments for Medical Care: $1,559,000
Health - Other: $1,233,000
Financial Administration: $1,114,000
Financial Administration: $963,000
Parks and Recreation: $261,000
Parks and Recreation: $248,000
Natural Resources - Other: $192,000
Natural Resources - Other: $150,000
- Federal Intergovernmental - Other: $9,251,000
Other: $1,000
- General - Interest on Debt: $865,000
Interest on Debt: $513,000
- Intergovernmental to Local - Other - General - Other: $191,000
Other - Transit Utilities: $56,000
- Long Term Debt - Outstanding Unspecified Public Purpose: $31,860,000
Beginning Outstanding - Unspecified Public Purpose: $24,425,000
Outstanding Unspecified Public Purpose: $21,760,000
Issue, Unspecified Public Purpose: $20,605,000
Beginning Outstanding - Unspecified Public Purpose: $12,816,000
Retired Unspecified Public Purpose: $2,665,000
Retired Unspecified Public Purpose: $1,561,000
- Miscellaneous - General Revenue - Other: $20,784,000
Fines and Forfeits: $2,707,000
Interest Earnings: $1,717,000
Fines and Forfeits: $1,309,000
General Revenue - Other: $822,000
Interest Earnings: $334,000
Donations From Private Sources: $165,000
Rents: $163,000
Royalties: $130,000
Royalties: $72,000
Rents: $13,000
- Other Capital Outlay - Central Staff Services: $919,000
Police Protection: $728,000
Regular Highways: $610,000
Central Staff Services: $463,000
Police Protection: $427,000
Regular Highways: $197,000
Correctional Institutions: $47,000
Health - Other: $41,000
Health - Other: $7,000
Judicial and Legal Services: $4,000
Parks and Recreation: $3,000
Financial Administration: $2,000
- Other Funds - Cash and Securities: $68,937,000
- Short Term Debt Outstanding - Beginning: $2,605,000
End of Fiscal Year: $2,445,000
- Sinking Funds - Cash and Securities: $39,700,000
Cash and Securities: $1,319,000
- State Intergovernmental - Other: $1,605,000
Other: $1,410,000
Highways: $669,000
Highways: $61,000
Health and Hospitals: $47,000
Public Welfare: $31,000
- Tax - Property: $54,344,000
Property: $49,309,000
Motor Vehicle License: $1,922,000
Motor Vehicle License: $1,876,000
Other License: $508,000
Other License: $336,000
Alcoholic Beverage License: $196,000
Alcoholic Beverage License: $126,000
Amusements License: $48,000
- Total Salaries and Wages: $26,856,000
: $22,355,000
Johnson County government finances - Cash and Securities in 2017:
- Bond Funds - Cash and Securities: $9,674,000
- Charges - Other: $4,866,000
Regular Highways: $2,158,000
Regular Highways: $345,000
Parks and Recreation: $61,000
Parks and Recreation: $48,000
- Construction - Correctional Institutions: $17,313,000
Regular Highways: $1,853,000
Central Staff Services: $439,000
- Current Operations - Correctional Institutions: $23,526,000
Correctional Institutions: $18,297,000
Police Protection: $17,751,000
Police Protection: $13,949,000
Central Staff Services: $13,944,000
Judicial and Legal Services: $11,838,000
Judicial and Legal Services: $7,943,000
Regular Highways: $6,974,000
Central Staff Services: $6,935,000
Regular Highways: $5,778,000
General - Other: $2,401,000
Public Welfare, Vendor Payments for Medical Care: $1,559,000
Health - Other: $1,233,000
Financial Administration: $1,114,000
Financial Administration: $963,000
Parks and Recreation: $261,000
Parks and Recreation: $248,000
Natural Resources - Other: $192,000
Natural Resources - Other: $150,000
- Federal Intergovernmental - Other: $9,251,000
Other: $1,000
- General - Interest on Debt: $865,000
Interest on Debt: $513,000
- Intergovernmental to Local - Other - General - Other: $191,000
Other - Transit Utilities: $56,000
- Long Term Debt - Outstanding Unspecified Public Purpose: $31,860,000
Beginning Outstanding - Unspecified Public Purpose: $24,425,000
Outstanding Unspecified Public Purpose: $21,760,000
Issue, Unspecified Public Purpose: $20,605,000
Beginning Outstanding - Unspecified Public Purpose: $12,816,000
Retired Unspecified Public Purpose: $2,665,000
Retired Unspecified Public Purpose: $1,561,000
- Miscellaneous - General Revenue - Other: $20,784,000
Fines and Forfeits: $2,707,000
Interest Earnings: $1,717,000
Fines and Forfeits: $1,309,000
General Revenue - Other: $822,000
Interest Earnings: $334,000
Donations From Private Sources: $165,000
Rents: $163,000
Royalties: $130,000
Royalties: $72,000
Rents: $13,000
- Other Capital Outlay - Central Staff Services: $919,000
Police Protection: $728,000
Regular Highways: $610,000
Central Staff Services: $463,000
Police Protection: $427,000
Regular Highways: $197,000
Correctional Institutions: $47,000
Health - Other: $41,000
Health - Other: $7,000
Judicial and Legal Services: $4,000
Parks and Recreation: $3,000
Financial Administration: $2,000
- Other Funds - Cash and Securities: $68,937,000
- Short Term Debt Outstanding - Beginning: $2,605,000
End of Fiscal Year: $2,445,000
- Sinking Funds - Cash and Securities: $39,700,000
Cash and Securities: $1,319,000
- State Intergovernmental - Other: $1,605,000
Other: $1,410,000
Highways: $669,000
Highways: $61,000
Health and Hospitals: $47,000
Public Welfare: $31,000
- Tax - Property: $54,344,000
Property: $49,309,000
Motor Vehicle License: $1,922,000
Motor Vehicle License: $1,876,000
Other License: $508,000
Other License: $336,000
Alcoholic Beverage License: $196,000
Alcoholic Beverage License: $126,000
Amusements License: $48,000
- Total Salaries and Wages: $26,856,000
: $22,355,000
Supplemental Security Income (SSI) in 2006:
- Total number of recipients: 2,089
- Number of aged recipients: 204
- Number of blind and disabled recipients: 1,885
- Number of recipients under 18: 373
- Number of recipients between 18 and 64: 1,366
- Number of recipients older than 64: 350
- Number of recipients also receiving OASDI: 711
- Amount of payments (thousands of dollars): 892
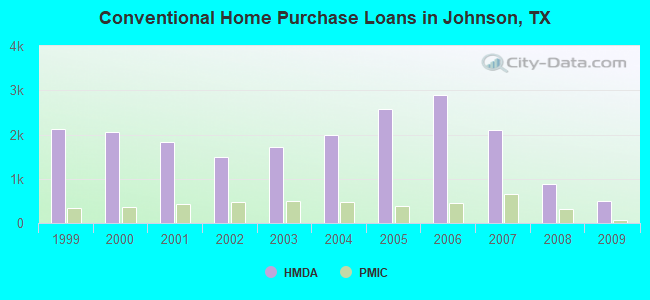
| Home Mortgage Disclosure Act Aggregated Statistics For Year 2009 (Based on 23 full tracts) | ||||||||||||||
| A) FHA, FSA/RHS & VA Home Purchase Loans | B) Conventional Home Purchase Loans | C) Refinancings | D) Home Improvement Loans | E) Loans on Dwellings For 5+ Families | F) Non-occupant Loans on < 5 Family Dwellings (A B C & D) | G) Loans On Manufactured Home Dwelling (A B C & D) | ||||||||
|---|---|---|---|---|---|---|---|---|---|---|---|---|---|---|
| Number | Average Value | Number | Average Value | Number | Average Value | Number | Average Value | Number | Average Value | Number | Average Value | Number | Average Value | |
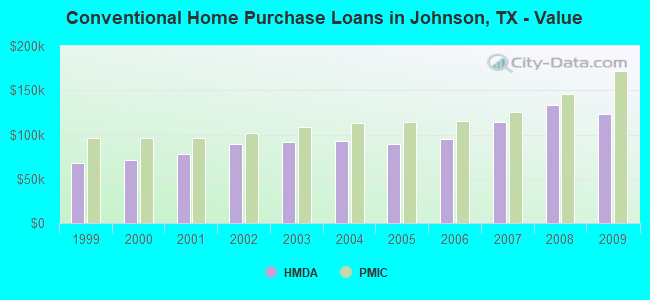
| LOANS ORIGINATED | 856 | $127,084 | 502 | $123,616 | 1,369 | $143,004 | 227 | $31,833 | 4 | $1,694,500 | 197 | $72,193 | 167 | $75,671 |
| APPLICATIONS APPROVED, NOT ACCEPTED | 44 | $112,614 | 56 | $120,393 | 144 | $139,153 | 36 | $21,278 | 1 | $10,000,000 | 11 | $61,273 | 41 | $67,659 |
| APPLICATIONS DENIED | 145 | $112,552 | 153 | $101,294 | 715 | $137,446 | 285 | $30,656 | 0 | $0 | 47 | $64,213 | 137 | $56,036 |
| APPLICATIONS WITHDRAWN | 132 | $122,364 | 92 | $124,902 | 453 | $133,649 | 55 | $46,436 | 0 | $0 | 20 | $61,050 | 36 | $74,389 |
| FILES CLOSED FOR INCOMPLETENESS | 21 | $88,048 | 17 | $139,588 | 106 | $148,038 | 21 | $54,143 | 0 | $0 | 6 | $50,000 | 24 | $69,917 |
| Private Mortgage Insurance Companies Aggregated Statistics For Year 2009 (Based on 23 full tracts) | ||||||||
| A) Conventional Home Purchase Loans | B) Refinancings | C) Non-occupant Loans on < 5 Family Dwellings (A & B) | D) Loans On Manufactured Home Dwelling (A & B) | |||||
|---|---|---|---|---|---|---|---|---|
| Number | Average Value | Number | Average Value | Number | Average Value | Number | Average Value | |
| LOANS ORIGINATED | 74 | $172,189 | 68 | $175,235 | 5 | $107,200 | 0 | $0 |
| APPLICATIONS APPROVED, NOT ACCEPTED | 27 | $184,852 | 16 | $216,375 | 1 | $97,000 | 1 | $66,000 |
| APPLICATIONS DENIED | 15 | $166,467 | 11 | $166,818 | 3 | $87,000 | 0 | $0 |
| APPLICATIONS WITHDRAWN | 6 | $132,500 | 139 | $119,964 | 0 | $0 | 0 | $0 |
| FILES CLOSED FOR INCOMPLETENESS | 6 | $181,500 | 1 | $266,000 | 2 | $120,500 | 0 | $0 |
| Most common first names in Johnson County, TX among deceased individuals | ||
| Name | Count | Lived (average) |
|---|---|---|
| James | 645 | 73.1 years |
| William | 568 | 75.6 years |
| Mary | 543 | 79.8 years |
| John | 519 | 75.2 years |
| Robert | 396 | 72.1 years |
| Charles | 264 | 70.6 years |
| George | 227 | 75.7 years |
| Ruby | 195 | 81.5 years |
| Thomas | 174 | 71.7 years |
| Willie | 169 | 78.5 years |
| Most common last names in Johnson County, TX among deceased individuals | ||
| Last name | Count | Lived (average) |
|---|---|---|
| Smith | 305 | 74.6 years |
| Johnson | 214 | 77.1 years |
| Jones | 206 | 77.1 years |
| Moore | 179 | 76.3 years |
| Williams | 179 | 74.4 years |
| Davis | 167 | 76.3 years |
| Brown | 156 | 77.2 years |
| Miller | 124 | 77.5 years |
| White | 107 | 75.6 years |
| Wilson | 102 | 73.8 years |
| Businesses in Johnson County, TX | ||||
| Name | Count | Name | Count | |
|---|---|---|---|---|
| ALDI | 1 | Kroger | 2 | |
| AT&T | 4 | La Quinta | 4 | |
| Academy Sports + Outdoors | 1 | Lane Bryant | 1 | |
| Aeropostale | 1 | Lane Furniture | 1 | |
| Albertsons | 3 | Little Caesars Pizza | 2 | |
| Applebee's | 2 | Long John Silver's | 1 | |
| Arby's | 2 | Lowe's | 2 | |
| AutoZone | 5 | MasterBrand Cabinets | 2 | |
| Bath & Body Works | 1 | McDonald's | 7 | |
| Best Western | 2 | Motel 6 | 1 | |
| Blockbuster | 4 | Motherhood Maternity | 1 | |
| Budget Car Rental | 1 | Nike | 9 | |
| Burger King | 2 | Nissan | 1 | |
| CVS | 4 | Office Depot | 1 | |
| Catherines | 1 | Old Navy | 1 | |
| Chevrolet | 1 | Olive Garden | 1 | |
| Chick-Fil-A | 1 | On The Border | 1 | |
| Church's Chicken | 1 | Outback | 1 | |
| Cinnabon | 1 | Outback Steakhouse | 1 | |
| Circle K | 1 | Pac Sun | 1 | |
| Comfort Inn | 1 | Panda Express | 2 | |
| Comfort Suites | 1 | Papa John's Pizza | 1 | |
| Cracker Barrel | 1 | Payless | 2 | |
| Curves | 3 | Penske | 2 | |
| DHL | 2 | PetSmart | 1 | |
| Dairy Queen | 1 | Pier 1 Imports | 1 | |
| Days Inn | 3 | Pizza Hut | 3 | |
| Dennys | 1 | Popeyes | 1 | |
| Discount Tire | 2 | Quiznos | 1 | |
| Domino's Pizza | 4 | RadioShack | 3 | |
| DressBarn | 1 | Red Lobster | 1 | |
| Dressbarn | 1 | Rue21 | 1 | |
| Famous Footwear | 1 | SONIC Drive-In | 12 | |
| FedEx | 17 | Sears | 2 | |
| Firestone Complete Auto Care | 1 | Sprint Nextel | 2 | |
| Ford | 2 | Staples | 2 | |
| GNC | 2 | Starbucks | 4 | |
| GameStop | 4 | Subway | 13 | |
| Goodwill | 1 | Super 8 | 1 | |
| H&R Block | 7 | T-Mobile | 5 | |
| Hilton | 2 | T.G.I. Driday's | 1 | |
| Hobby Lobby | 1 | T.J.Maxx | 1 | |
| Holiday Inn | 3 | Taco Bell | 4 | |
| Home Depot | 2 | Target | 1 | |
| Honda | 1 | True Value | 3 | |
| Howard Johnson | 1 | U-Haul | 11 | |
| IHOP | 1 | UPS | 12 | |
| JCPenney | 1 | Verizon Wireless | 2 | |
| Jack In The Box | 3 | Waffle House | 3 | |
| Jones New York | 2 | Walgreens | 3 | |
| Justice | 1 | Walmart | 2 | |
| KFC | 2 | Wendy's | 3 | |
| Kohl's | 1 | Wet Seal | 1 | |
Johnson County on our top lists:
- #22 on the list of "Top 101 counties with highest percentage of residents voting for Romney (Republican) in the 2012 Presidential Election (pop. 50,000+)"