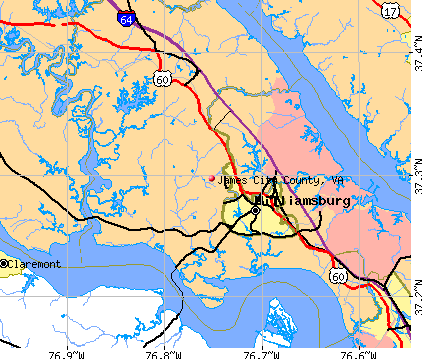
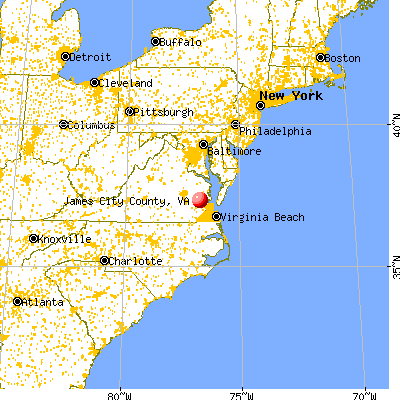
James City County, Virginia (VA)
County owner-occupied free and clear houses and condos in 2010: 5,244
County owner-occupied houses and condos in 2000: 14,639
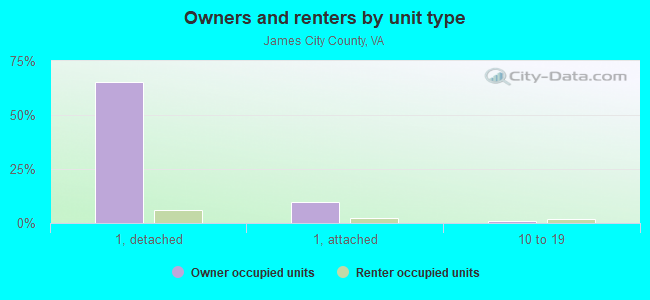
Renter-occupied apartments: 6,431 (it was 4,364 in 2000)
| % of renters here: | 23% |
| State: | 33% |
Land area: 143 sq. mi.
Water area: 36.8 sq. mi.
Population density: 568 people per square mile (high).
Industries providing employment: Educational, health and social services (26.3%), Professional, scientific, management, administrative, and waste management services (14.4%), Retail trade (12.5%), Arts, entertainment, recreation, accommodation and food services (10.2%).
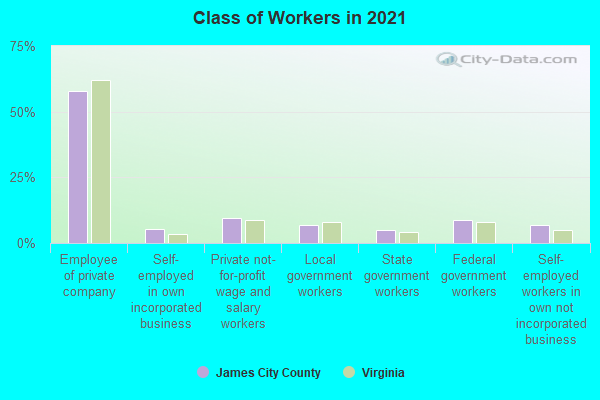
Type of workers:
- Private wage or salary: 68%
- Government: 25%
- Self-employed, not incorporated: 6%
- Unpaid family work: 0%
- OSM Map
- General Map
- Google Map
- MSN Map

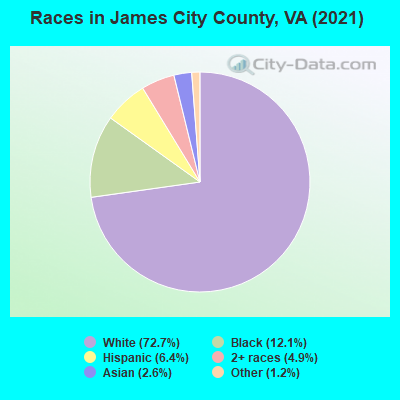
- 57,08172.2%White Non-Hispanic Alone
- 9,82412.4%Black Non-Hispanic Alone
- 5,2586.6%Hispanic or Latino
- 4,0845.2%Two or more races
- 2,0642.6%Asian alone
- 7500.9%Some other race alone
- 280.04%Native Hawaiian and Other
Pacific Islander alone - 140.02%American Indian and Alaska Native alone
| Median resident age: | 46.9 years |
| Virginia median age: | 39.0 years |
| Males: 38,803 | |
| Females: 42,396 |

 | Retiring in Williamsburg questions (44 replies) |
| Lynchburg vs. Norfolk (34 replies) |
| COVID 19 in James City County (0 replies) |
| Water bill amounts in James City County (11 replies) |
| Water bill amounts in James City County (4 replies) |
| Relocating in 2025 to Williamsburg, Va - Questions (3 replies) |
| James City County: | 2.0 people |
| Virginia: | 3 people |
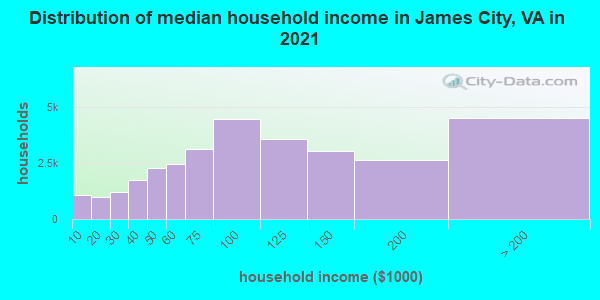
Estimated median household income in 2022: $99,432 ($55,594 in 1999)
| This county: | $99,432 |
| Virginia: | $85,873 |
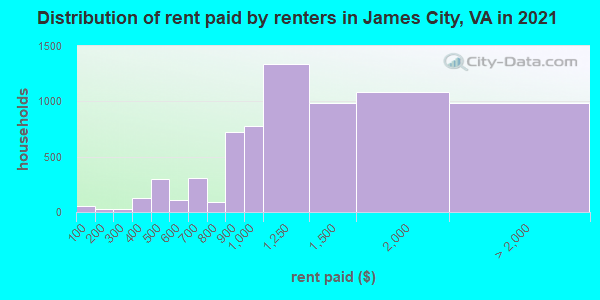
Median contract rent in 2022 for apartments: $1,422 (lower quartile is $1,101, upper quartile is $1,881)
| This county: | $1422 |
| State: | $1270 |
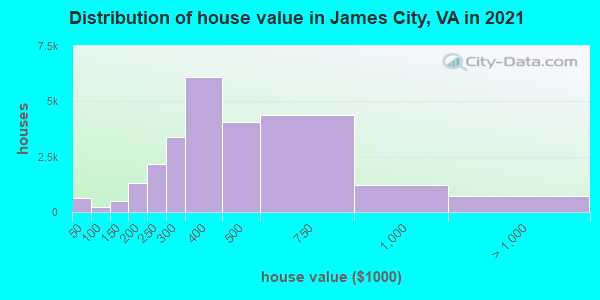
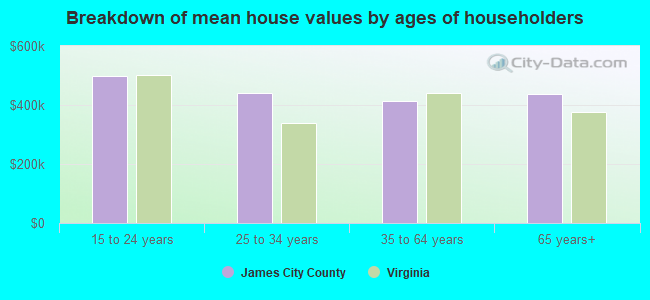
Estimated median house or condo value in 2022: $403,100 (it was $157,200 in 2000)
| James City: | $403,100 |
| Virginia: | $365,700 |
Mean price in 2022:
Median monthly housing costs for homes and condos with a mortgage: $1,843Detached houses: $493,501
Here: $493,501 State: $472,865 Townhouses or other attached units: $297,262
Here: $297,262 State: $457,437 In 3-to-4-unit structures: $316,057
Here: $316,057 State: $252,346 In 5-or-more-unit structures: $301,058
Here: $301,058 State: $382,551 Mobile homes: $66,968
Here: $66,968 State: $100,736
Median monthly housing costs for units without a mortgage: $611
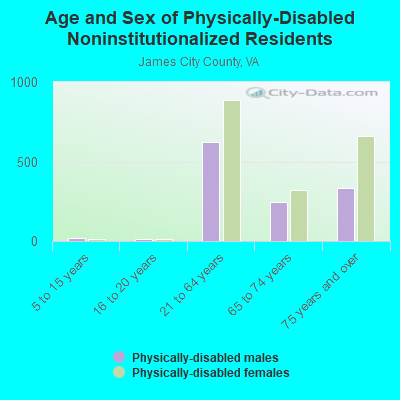
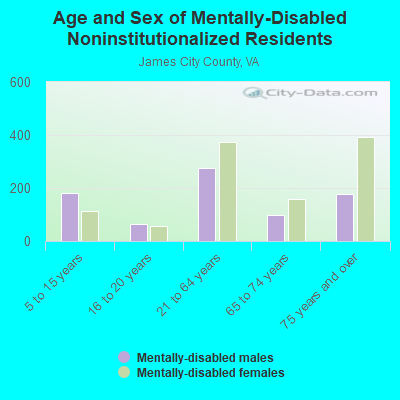
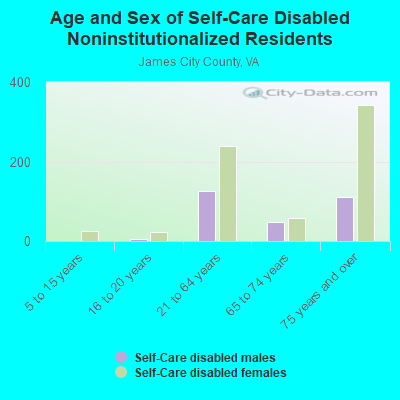
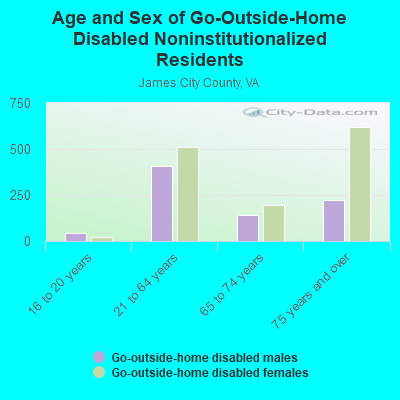
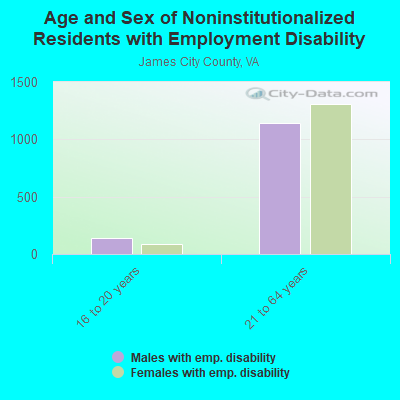
Institutionalized population: 970
Crime in 2021 (reported by the sheriff's office or county police, not the county total):
- Murders: 3
- Rapes: 14
- Robberies: 12
- Assaults: 72
- Burglaries: 37
- Thefts: 658
- Auto thefts: 32
Crime in 2020 (reported by the sheriff's office or county police, not the county total):
- Murders: 2
- Rapes: 12
- Robberies: 10
- Assaults: 47
- Burglaries: 48
- Thefts: 567
- Auto thefts: 17
Health of residents in James City County based on CDC Behavioral Risk Factor Surveillance System Survey Questionnaires from 2013 to 2021:
General health status score of residents in this county from 1 (poor) to 5 (excellent) is 3.5. This is about average.73.3% of residents exercised in the past month. This is about average.
43.6% of residents smoked 100+ cigarettes in their lives. This is about average.
53.2% of adult residents drank alcohol in the past 30 days. This is less than average.
72.5% of residents visited a dentist within the past year. This is about average.
Average weight of males is 200 pounds. This is more than average.
Average weight of females is 167 pounds. This is more than average.
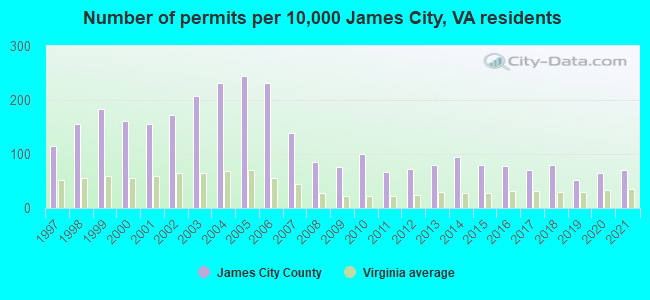
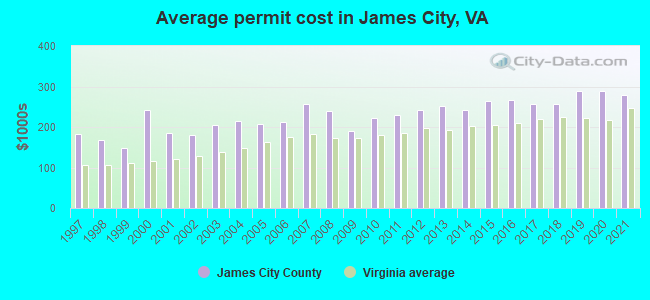
Single-family new house construction building permits:
- 2022: 261 buildings, average cost: $434,100
- 2021: 341 buildings, average cost: $277,700
- 2020: 314 buildings, average cost: $287,800
- 2019: 250 buildings, average cost: $288,900
- 2018: 386 buildings, average cost: $258,100
- 2017: 335 buildings, average cost: $256,000
- 2016: 374 buildings, average cost: $265,900
- 2015: 381 buildings, average cost: $265,300
- 2014: 454 buildings, average cost: $241,800
- 2013: 378 buildings, average cost: $250,800
- 2012: 345 buildings, average cost: $241,800
- 2011: 318 buildings, average cost: $228,700
- 2010: 482 buildings, average cost: $220,700
- 2009: 367 buildings, average cost: $190,300
- 2008: 413 buildings, average cost: $240,000
- 2007: 669 buildings, average cost: $257,800
- 2006: 1118 buildings, average cost: $213,400
- 2005: 1178 buildings, average cost: $206,900
- 2004: 1111 buildings, average cost: $215,500
- 2003: 997 buildings, average cost: $205,300
- 2002: 827 buildings, average cost: $179,700
- 2001: 745 buildings, average cost: $186,000
- 2000: 781 buildings, average cost: $242,400
- 1999: 885 buildings, average cost: $147,100
- 1998: 745 buildings, average cost: $167,600
- 1997: 548 buildings, average cost: $181,500
Median real estate property taxes paid for housing units with mortgages in 2022: $2,587 (0.6%)
Median real estate property taxes paid for housing units with no mortgage in 2022: $2,719 (0.7%)
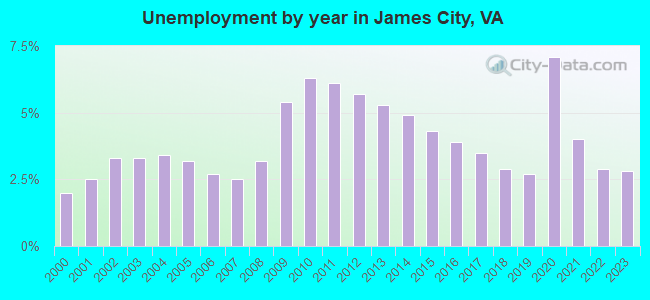
| James City County: | 6.9% |
| Virginia: | 10.6% |
Median age of residents in 2022: 46.9 years old
(Males: 44.9 years old, Females: 48.6 years old)
(Median age for: White residents: 52.8 years old, Black residents: 42.2 years old, Asian residents: 35.9 years old, Hispanic or Latino residents: 35.2 years old, Other race residents: 35.7 years old)
Area name: Virginia Beach-Norfolk-Newport News, VA-NC MSA
Fair market rent in 2006 for a 1-bedroom apartment in James City County is $706 a month.
Fair market rent for a 2-bedroom apartment is $811 a month.
Fair market rent for a 3-bedroom apartment is $1118 a month.
Cities in this county include: Jamestown district.
Neighboring counties: Calloway County, Kentucky  , Custer County, Oklahoma , Lewis County, West Virginia
  , Mercer County, West Virginia , San Bernardino County, California , Gasconade County, Missouri , Greene County , Henry County .
| Here: | 2.6% |
| Virginia: | 2.7% |
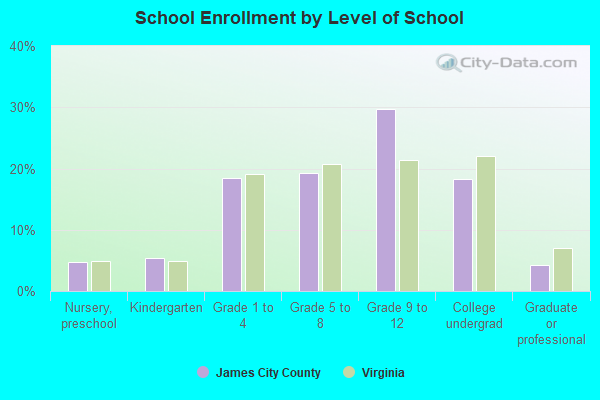
Current college students: 2,277
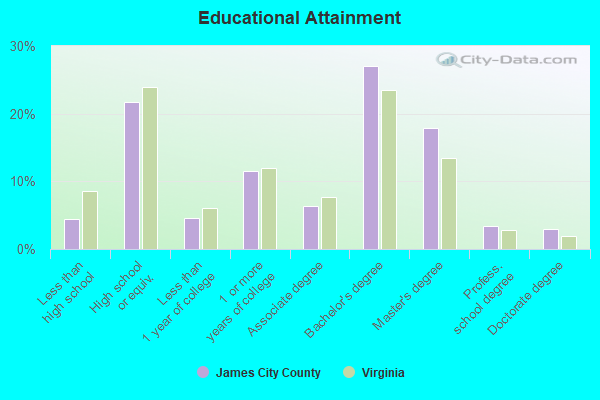
People 25 years of age or older with a high school degree or higher: 94.2%
People 25 years of age or older with a bachelor's degree or higher: 51.0%
Number of foreign born residents: 5,929 (63.8% naturalized citizens)
| James City County: | 7.3% |
| Whole state: | 12.7% |
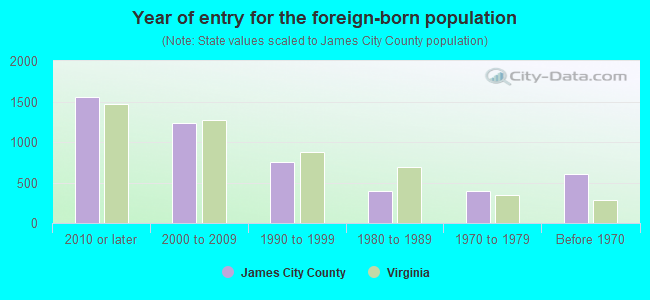
- Year of entry for the foreign-born population
- 1,9882010 or later
- 1,1642000 to 2009
- 6991990 to 1999
- 3941980 to 1989
- 3911970 to 1979
- 603Before 1970
Mean travel time to work (commute): minutes
Percentage of county residents living and working in this county: 98.8%
Housing units in structures:
- One, detached: 23,467
- One, attached: 4,704
- Two: 192
- 3 or 4: 1,145
- 5 to 9: 1,330
- 10 to 19: 973
- 20 to 49: 240
- 50 or more: 1,551
- Mobile homes: 1,117
Housing units in James City County with a mortgage: 15,442 (2,140 second mortgage, 0 home equity loan, 1,970 both second mortgage and home equity loan)
Houses without a mortgage: 385
| Here: | 3.8% with mortgage |
| State: | 97.2% with mortgage |
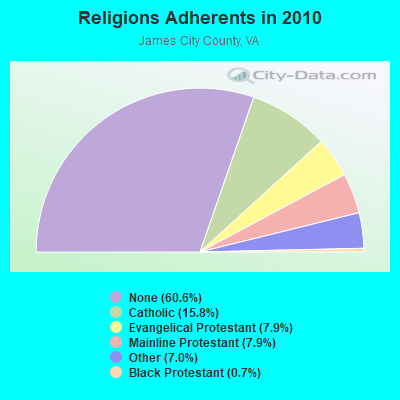
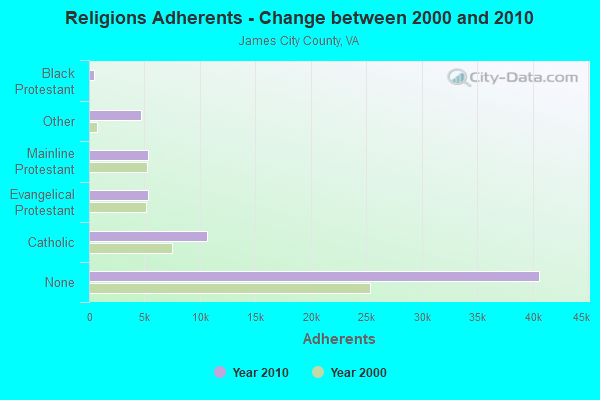
Religion statistics for James City County
| Religion | Adherents | Congregations |
|---|---|---|
| Catholic | 10,601 | 2 |
| Evangelical Protestant | 5,322 | 22 |
| Mainline Protestant | 5,312 | 11 |
| Other | 4,672 | 5 |
| Black Protestant | 477 | 3 |
| None | 40,625 | - |
Source: Clifford Grammich, Kirk Hadaway, Richard Houseal, Dale E.Jones, Alexei Krindatch, Richie Stanley and Richard H.Taylor. 2012. 2010 U.S.Religion Census: Religious Congregations & Membership Study. Association of Statisticians of American Religious Bodies. Jones, Dale E., et al. 2002. Congregations and Membership in the United States 2000. Nashville, TN: Glenmary Research Center.
Food Environment Statistics:
| James City County: | 0.98 / 10,000 pop. |
| State: | 2.03 / 10,000 pop. |
| This county: | 1.15 / 10,000 pop. |
| Virginia: | 1.43 / 10,000 pop. |
| James City County: | 2.78 / 10,000 pop. |
| Virginia: | 4.03 / 10,000 pop. |
| This county: | 7.04 / 10,000 pop. |
| State: | 7.65 / 10,000 pop. |
| James City County: | 8.9% |
| Virginia: | 9.3% |
| James City County: | 26.1% |
| State: | 26.7% |
| Here: | 16.4% |
| State: | 18.6% |
Agriculture in James City County:
Average size of farms: 140 acresAverage value of agricultural products sold per farm: $36,579
Average value of crops sold per acre for harvested cropland: $386.40
The value of livestock, poultry, and their products as a percentage of the total market value of agricultural products sold: 13.22%
Average total farm production expenses per farm: $38,587
Harvested cropland as a percentage of land in farms: 58.67%
Irrigated harvested cropland as a percentage of land in farms: 1.94%
Average market value of all machinery and equipment per farm: $50,312
The percentage of farms operated by a family or individual: 89.06%
Average age of principal farm operators: 58 years
Average number of cattle and calves per 100 acres of all land in farms: 6.05
Milk cows as a percentage of all cattle and calves: 34.32%
Corn for grain: 1872 harvested acres
All wheat for grain: 847 harvested acres
Vegetables: 128 harvested acres
Land in orchards: 84 acres
Earthquake activity:
James City County-area historical earthquake activity is significantly above Virginia state average. It is 59% smaller than the overall U.S. average.On 8/23/2011 at 17:51:04, a magnitude 5.8 (5.8 MW, Depth: 3.7 mi, Class: Moderate, Intensity: VI - VII) earthquake occurred 77.5 miles away from James City County center
On 12/9/2003 at 20:59:14, a magnitude 4.5 (4.5 MB, 4.5 LG, Class: Light, Intensity: IV - V) earthquake occurred 66.3 miles away from the county center
On 8/25/2011 at 05:07:52, a magnitude 4.5 (4.5 ML, Depth: 4.2 mi) earthquake occurred 80.4 miles away from the county center
On 12/9/2003 at 20:59:18, a magnitude 4.5 (4.5 ML, Depth: 6.2 mi) earthquake occurred 81.0 miles away from the county center
On 8/9/2020 at 12:07:37, a magnitude 5.1 (5.1 MW, Depth: 4.7 mi) earthquake occurred 246.8 miles away from James City County center
On 8/24/2011 at 00:04:36, a magnitude 4.2 (4.2 ML) earthquake occurred 78.6 miles away from the county center
Magnitude types: regional Lg-wave magnitude (LG), body-wave magnitude (MB), local magnitude (ML), moment magnitude (MW)
Most recent natural disasters:
- Virginia Covid-19 Pandemic, Incident Period: January 20, 2020, Major Disaster (Presidential) Declared DR-4512-VA: April 2, 2020, FEMA Id: 4512, Natural disaster type: Other
- Virginia Tropical Storm Michael, Incident Period: October 9, 2018 - October 16, 2018, FEMA Id: 4411, Natural disaster type: Tropical Storm
- Virginia Hurricane Sandy, Incident Period: October 26, 2012 to November 01, 2012, Emergency Declared EM-3359: October 29, 2012, FEMA Id: 3359, Natural disaster type: Hurricane
- Virginia Hurricane Irene, Incident Period: August 26, 2011 to September 04, 2011, Emergency Declared EM-3329: August 26, 2011, FEMA Id: 3329, Natural disaster type: Hurricane
- Virginia Hurricane Irene, Incident Period: August 26, 2011 to August 28, 2011, Major Disaster (Presidential) Declared DR-4024: September 03, 2011, FEMA Id: 4024, Natural disaster type: Hurricane
- Virginia Severe Storms and Flooding, Including Severe Storms and Flooding Associated with Tropical Depression Ernesto, Incident Period: August 29, 2006 to September 07, 2006, Major Disaster (Presidential) Declared DR-1661: September 22, 2006, FEMA Id: 1661, Natural disaster type: Storm, Flood, Tropical Depression
- Virginia Hurricane Katrina Evacuation, Incident Period: August 29, 2005 to October 01, 2005, Emergency Declared EM-3240: September 12, 2005, FEMA Id: 3240, Natural disaster type: Hurricane
- Virginia Hurricane Isabel, Incident Period: September 18, 2003 to October 01, 2003, Major Disaster (Presidential) Declared DR-1491: September 18, 2003, FEMA Id: 1491, Natural disaster type: Hurricane
- Virginia Winter Storm, Incident Period: January 25, 2000 to January 30, 2000, Major Disaster (Presidential) Declared DR-1318: February 28, 2000, FEMA Id: 1318, Natural disaster type: Winter Storm
- Virginia Hurricane Floyd, Incident Period: September 13, 1999 to September 26, 1999, Major Disaster (Presidential) Declared DR-1293: September 18, 1999, FEMA Id: 1293, Natural disaster type: Hurricane
- 4 other natural disasters have been reported since 1953.
The number of natural disasters in James City County (14) is near the US average (15).
Major Disasters (Presidential) Declared: 9
Emergencies Declared: 4
Causes of natural disasters: Hurricanes: 7, Tropical Storms: 2, Winter Storms: 2, Blizzard: 1, Flood: 1, Storm: 1, Tropical Depression: 1, Other: 1 (Note: some incidents may be assigned to more than one category).
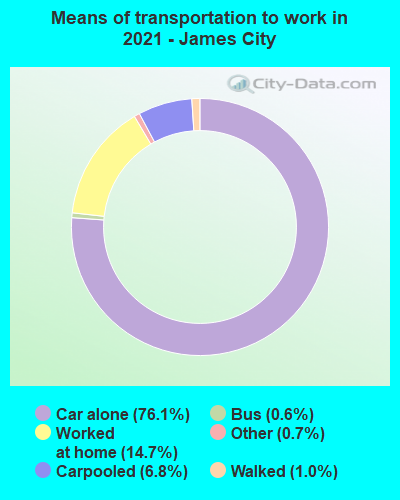
Means of transportation to work:
- Drove a car alone: 21,585 (71.0%)
- Carpooled: 1,845 (6.1%)
- Bus: 77 (0.3%)
- Taxicab, motorcycle, or other means: 364 (1.2%)
- Bicycle: 31 (0.1%)
- Walked: 322 (1.1%)
- Worked at home: 6,561 (21.6%)
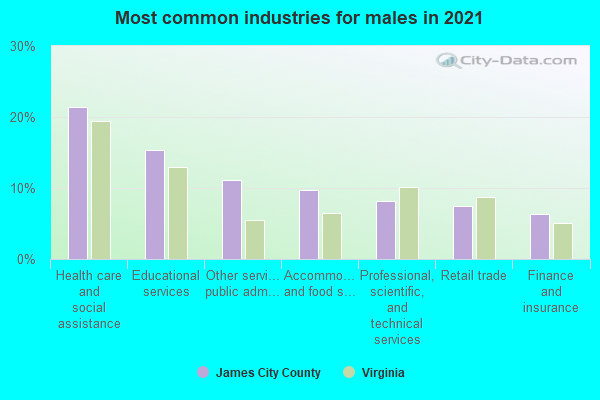
- Health care and social assistance (22%)
- Educational services (17%)
- Retail trade (13%)
- Professional, scientific, and technical services (10%)
- Other services, except public administration (6%)
- Accommodation and food services (5%)
- Finance and insurance (5%)
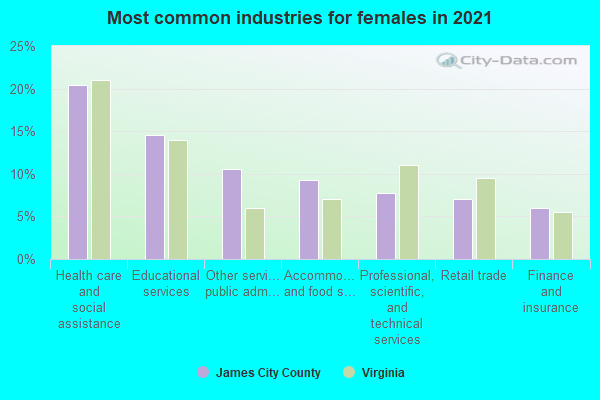
- Health care and social assistance (23%)
- Educational services (18%)
- Retail trade (13%)
- Professional, scientific, and technical services (10%)
- Other services, except public administration (6%)
- Accommodation and food services (5%)
- Finance and insurance (5%)
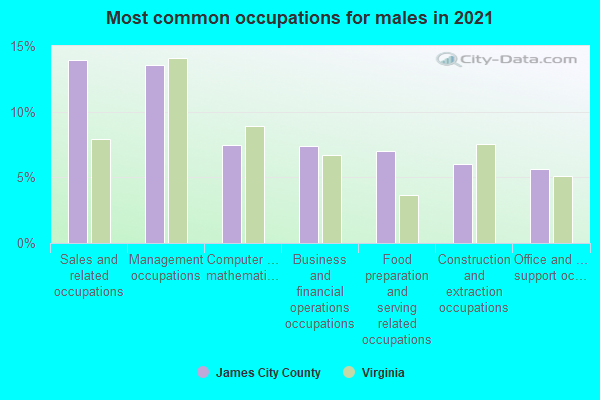
- Management occupations (21%)
- Sales and related occupations (8%)
- Business and financial operations occupations (7%)
- Construction and extraction occupations (7%)
- Transportation occupations (5%)
- Computer and mathematical occupations (5%)
- Arts, design, entertainment, sports, and media occupations (5%)
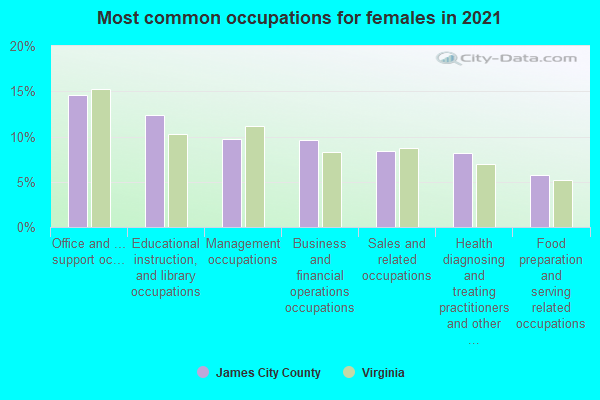
- Office and administrative support occupations (15%)
- Educational instruction, and library occupations (13%)
- Management occupations (12%)
- Health diagnosing and treating practitioners and other technical occupations (10%)
- Sales and related occupations (10%)
- Personal care and service occupations (6%)
- Business and financial operations occupations (6%)
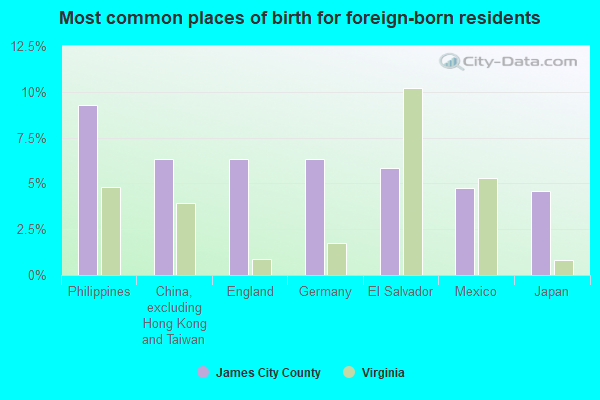
- El Salvador (10%)
- Philippines (10%)
- China, excluding Hong Kong and Taiwan (7%)
- Germany (6%)
- England (6%)
- Mexico (4%)
- Jamaica (3%)
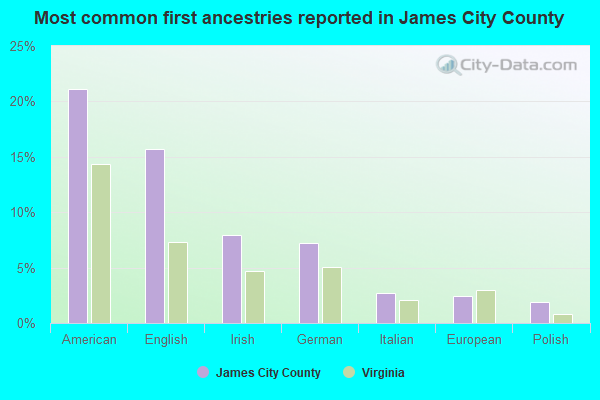
- American (21%)
- English (15%)
- Irish (9%)
- German (8%)
- Italian (3%)
- European (2%)
- Scottish (2%)
People in group quarters in James City County, Virginia in 2010:
- 432 people in local jails and other municipal confinement facilities
- 376 people in nursing facilities/skilled-nursing facilities
- 123 people in mental (psychiatric) hospitals and psychiatric units in other hospitals
- 80 people in residential treatment centers for adults
- 39 people in correctional facilities intended for juveniles
- 39 people in workers' group living quarters and job corps centers
- 11 people in other noninstitutional facilities
People in group quarters in James City County, Virginia in 2000:
- 492 people in mental (psychiatric) hospitals or wards
- 448 people in local jails and other confinement facilities (including police lockups)
- 197 people in other noninstitutional group quarters
- 46 people in other nonhousehold living situations
- 42 people in nursing homes
- 12 people in other types of correctional institutions
- 8 people in homes or halfway houses for drug/alcohol abuse
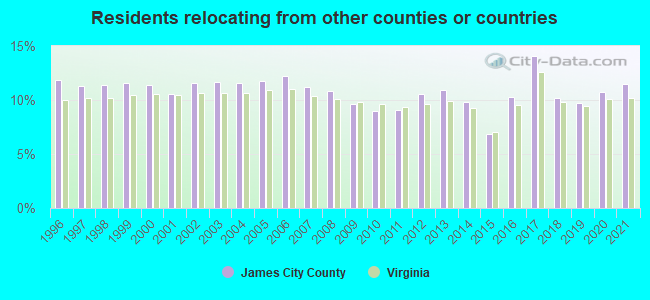
11.52% of this county's 2021 resident taxpayers lived in other counties in 2020 ($87,664 average adjusted gross income)
| Here: | 11.52% |
| Virginia average: | 10.16% |
0.15% of residents moved from foreign countries ($1,530 average AGI)
James City County: 0.15% Virginia average: 0.12%
6.73% relocated from other counties in Virginia ($47,846 average AGI)
4.64% relocated from other states ($38,288 average AGI)
James City County: 4.64% Virginia average: 3.91%
Top counties from which taxpayers relocated into this county between 2020 and 2021:
| from Newport News city, VA | |
| from Williamsburg city, VA | |
| from York County, VA | |
| from Hampton city, VA | |
| from Fairfax County, VA | |
| from Virginia Beach city, VA | |
| from New Kent County, VA |
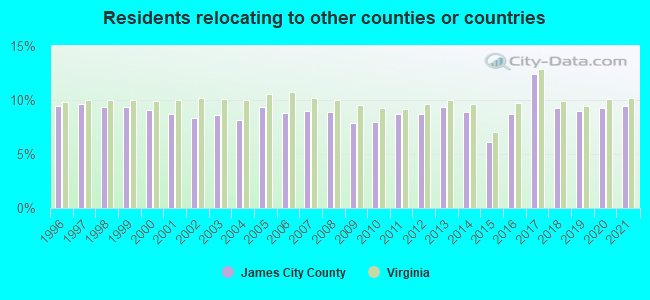
9.43% of this county's 2020 resident taxpayers moved to other counties in 2021 ($78,485 average adjusted gross income)
| Here: | 9.43% |
| Virginia average: | 10.20% |
0.07% of residents moved to foreign countries ($886 average AGI)
James City County: 0.07% Virginia average: 0.09%
5.48% relocated to other counties in Virginia ($38,642 average AGI)
3.87% relocated to other states ($38,957 average AGI)
James City County: 3.87% Virginia average: 3.98%
Top counties to which taxpayers relocated from this county between 2020 and 2021:
| to York County, VA | |
| to Williamsburg city, VA | |
| to Newport News city, VA | |
| to New Kent County, VA | |
| to Richmond city, VA | |
| to Henrico County, VA | |
| to Hampton city, VA |
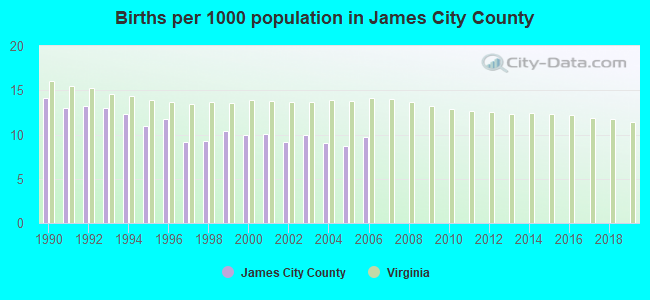
Births per 1000 population from 1990 to 1999: 11.7
Births per 1000 population from 2000 to 2006: 9.5
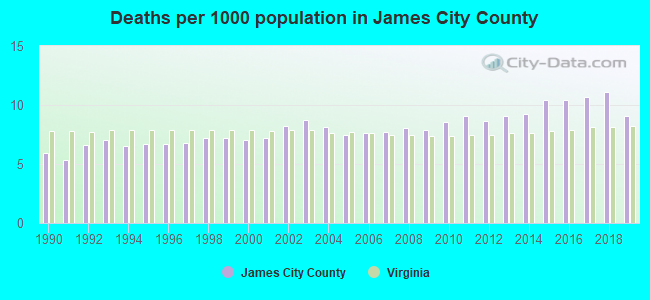
Deaths per 1000 population from 1990 to 1999: 6.6
Deaths per 1000 population from 2000 to 2009: 7.8
Deaths per 1000 population from 2010 to 2020: 9.8
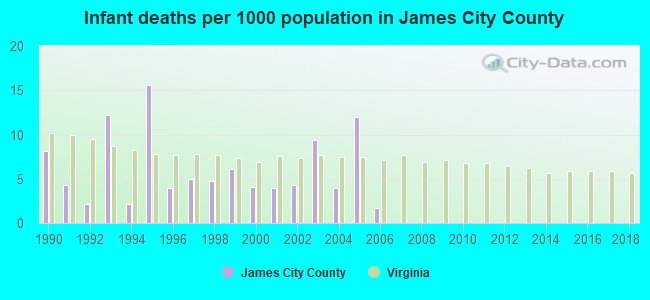
Infant deaths per 1000 live births from 1990 to 1999: 6.4
Infant deaths per 1000 live births from 2000 to 2006: 5.6
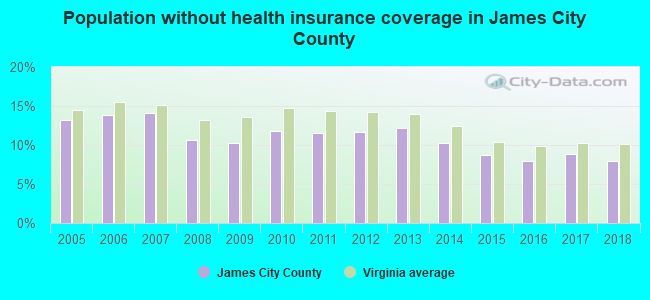
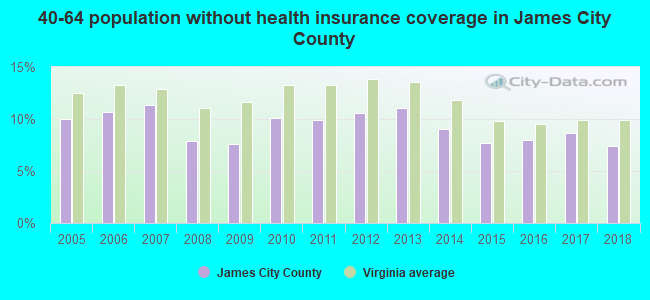
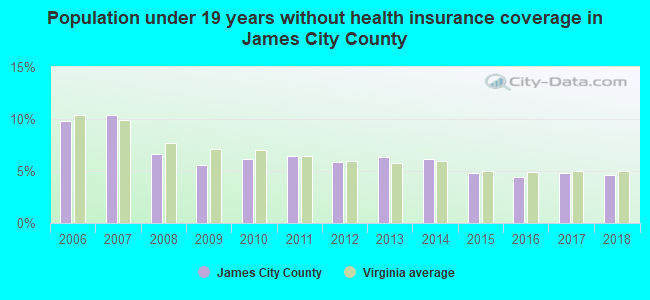
Persons under 19 years old without health insurance coverage in 2018: 4.6%

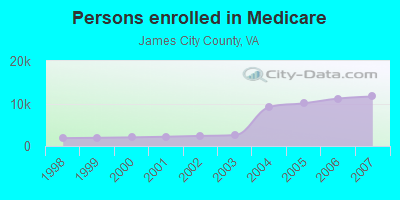
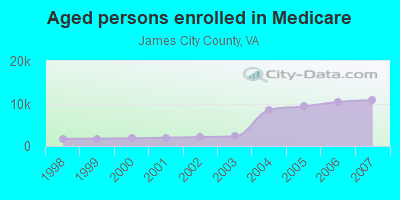
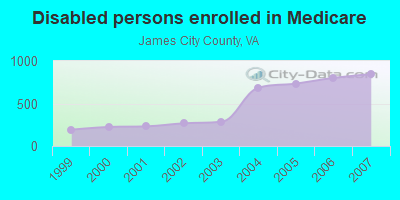
Persons enrolled in hospital insurance and/or supplemental medical insurance (Medicare) in July 1, 2007: 11,652 (10,807 aged, 845 disabled)
Children under 18 without health insurance coverage in 2007: 1,297 (10%)
Most common underlying causes of death in James City County, Virginia in 1999 - 2019:
- Bronchus or lung, unspecified - Malignant neoplasms (767)
- Atherosclerotic heart disease (660)
- Acute myocardial infarction, unspecified (597)
- Unspecified dementia (506)
- Alzheimer disease, unspecified (478)
- Chronic obstructive pulmonary disease, unspecified (372)
- Stroke, not specified as haemorrhage or infarction (324)
- Pancreas, unspecified - Malignant neoplasms (195)
- Breast, unspecified - Malignant neoplasms (174)
- Congestive heart failure (167)
Population without health insurance coverage in 2000: 8%
Children under 18 without health insurance coverage in 2000: 7%
Medical specialist MDs per 100,000 population in 2005: 836
Dentists per 100,000 population in 1998: 2
Total births per 100,000 population, July 2005 - July 2006 : 63
Total deaths per 100,000 population, July 2005 - July 2006: 47
Limited-service eating places per 100,000 population in 2005 : 10
Beer, wine & liquor stores per 100,000 population in 2005: 1
Suicides per 1,000,000 population from 2000 to 2006: 96.2. This is less than state average.
Household type by relationship:
Households: 81,199- Male householders: 16,298 (2,639 living alone), Female householders: 16,294 (5,099 living alone)
18,105 spouses (18,028 opposite-sex spouses), 1,953 unmarried partners, (1,749 opposite-sex unmarried partners), 20,315 children (19,658 natural, 265 adopted, 392 stepchildren), 2,007 grandchildren, 512 brothers or sisters, 1,477 parents, 0 foster children, 1,711 other relatives, 1,430 non-relatives
- In group quarters: 1,097
Size of family households: 12,278 2-persons, 4,390 3-persons, 3,861 4-persons, 1,258 5-persons, 406 6-persons, 105 7-or-more-persons.
Size of nonfamily households: 7,814 1-person, 1,157 2-persons, 105 3-persons, 16 4-persons, 98 5-persons.
10,146 married couples with children.
3,421 single-parent households (271 men, 3,150 women).
92.7% of residents of James City speak English at home.
3.5% of residents speak Spanish at home (67% speak English very well, 22% speak English well, 2% speak English not well, 8% don't speak English at all).
1.7% of residents speak other Indo-European language at home (81% speak English very well, 10% speak English well, 6% speak English not well, 3% don't speak English at all).
1.9% of residents speak Asian or Pacific Island language at home (59% speak English very well, 23% speak English well, 12% speak English not well, 7% don't speak English at all).
0.5% of residents speak other language at home (81% speak English very well, 19% speak English well).
In fiscal year 2004:
Federal Government expenditure: $145,240,000 ($2,617 per capita)
Department of Defense expenditure: $3,525,000
Federal direct payments to individuals for retirement and disability: $100,753,000
Federal other direct payments to individuals: $17,132,000
Federal direct payments not to individuals: $3,587,000
Federal grants: $14,214,000
Federal procurement contracts: $7,068,000 ($-465,000 Department of Defense)
Federal salaries and wages: $2,487,000 ($1,251,000 Department of Defense)
Federal Government direct loans: $167,000
Federal guaranteed/insured loans: $59,730,000
Federal Government insurance: $106,666,000
Population change from April 1, 2000 to July 1, 2005:
Births: 2,645| Here: | 46 per 1000 residents |
| State: | 70 per 1000 residents |
Deaths: 2,201
| Here: | 38 per 1000 residents |
| State: | 40 per 1000 residents |
Net international migration: +307
| Here: | +5 per 1000 residents |
| State: | +18 per 1000 residents |
Net internal migration: +8,802
| Here: | +153 per 1000 residents |
| State: | +14 per 1000 residents |
Total withdrawal of fresh water for public supply: 10.11 millions of gallons per day (95% from ground, 5% from surface)
| Here: | 7.1 |
| State: | 7.0 |
| Here: | 4.3 |
| State: | 4.3 |
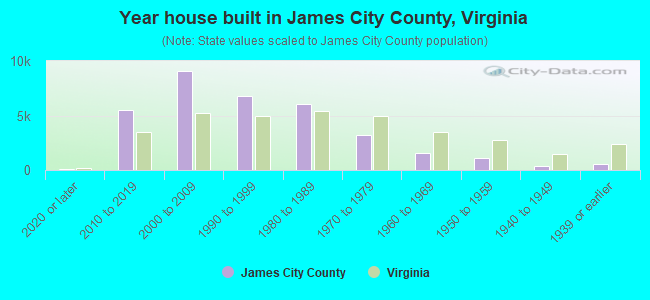
- Year house built in James City County, Virginia
- 7722020 or later
- 5,7802010 to 2019
- 8,7112000 to 2009
- 7,0371990 to 1999
- 6,0351980 to 1989
- 2,9171970 to 1979
- 1,6311960 to 1969
- 8291950 to 1959
- 5061940 to 1949
- 5011939 or earlier
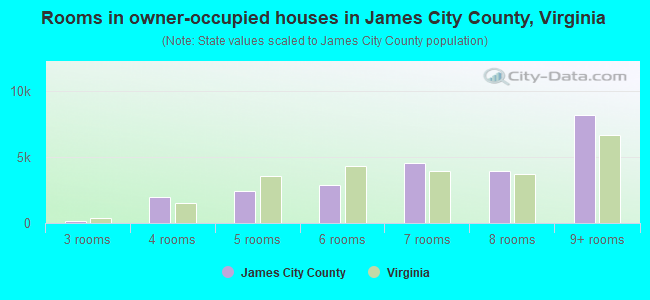
- Rooms in owner-occupied houses in James City County, Virginia
- 01 room
- 02 rooms
- 993 rooms
- 1,0844 rooms
- 3,5215 rooms
- 5,0996 rooms
- 4,5497 rooms
- 3,6348 rooms
- 7,1329+ rooms
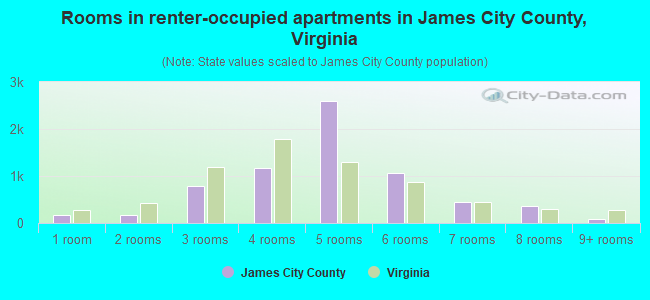
- Rooms in renter-occupied apartments in James City County, Virginia
- 851 room
- 7652 rooms
- 9333 rooms
- 2,4214 rooms
- 8355 rooms
- 1,3676 rooms
- 5697 rooms
- 2708 rooms
- 2299+ rooms
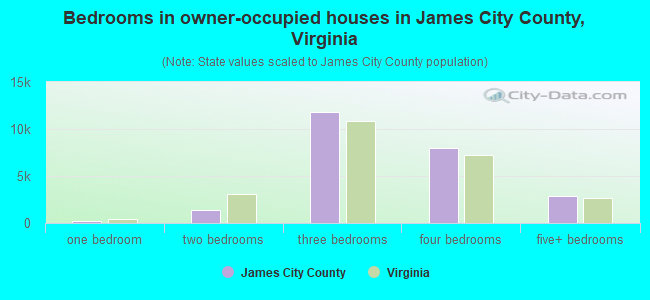
- Bedrooms in owner-occupied houses in James City County, Virginia
- 0no bedroom
- 01 bedroom
- 2,2862 bedrooms
- 13,0163 bedrooms
- 7,0984 bedrooms
- 2,7185+ bedrooms
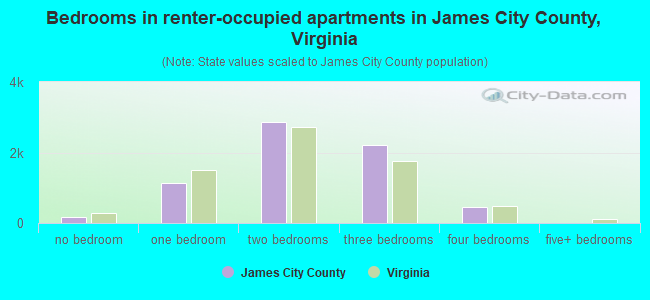
- Bedrooms in renter-occupied apartments in James City County, Virginia
- 85no bedroom
- 1,8341 bedroom
- 3,0522 bedrooms
- 2,1353 bedrooms
- 3334 bedrooms
- 355+ bedrooms
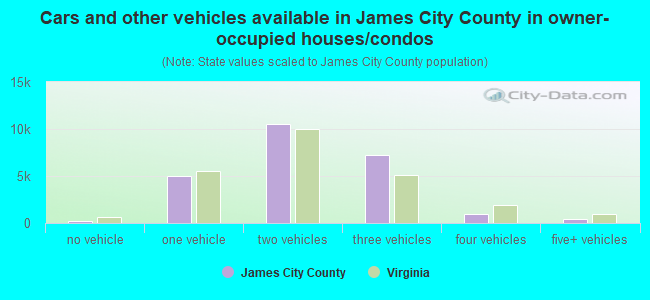
- Cars and other vehicles available in James City County in owner-occupied houses/condos
- 771no vehicle
- 7,0401 vehicle
- 10,8772 vehicles
- 4,3093 vehicles
- 1,6294 vehicles
- 4925+ vehicles
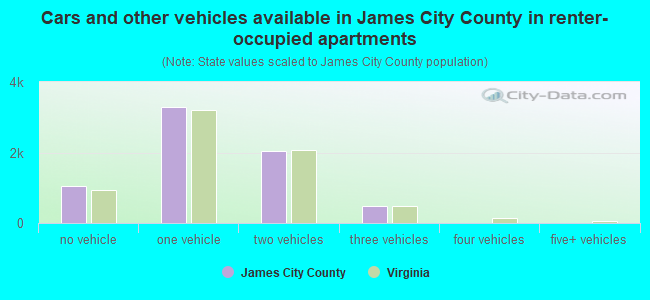
- Cars and other vehicles available in James City County in renter-occupied apartments
- 1,168no vehicle
- 3,3551 vehicle
- 2,1722 vehicles
- 7183 vehicles
- 614 vehicles
- 05+ vehicles
83.4% of James City County residents lived in the same house 1 years ago.
Out of people who lived in different houses, 23% lived in this county.
Out of people who lived in different counties, 63% lived in Virginia.
| James City County: | 83.4% |
| State average: | 86.6% |
Place of birth for U.S.-born residents:
- This state: 29,686
- Other state: 43,698
- Northeast: 16,758
- Midwest: 7,960
- South: 12,827
- West: 6,153
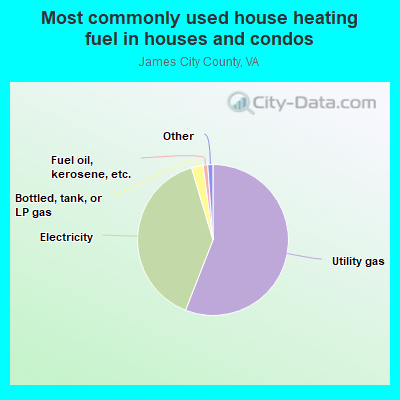
- 53.2%Utility gas
- 42.0%Electricity
- 2.6%Bottled, tank, or LP gas
- 1.1%Fuel oil, kerosene, etc.
- 0.6%No fuel used
- 0.4%Wood
- 0.1%Other fuel
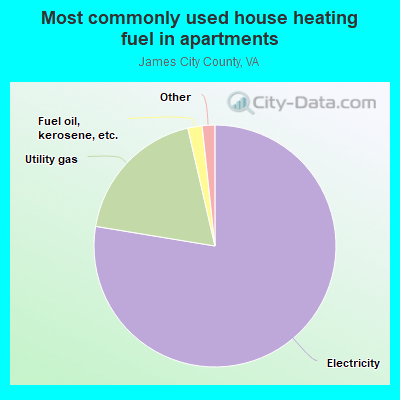
- 79.1%Electricity
- 17.0%Utility gas
- 1.4%Fuel oil, kerosene, etc.
- 1.0%Bottled, tank, or LP gas
- 0.4%Coal or coke
- 0.4%Wood
- 0.4%No fuel used
- 0.1%Other fuel
Private vs. public school enrollment:
| Here: | 18.2% |
| Virginia: | 13.2% |
| Here: | 11.5% |
| Virginia: | 10.2% |
| Here: | 4.0% |
| Virginia: | 18.7% |
James City County government finances - Expenditure in 2018:
- Charges - Sewerage: $6,507,000
Parks and Recreation: $3,778,000
Parks and Recreation: $2,845,000
Other: $2,578,000
Other: $2,276,000
Elementary and Secondary Education School Lunch: $1,838,000
Elementary and Secondary Education School Lunch: $1,298,000
Solid Waste Management: $1,170,000
Solid Waste Management: $310,000
Elementary and Secondary Education School Tuition and Transportation: $223,000
Elementary and Secondary Education School Tuition and Transportation: $196,000
Elementary and Secondary Education - Other: $75,000
Elementary and Secondary Education - Other: $68,000
- Construction - Local Fire Protection: $6,466,000
Elementary and Secondary Education: $1,308,000
Natural Resources - Other: $1,010,000
Judicial and Legal Services: $1,004,000
Parks and Recreation: $933,000
General Public Buildings: $648,000
Elementary and Secondary Education: $528,000
General Public Buildings: $371,000
Housing and Community Development: $316,000
Parks and Recreation: $310,000
Central Staff Services: $206,000
Local Fire Protection: $47,000
Police Protection: $9,000
- Current Operations - Elementary and Secondary Education: $146,991,000
Elementary and Secondary Education: $138,898,000
Police Protection: $14,493,000
Local Fire Protection: $12,993,000
Police Protection: $12,442,000
Local Fire Protection: $11,228,000
Housing and Community Development: $9,819,000
Parks and Recreation: $7,189,000
Public Welfare - Other: $6,912,000
General Public Buildings: $6,523,000
Parks and Recreation: $5,862,000
General - Other: $5,362,000
Judicial and Legal Services: $5,289,000
Central Staff Services: $5,271,000
Central Staff Services: $5,087,000
Libraries: $4,933,000
Judicial and Legal Services: $4,874,000
Public Welfare - Other: $4,704,000
Libraries: $4,514,000
Financial Administration: $4,464,000
General Public Buildings: $4,301,000
Financial Administration: $4,222,000
Health - Other: $3,835,000
Health - Other: $3,558,000
Solid Waste Management: $3,274,000
Correctional Institutions: $2,729,000
Housing and Community Development: $2,360,000
Correctional Institutions: $2,243,000
Solid Waste Management: $2,124,000
Natural Resources - Other: $2,123,000
Protective Inspection and Regulation - Other: $1,493,000
Natural Resources - Other: $1,255,000
Protective Inspection and Regulation - Other: $1,236,000
Corrections - Other: $1,081,000
Corrections - Other: $978,000
Transit Utilities: $709,000
- Federal Intergovernmental - Other: $6,562,000
Public Welfare: $2,626,000
Public Welfare: $2,082,000
Housing and Community Development: $1,397,000
Housing and Community Development: $967,000
General Local Government Support: $487,000
Other: $399,000
Education: $316,000
Education: $267,000
General Local Government Support: $7,000
- General - Interest on Debt: $5,447,000
- Intergovernmental to Local - Other - General - Other: $102,554,000
Other - General - Other: $98,612,000
- Local Intergovernmental - General Local Government Support: $567,000
Education: $563,000
Other: $388,000
Education: $292,000
- Long Term Debt - Beginning Outstanding - Unspecified Public Purpose: $187,280,000
Outstanding Unspecified Public Purpose: $170,146,000
Beginning Outstanding - Unspecified Public Purpose: $146,150,000
Outstanding Unspecified Public Purpose: $131,507,000
Retired Unspecified Public Purpose: $17,134,000
Retired Unspecified Public Purpose: $14,643,000
Outstanding Nonguaranteed - Industrial Revenue: $6,000,000
Beginning Outstanding - Public Debt for Private Purpose: $6,000,000
Outstanding Nonguaranteed - Industrial Revenue: $6,000,000
Beginning Outstanding - Public Debt for Private Purpose: $6,000,000
- Miscellaneous - General Revenue - Other: $3,062,000
General Revenue - Other: $1,416,000
Interest Earnings: $767,000
Interest Earnings: $316,000
Fines and Forfeits: $298,000
Fines and Forfeits: $232,000
Rents: $225,000
Rents: $199,000
Sale of Property: $152,000
Sale of Property: $77,000
Donations From Private Sources: $35,000
Donations From Private Sources: $4,000
- Other Capital Outlay - Elementary and Secondary Education: $22,054,000
Elementary and Secondary Education: $6,293,000
General - Other: $5,614,000
Local Fire Protection: $1,319,000
Central Staff Services: $1,282,000
General Public Building: $265,000
Local Fire Protection: $259,000
General - Other: $242,000
Central Staff Services: $175,000
Police Protection: $148,000
Housing and Community Development: $131,000
Judicial and Legal Services: $103,000
Parks and Recreation: $81,000
Parks and Recreation: $19,000
Financial Administration: $10,000
- Other Funds - Cash and Securities: $120,241,000
Cash and Securities: $87,405,000
- Revenue - Water Utilities: $8,083,000
- Sinking Funds - Cash and Securities: $8,380,000
Cash and Securities: $6,228,000
- State Intergovernmental - Education: $57,260,000
Education: $55,500,000
General Local Government Support: $31,273,000
Other: $17,364,000
General Local Government Support: $12,703,000
Public Welfare: $1,131,000
Public Welfare: $1,105,000
Housing and Community Development: $808,000
Housing and Community Development: $322,000
- Tax - Property: $138,724,000
Property: $132,036,000
General Sales and Gross Receipts: $25,371,000
Other Selective Sales: $13,884,000
General Sales and Gross Receipts: $11,426,000
Occupation and Business License - Other: $8,648,000
Occupation and Business License - Other: $8,397,000
Other License: $670,000
Other License: $408,000
Public Utility License: $344,000
Motor Vehicle License: $179,000
Motor Vehicle License: $171,000
- Total Salaries and Wages: $89,143,000
: $83,426,000
- Water Utilities - Interest on Debt: $7,731,000
James City County government finances - Revenue in 2018:
- Charges - Sewerage: $6,507,000
Parks and Recreation: $3,778,000
Parks and Recreation: $2,845,000
Other: $2,578,000
Other: $2,276,000
Elementary and Secondary Education School Lunch: $1,838,000
Elementary and Secondary Education School Lunch: $1,298,000
Solid Waste Management: $1,170,000
Solid Waste Management: $310,000
Elementary and Secondary Education School Tuition and Transportation: $223,000
Elementary and Secondary Education School Tuition and Transportation: $196,000
Elementary and Secondary Education - Other: $75,000
Elementary and Secondary Education - Other: $68,000
- Construction - Local Fire Protection: $6,466,000
Elementary and Secondary Education: $1,308,000
Natural Resources - Other: $1,010,000
Judicial and Legal Services: $1,004,000
Parks and Recreation: $933,000
General Public Buildings: $648,000
Elementary and Secondary Education: $528,000
General Public Buildings: $371,000
Housing and Community Development: $316,000
Parks and Recreation: $310,000
Central Staff Services: $206,000
Local Fire Protection: $47,000
Police Protection: $9,000
- Current Operations - Elementary and Secondary Education: $146,991,000
Elementary and Secondary Education: $138,898,000
Police Protection: $14,493,000
Local Fire Protection: $12,993,000
Police Protection: $12,442,000
Local Fire Protection: $11,228,000
Housing and Community Development: $9,819,000
Parks and Recreation: $7,189,000
Public Welfare - Other: $6,912,000
General Public Buildings: $6,523,000
Parks and Recreation: $5,862,000
General - Other: $5,362,000
Judicial and Legal Services: $5,289,000
Central Staff Services: $5,271,000
Central Staff Services: $5,087,000
Libraries: $4,933,000
Judicial and Legal Services: $4,874,000
Public Welfare - Other: $4,704,000
Libraries: $4,514,000
Financial Administration: $4,464,000
General Public Buildings: $4,301,000
Financial Administration: $4,222,000
Health - Other: $3,835,000
Health - Other: $3,558,000
Solid Waste Management: $3,274,000
Correctional Institutions: $2,729,000
Housing and Community Development: $2,360,000
Correctional Institutions: $2,243,000
Solid Waste Management: $2,124,000
Natural Resources - Other: $2,123,000
Protective Inspection and Regulation - Other: $1,493,000
Natural Resources - Other: $1,255,000
Protective Inspection and Regulation - Other: $1,236,000
Corrections - Other: $1,081,000
Corrections - Other: $978,000
Transit Utilities: $709,000
- Federal Intergovernmental - Other: $6,562,000
Public Welfare: $2,626,000
Public Welfare: $2,082,000
Housing and Community Development: $1,397,000
Housing and Community Development: $967,000
General Local Government Support: $487,000
Other: $399,000
Education: $316,000
Education: $267,000
General Local Government Support: $7,000
- General - Interest on Debt: $5,447,000
- Intergovernmental to Local - Other - General - Other: $102,554,000
Other - General - Other: $98,612,000
- Local Intergovernmental - General Local Government Support: $567,000
Education: $563,000
Other: $388,000
Education: $292,000
- Long Term Debt - Beginning Outstanding - Unspecified Public Purpose: $187,280,000
Outstanding Unspecified Public Purpose: $170,146,000
Beginning Outstanding - Unspecified Public Purpose: $146,150,000
Outstanding Unspecified Public Purpose: $131,507,000
Retired Unspecified Public Purpose: $17,134,000
Retired Unspecified Public Purpose: $14,643,000
Outstanding Nonguaranteed - Industrial Revenue: $6,000,000
Beginning Outstanding - Public Debt for Private Purpose: $6,000,000
Outstanding Nonguaranteed - Industrial Revenue: $6,000,000
Beginning Outstanding - Public Debt for Private Purpose: $6,000,000
- Miscellaneous - General Revenue - Other: $3,062,000
General Revenue - Other: $1,416,000
Interest Earnings: $767,000
Interest Earnings: $316,000
Fines and Forfeits: $298,000
Fines and Forfeits: $232,000
Rents: $225,000
Rents: $199,000
Sale of Property: $152,000
Sale of Property: $77,000
Donations From Private Sources: $35,000
Donations From Private Sources: $4,000
- Other Capital Outlay - Elementary and Secondary Education: $22,054,000
Elementary and Secondary Education: $6,293,000
General - Other: $5,614,000
Local Fire Protection: $1,319,000
Central Staff Services: $1,282,000
General Public Building: $265,000
Local Fire Protection: $259,000
General - Other: $242,000
Central Staff Services: $175,000
Police Protection: $148,000
Housing and Community Development: $131,000
Judicial and Legal Services: $103,000
Parks and Recreation: $81,000
Parks and Recreation: $19,000
Financial Administration: $10,000
- Other Funds - Cash and Securities: $120,241,000
Cash and Securities: $87,405,000
- Revenue - Water Utilities: $8,083,000
- Sinking Funds - Cash and Securities: $8,380,000
Cash and Securities: $6,228,000
- State Intergovernmental - Education: $57,260,000
Education: $55,500,000
General Local Government Support: $31,273,000
Other: $17,364,000
General Local Government Support: $12,703,000
Public Welfare: $1,131,000
Public Welfare: $1,105,000
Housing and Community Development: $808,000
Housing and Community Development: $322,000
- Tax - Property: $138,724,000
Property: $132,036,000
General Sales and Gross Receipts: $25,371,000
Other Selective Sales: $13,884,000
General Sales and Gross Receipts: $11,426,000
Occupation and Business License - Other: $8,648,000
Occupation and Business License - Other: $8,397,000
Other License: $670,000
Other License: $408,000
Public Utility License: $344,000
Motor Vehicle License: $179,000
Motor Vehicle License: $171,000
- Total Salaries and Wages: $89,143,000
: $83,426,000
- Water Utilities - Interest on Debt: $7,731,000
James City County government finances - Debt in 2018:
- Charges - Sewerage: $6,507,000
Parks and Recreation: $3,778,000
Parks and Recreation: $2,845,000
Other: $2,578,000
Other: $2,276,000
Elementary and Secondary Education School Lunch: $1,838,000
Elementary and Secondary Education School Lunch: $1,298,000
Solid Waste Management: $1,170,000
Solid Waste Management: $310,000
Elementary and Secondary Education School Tuition and Transportation: $223,000
Elementary and Secondary Education School Tuition and Transportation: $196,000
Elementary and Secondary Education - Other: $75,000
Elementary and Secondary Education - Other: $68,000
- Construction - Local Fire Protection: $6,466,000
Elementary and Secondary Education: $1,308,000
Natural Resources - Other: $1,010,000
Judicial and Legal Services: $1,004,000
Parks and Recreation: $933,000
General Public Buildings: $648,000
Elementary and Secondary Education: $528,000
General Public Buildings: $371,000
Housing and Community Development: $316,000
Parks and Recreation: $310,000
Central Staff Services: $206,000
Local Fire Protection: $47,000
Police Protection: $9,000
- Current Operations - Elementary and Secondary Education: $146,991,000
Elementary and Secondary Education: $138,898,000
Police Protection: $14,493,000
Local Fire Protection: $12,993,000
Police Protection: $12,442,000
Local Fire Protection: $11,228,000
Housing and Community Development: $9,819,000
Parks and Recreation: $7,189,000
Public Welfare - Other: $6,912,000
General Public Buildings: $6,523,000
Parks and Recreation: $5,862,000
General - Other: $5,362,000
Judicial and Legal Services: $5,289,000
Central Staff Services: $5,271,000
Central Staff Services: $5,087,000
Libraries: $4,933,000
Judicial and Legal Services: $4,874,000
Public Welfare - Other: $4,704,000
Libraries: $4,514,000
Financial Administration: $4,464,000
General Public Buildings: $4,301,000
Financial Administration: $4,222,000
Health - Other: $3,835,000
Health - Other: $3,558,000
Solid Waste Management: $3,274,000
Correctional Institutions: $2,729,000
Housing and Community Development: $2,360,000
Correctional Institutions: $2,243,000
Solid Waste Management: $2,124,000
Natural Resources - Other: $2,123,000
Protective Inspection and Regulation - Other: $1,493,000
Natural Resources - Other: $1,255,000
Protective Inspection and Regulation - Other: $1,236,000
Corrections - Other: $1,081,000
Corrections - Other: $978,000
Transit Utilities: $709,000
- Federal Intergovernmental - Other: $6,562,000
Public Welfare: $2,626,000
Public Welfare: $2,082,000
Housing and Community Development: $1,397,000
Housing and Community Development: $967,000
General Local Government Support: $487,000
Other: $399,000
Education: $316,000
Education: $267,000
General Local Government Support: $7,000
- General - Interest on Debt: $5,447,000
- Intergovernmental to Local - Other - General - Other: $102,554,000
Other - General - Other: $98,612,000
- Local Intergovernmental - General Local Government Support: $567,000
Education: $563,000
Other: $388,000
Education: $292,000
- Long Term Debt - Beginning Outstanding - Unspecified Public Purpose: $187,280,000
Outstanding Unspecified Public Purpose: $170,146,000
Beginning Outstanding - Unspecified Public Purpose: $146,150,000
Outstanding Unspecified Public Purpose: $131,507,000
Retired Unspecified Public Purpose: $17,134,000
Retired Unspecified Public Purpose: $14,643,000
Outstanding Nonguaranteed - Industrial Revenue: $6,000,000
Beginning Outstanding - Public Debt for Private Purpose: $6,000,000
Outstanding Nonguaranteed - Industrial Revenue: $6,000,000
Beginning Outstanding - Public Debt for Private Purpose: $6,000,000
- Miscellaneous - General Revenue - Other: $3,062,000
General Revenue - Other: $1,416,000
Interest Earnings: $767,000
Interest Earnings: $316,000
Fines and Forfeits: $298,000
Fines and Forfeits: $232,000
Rents: $225,000
Rents: $199,000
Sale of Property: $152,000
Sale of Property: $77,000
Donations From Private Sources: $35,000
Donations From Private Sources: $4,000
- Other Capital Outlay - Elementary and Secondary Education: $22,054,000
Elementary and Secondary Education: $6,293,000
General - Other: $5,614,000
Local Fire Protection: $1,319,000
Central Staff Services: $1,282,000
General Public Building: $265,000
Local Fire Protection: $259,000
General - Other: $242,000
Central Staff Services: $175,000
Police Protection: $148,000
Housing and Community Development: $131,000
Judicial and Legal Services: $103,000
Parks and Recreation: $81,000
Parks and Recreation: $19,000
Financial Administration: $10,000
- Other Funds - Cash and Securities: $120,241,000
Cash and Securities: $87,405,000
- Revenue - Water Utilities: $8,083,000
- Sinking Funds - Cash and Securities: $8,380,000
Cash and Securities: $6,228,000
- State Intergovernmental - Education: $57,260,000
Education: $55,500,000
General Local Government Support: $31,273,000
Other: $17,364,000
General Local Government Support: $12,703,000
Public Welfare: $1,131,000
Public Welfare: $1,105,000
Housing and Community Development: $808,000
Housing and Community Development: $322,000
- Tax - Property: $138,724,000
Property: $132,036,000
General Sales and Gross Receipts: $25,371,000
Other Selective Sales: $13,884,000
General Sales and Gross Receipts: $11,426,000
Occupation and Business License - Other: $8,648,000
Occupation and Business License - Other: $8,397,000
Other License: $670,000
Other License: $408,000
Public Utility License: $344,000
Motor Vehicle License: $179,000
Motor Vehicle License: $171,000
- Total Salaries and Wages: $89,143,000
: $83,426,000
- Water Utilities - Interest on Debt: $7,731,000
James City County government finances - Cash and Securities in 2018:
- Charges - Sewerage: $6,507,000
Parks and Recreation: $3,778,000
Parks and Recreation: $2,845,000
Other: $2,578,000
Other: $2,276,000
Elementary and Secondary Education School Lunch: $1,838,000
Elementary and Secondary Education School Lunch: $1,298,000
Solid Waste Management: $1,170,000
Solid Waste Management: $310,000
Elementary and Secondary Education School Tuition and Transportation: $223,000
Elementary and Secondary Education School Tuition and Transportation: $196,000
Elementary and Secondary Education - Other: $75,000
Elementary and Secondary Education - Other: $68,000
- Construction - Local Fire Protection: $6,466,000
Elementary and Secondary Education: $1,308,000
Natural Resources - Other: $1,010,000
Judicial and Legal Services: $1,004,000
Parks and Recreation: $933,000
General Public Buildings: $648,000
Elementary and Secondary Education: $528,000
General Public Buildings: $371,000
Housing and Community Development: $316,000
Parks and Recreation: $310,000
Central Staff Services: $206,000
Local Fire Protection: $47,000
Police Protection: $9,000
- Current Operations - Elementary and Secondary Education: $146,991,000
Elementary and Secondary Education: $138,898,000
Police Protection: $14,493,000
Local Fire Protection: $12,993,000
Police Protection: $12,442,000
Local Fire Protection: $11,228,000
Housing and Community Development: $9,819,000
Parks and Recreation: $7,189,000
Public Welfare - Other: $6,912,000
General Public Buildings: $6,523,000
Parks and Recreation: $5,862,000
General - Other: $5,362,000
Judicial and Legal Services: $5,289,000
Central Staff Services: $5,271,000
Central Staff Services: $5,087,000
Libraries: $4,933,000
Judicial and Legal Services: $4,874,000
Public Welfare - Other: $4,704,000
Libraries: $4,514,000
Financial Administration: $4,464,000
General Public Buildings: $4,301,000
Financial Administration: $4,222,000
Health - Other: $3,835,000
Health - Other: $3,558,000
Solid Waste Management: $3,274,000
Correctional Institutions: $2,729,000
Housing and Community Development: $2,360,000
Correctional Institutions: $2,243,000
Solid Waste Management: $2,124,000
Natural Resources - Other: $2,123,000
Protective Inspection and Regulation - Other: $1,493,000
Natural Resources - Other: $1,255,000
Protective Inspection and Regulation - Other: $1,236,000
Corrections - Other: $1,081,000
Corrections - Other: $978,000
Transit Utilities: $709,000
- Federal Intergovernmental - Other: $6,562,000
Public Welfare: $2,626,000
Public Welfare: $2,082,000
Housing and Community Development: $1,397,000
Housing and Community Development: $967,000
General Local Government Support: $487,000
Other: $399,000
Education: $316,000
Education: $267,000
General Local Government Support: $7,000
- General - Interest on Debt: $5,447,000
- Intergovernmental to Local - Other - General - Other: $102,554,000
Other - General - Other: $98,612,000
- Local Intergovernmental - General Local Government Support: $567,000
Education: $563,000
Other: $388,000
Education: $292,000
- Long Term Debt - Beginning Outstanding - Unspecified Public Purpose: $187,280,000
Outstanding Unspecified Public Purpose: $170,146,000
Beginning Outstanding - Unspecified Public Purpose: $146,150,000
Outstanding Unspecified Public Purpose: $131,507,000
Retired Unspecified Public Purpose: $17,134,000
Retired Unspecified Public Purpose: $14,643,000
Outstanding Nonguaranteed - Industrial Revenue: $6,000,000
Beginning Outstanding - Public Debt for Private Purpose: $6,000,000
Outstanding Nonguaranteed - Industrial Revenue: $6,000,000
Beginning Outstanding - Public Debt for Private Purpose: $6,000,000
- Miscellaneous - General Revenue - Other: $3,062,000
General Revenue - Other: $1,416,000
Interest Earnings: $767,000
Interest Earnings: $316,000
Fines and Forfeits: $298,000
Fines and Forfeits: $232,000
Rents: $225,000
Rents: $199,000
Sale of Property: $152,000
Sale of Property: $77,000
Donations From Private Sources: $35,000
Donations From Private Sources: $4,000
- Other Capital Outlay - Elementary and Secondary Education: $22,054,000
Elementary and Secondary Education: $6,293,000
General - Other: $5,614,000
Local Fire Protection: $1,319,000
Central Staff Services: $1,282,000
General Public Building: $265,000
Local Fire Protection: $259,000
General - Other: $242,000
Central Staff Services: $175,000
Police Protection: $148,000
Housing and Community Development: $131,000
Judicial and Legal Services: $103,000
Parks and Recreation: $81,000
Parks and Recreation: $19,000
Financial Administration: $10,000
- Other Funds - Cash and Securities: $120,241,000
Cash and Securities: $87,405,000
- Revenue - Water Utilities: $8,083,000
- Sinking Funds - Cash and Securities: $8,380,000
Cash and Securities: $6,228,000
- State Intergovernmental - Education: $57,260,000
Education: $55,500,000
General Local Government Support: $31,273,000
Other: $17,364,000
General Local Government Support: $12,703,000
Public Welfare: $1,131,000
Public Welfare: $1,105,000
Housing and Community Development: $808,000
Housing and Community Development: $322,000
- Tax - Property: $138,724,000
Property: $132,036,000
General Sales and Gross Receipts: $25,371,000
Other Selective Sales: $13,884,000
General Sales and Gross Receipts: $11,426,000
Occupation and Business License - Other: $8,648,000
Occupation and Business License - Other: $8,397,000
Other License: $670,000
Other License: $408,000
Public Utility License: $344,000
Motor Vehicle License: $179,000
Motor Vehicle License: $171,000
- Total Salaries and Wages: $89,143,000
: $83,426,000
- Water Utilities - Interest on Debt: $7,731,000
Supplemental Security Income (SSI) in 2006:
- Total number of recipients: 409
- Number of aged recipients: 38
- Number of blind and disabled recipients: 371
- Number of recipients under 18: 104
- Number of recipients between 18 and 64: 236
- Number of recipients older than 64: 69
- Number of recipients also receiving OASDI: 124
- Amount of payments (thousands of dollars): 176
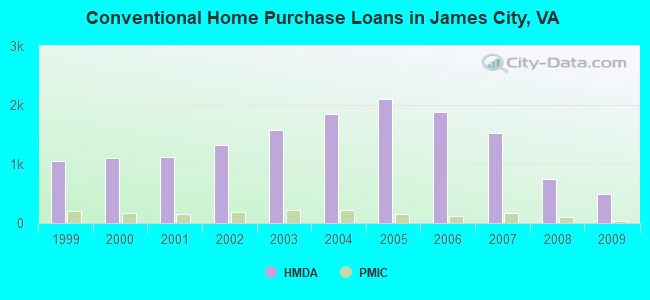
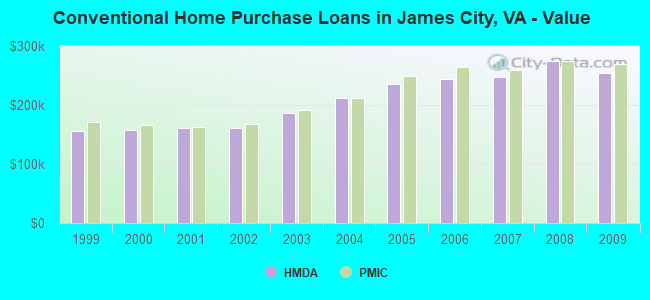
| Home Mortgage Disclosure Act Aggregated Statistics For Year 2009 (Based on 8 full tracts) | ||||||||||||||
| A) FHA, FSA/RHS & VA Home Purchase Loans | B) Conventional Home Purchase Loans | C) Refinancings | D) Home Improvement Loans | E) Loans on Dwellings For 5+ Families | F) Non-occupant Loans on < 5 Family Dwellings (A B C & D) | G) Loans On Manufactured Home Dwelling (A B C & D) | ||||||||
|---|---|---|---|---|---|---|---|---|---|---|---|---|---|---|
| Number | Average Value | Number | Average Value | Number | Average Value | Number | Average Value | Number | Average Value | Number | Average Value | Number | Average Value | |
| LOANS ORIGINATED | 435 | $259,131 | 492 | $253,518 | 2,893 | $252,353 | 101 | $138,743 | 1 | $100,000 | 208 | $225,817 | 4 | $84,000 |
| APPLICATIONS APPROVED, NOT ACCEPTED | 12 | $270,750 | 26 | $316,692 | 156 | $252,994 | 12 | $58,000 | 0 | $0 | 12 | $182,250 | 0 | $0 |
| APPLICATIONS DENIED | 35 | $298,886 | 29 | $218,862 | 622 | $260,461 | 59 | $85,831 | 0 | $0 | 52 | $319,538 | 12 | $85,417 |
| APPLICATIONS WITHDRAWN | 47 | $299,319 | 56 | $264,179 | 524 | $260,660 | 23 | $161,609 | 0 | $0 | 38 | $197,368 | 1 | $468,000 |
| FILES CLOSED FOR INCOMPLETENESS | 3 | $220,333 | 12 | $235,667 | 130 | $253,854 | 6 | $116,500 | 0 | $0 | 13 | $170,000 | 1 | $219,000 |
| Private Mortgage Insurance Companies Aggregated Statistics For Year 2009 (Based on 7 full tracts) | ||||||
| A) Conventional Home Purchase Loans | B) Refinancings | C) Non-occupant Loans on < 5 Family Dwellings (A & B) | ||||
|---|---|---|---|---|---|---|
| Number | Average Value | Number | Average Value | Number | Average Value | |
| LOANS ORIGINATED | 40 | $268,650 | 53 | $297,038 | 4 | $188,000 |
| APPLICATIONS APPROVED, NOT ACCEPTED | 18 | $301,278 | 15 | $306,200 | 4 | $414,750 |
| APPLICATIONS DENIED | 13 | $353,077 | 17 | $247,706 | 1 | $169,000 |
| APPLICATIONS WITHDRAWN | 4 | $259,000 | 6 | $258,167 | 0 | $0 |
| FILES CLOSED FOR INCOMPLETENESS | 3 | $428,000 | 0 | $0 | 1 | $736,000 |
James City County on our top lists:
- #43 on the list of "Top 101 counties with the largest number of children under 18 without health insurance coverage in 2000"