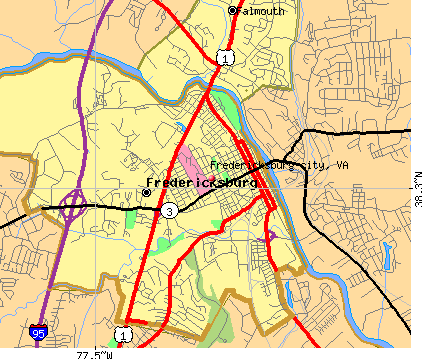
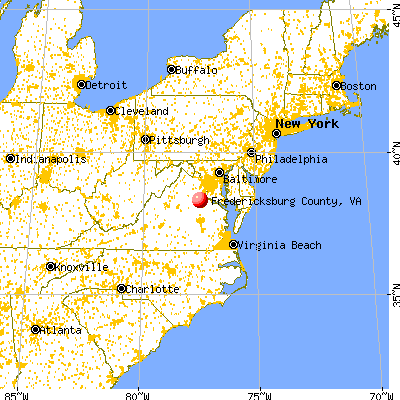
Fredericksburg city, Virginia (VA)
County owner-occupied free and clear houses and condos in 2010: 914
County owner-occupied houses and condos in 2000: 2,876
Renter-occupied apartments: 5,882 (it was 5,226 in 2000)
| % of renters here: | 65% |
| State: | 33% |
Land area: 11 sq. mi.
Water area: 0.0 sq. mi.
Population density: 2705 people per square mile (very high).
Industries providing employment: Educational, health and social services (24.2%), Professional, scientific, management, administrative, and waste management services (18.5%), Public administration (11.1%), Retail trade (10.9%).
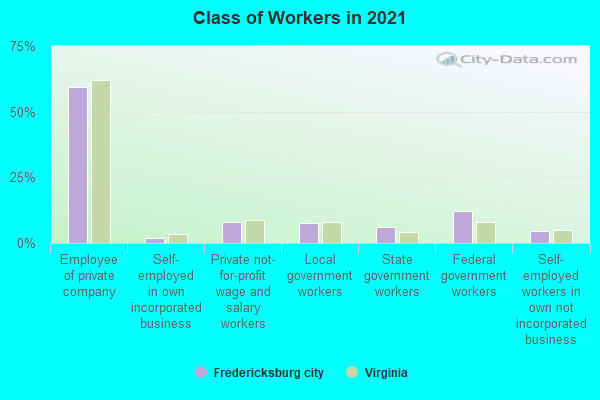
Type of workers:
- Private wage or salary: 69%
- Government: 26%
- Self-employed, not incorporated: 4%
- Unpaid family work: 0%
- OSM Map
- General Map
- Google Map
- MSN Map

- 15,84355.4%White Non-Hispanic Alone
- 5,81220.3%Black Non-Hispanic Alone
- 3,46312.1%Hispanic or Latino
- 2,0527.2%Two or more races
- 1,0973.8%Asian alone
- 2741.0%Some other race alone
- 500.2%American Indian and Alaska Native alone

| Median resident age: | 31.1 years |
| Virginia median age: | 39.0 years |
| Males: 13,296 | |
| Females: 15,155 |

 | Is This An Accurate Map of Virginia's Regions? (53 replies) |
| Where is Northern Virginia? (25 replies) |
| Young Family of 4 Moving to Stafford, VA (7 replies) |
| Fredericksburg Crime Committed by Homeless (0 replies) |
| Where to live when working in Stafford, VA? (7 replies) |
| Yet ANOTHER Relocation Thread (27 replies) |
| Fredericksburg city: | 2.0 people |
| Virginia: | 3 people |
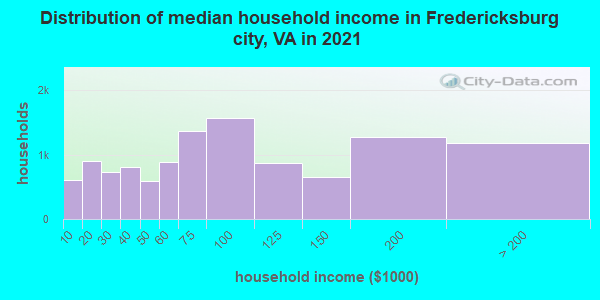
Estimated median household income in 2022: $82,128 ($34,585 in 1999)
| This county: | $82,128 |
| Virginia: | $85,873 |
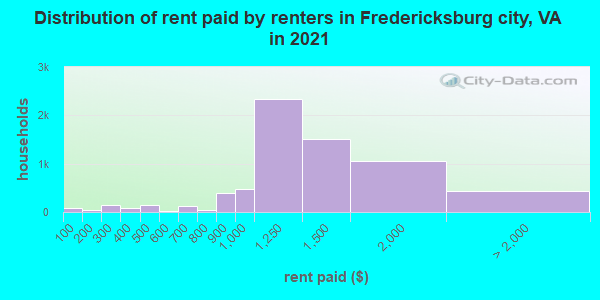
Median contract rent in 2022 for apartments: $1,342 (lower quartile is $1,038, upper quartile is $1,711)
| This county: | $1342 |
| State: | $1270 |
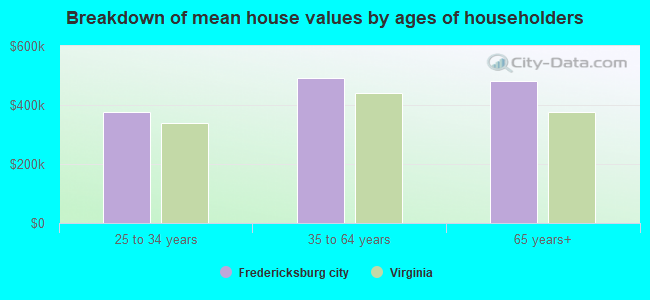
Estimated median house or condo value in 2022: $471,815 (it was $134,500 in 2000)
| Fredericksburg city: | $471,815 |
| Virginia: | $365,700 |
Mean price in 2022:
Median monthly housing costs for homes and condos with a mortgage: $2,171Detached houses: $482,093
Here: $482,093 State: $472,865 Townhouses or other attached units: $438,932
Here: $438,932 State: $457,437 In 5-or-more-unit structures: $384,422
Here: $384,422 State: $382,551 Mobile homes: $67,249
Here: $67,249 State: $100,736
Median monthly housing costs for units without a mortgage: $622
Institutionalized population: 90
Median real estate property taxes paid for housing units with mortgages in 2022: $2,859 (0.6%)
Median real estate property taxes paid for housing units with no mortgage in 2022: $2,813 (0.6%)

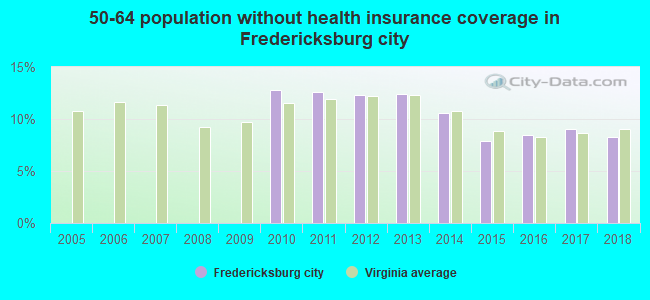
| Fredericksburg city: | 19.1% |
| Virginia: | 10.6% |
Median age of residents in 2022: 31.1 years old
(Males: 31.1 years old, Females: 31.4 years old)
(Median age for: White residents: 33.5 years old, Black residents: 34.5 years old, American Indian residents: 66.3 years old, Asian residents: 33.8 years old, Hispanic or Latino residents: 23.7 years old, Other race residents: 22.2 years old)
Area name: Washington-Arlington-Alexandria, DC-VA-MD HUD Metro FMR Area
Fair market rent in 2006 for a 1-bedroom apartment in Fredericksburg city is $1080 a month.
Fair market rent for a 2-bedroom apartment is $1225 a month.
Fair market rent for a 3-bedroom apartment is $1580 a month.
Cities in this county include: Fredericksburg.
Neighboring counties: Gallatin County, Kentucky  .
.
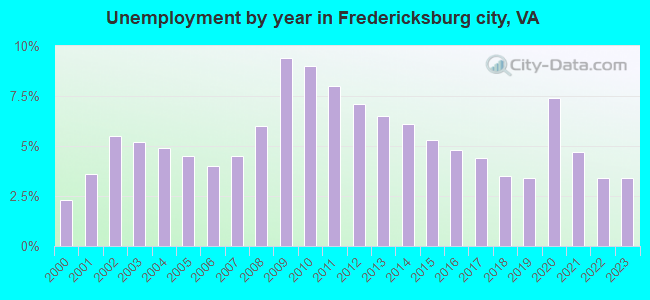
| Here: | 3.1% |
| Virginia: | 2.7% |
Current college students: 3,503
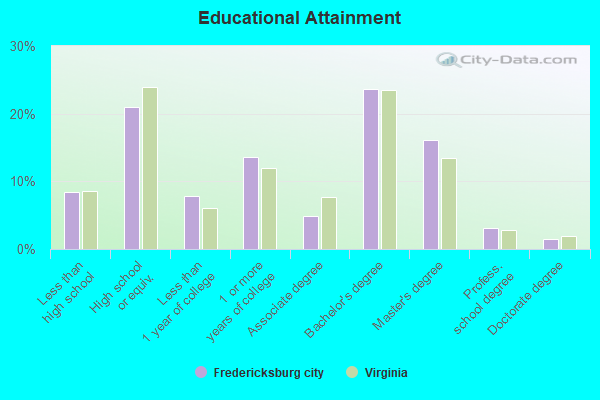
People 25 years of age or older with a high school degree or higher: 92.5%
People 25 years of age or older with a bachelor's degree or higher: 43.5%
Number of foreign born residents: 3,241 (37.0% naturalized citizens)
| Fredericksburg city: | 11.4% |
| Whole state: | 12.7% |
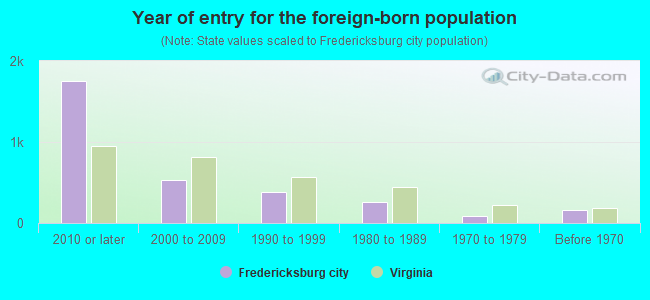
- Year of entry for the foreign-born population
- 2,0472010 or later
- 6562000 to 2009
- 3381990 to 1999
- 2611980 to 1989
- 871970 to 1979
- 159Before 1970
Mean travel time to work (commute): minutes
Percentage of county residents living and working in this county: 96.1%
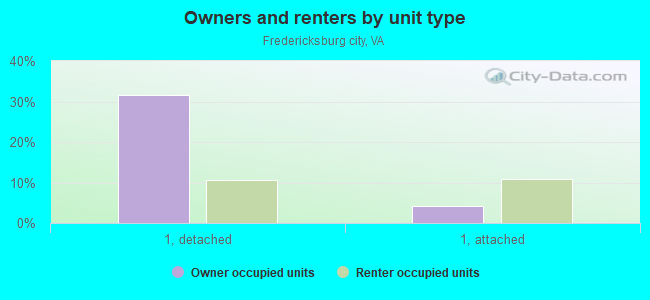
Housing units in structures:
- One, detached: 5,037
- One, attached: 1,312
- Two: 261
- 3 or 4: 340
- 5 to 9: 1,201
- 10 to 19: 2,380
- 20 to 49: 978
- 50 or more: 683
- Mobile homes: 54
- Boats, RVs, vans, etc.: 8
Housing units in Fredericksburg city with a mortgage: 3,187 (222 second mortgage, 0 home equity loan, 188 both second mortgage and home equity loan)
Houses without a mortgage: 95
| Here: | 3.1% with mortgage |
| State: | 97.2% with mortgage |
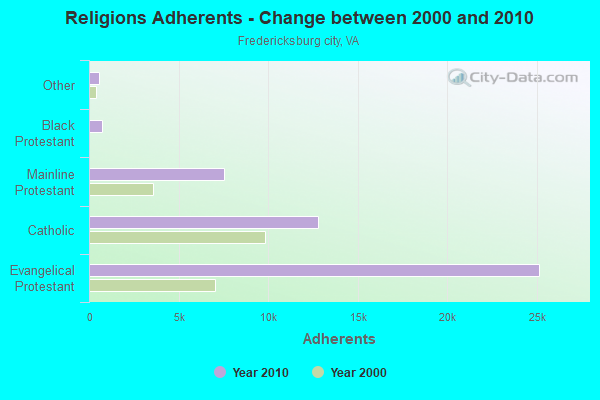
Religion statistics for Fredericksburg city
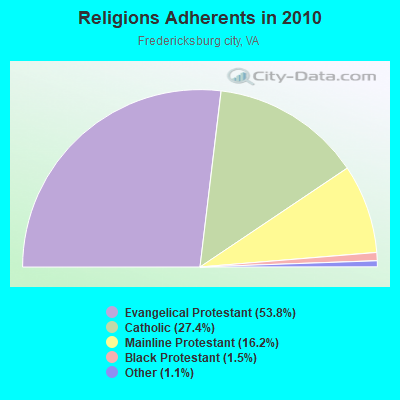
| Religion | Adherents | Congregations |
|---|---|---|
| Evangelical Protestant | 25,152 | 59 |
| Catholic | 12,785 | 1 |
| Mainline Protestant | 7,551 | 10 |
| Black Protestant | 716 | 1 |
| Other | 537 | 4 |
| Orthodox | - | - |
| None | - | - |
Source: Clifford Grammich, Kirk Hadaway, Richard Houseal, Dale E.Jones, Alexei Krindatch, Richie Stanley and Richard H.Taylor. 2012. 2010 U.S.Religion Census: Religious Congregations & Membership Study. Association of Statisticians of American Religious Bodies. Jones, Dale E., et al. 2002. Congregations and Membership in the United States 2000. Nashville, TN: Glenmary Research Center.
Food Environment Statistics:
| Fredericksburg city: | 2.68 / 10,000 pop. |
| State: | 2.03 / 10,000 pop. |
| Here: | 0.45 / 10,000 pop. |
| Virginia: | 0.17 / 10,000 pop. |
| This county: | 2.23 / 10,000 pop. |
| Virginia: | 1.43 / 10,000 pop. |
| Fredericksburg city: | 8.04 / 10,000 pop. |
| Virginia: | 4.03 / 10,000 pop. |
| This county: | 36.63 / 10,000 pop. |
| State: | 7.65 / 10,000 pop. |
| Fredericksburg city: | 9.0% |
| Virginia: | 9.3% |
| Fredericksburg city: | 26.2% |
| State: | 26.7% |
| Here: | 18.1% |
| State: | 18.6% |
Earthquake activity:
Fredericksburg city-area historical earthquake activity is significantly above Virginia state average. It is 54% smaller than the overall U.S. average.On 8/23/2011 at 17:51:04, a magnitude 5.8 (5.8 MW, Depth: 3.7 mi, Class: Moderate, Intensity: VI - VII) earthquake occurred 37.1 miles away from Fredericksburg city center
On 8/25/2011 at 05:07:52, a magnitude 4.5 (4.5 ML, Depth: 4.2 mi, Class: Light, Intensity: IV - V) earthquake occurred 36.5 miles away from the county center
On 12/9/2003 at 20:59:18, a magnitude 4.5 (4.5 ML, Depth: 6.2 mi) earthquake occurred 50.1 miles away from the county center
On 12/9/2003 at 20:59:14, a magnitude 4.5 (4.5 MB, 4.5 LG) earthquake occurred 54.8 miles away from the county center
On 8/24/2011 at 00:04:36, a magnitude 4.2 (4.2 ML) earthquake occurred 37.6 miles away from Fredericksburg city center
On 8/9/2020 at 12:07:37, a magnitude 5.1 (5.1 MW, Depth: 4.7 mi) earthquake occurred 235.8 miles away from the county center
Magnitude types: regional Lg-wave magnitude (LG), body-wave magnitude (MB), local magnitude (ML), moment magnitude (MW)
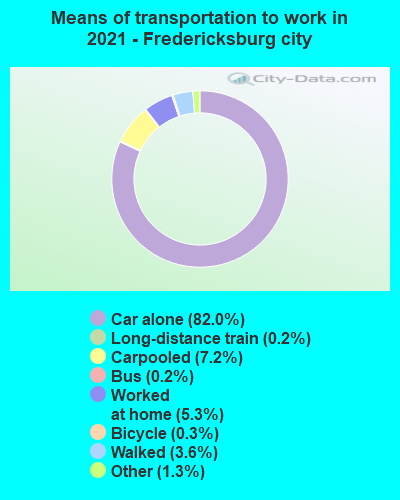
Means of transportation to work:
- Drove a car alone: 20,587 (76.0%)
- Carpooled: 2,367 (8.7%)
- Bus: 39 (0.1%)
- Long-distance train or commuter rail: 11 (0.0%)
- Taxicab, motorcycle, or other means: 507 (1.9%)
- Bicycle: 67 (0.2%)
- Walked: 716 (2.6%)
- Worked at home: 2,264 (8.4%)
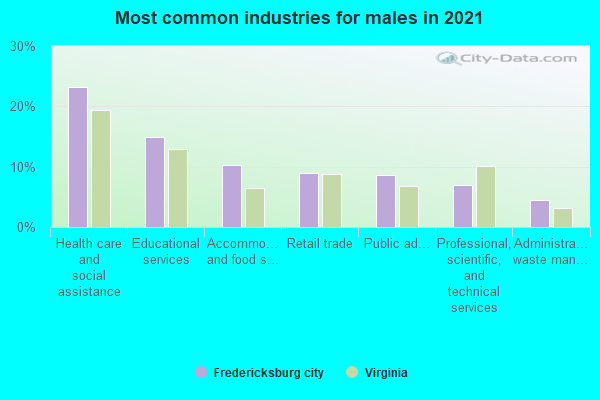
- Health care and social assistance (22%)
- Educational services (17%)
- Retail trade (9%)
- Accommodation and food services (9%)
- Professional, scientific, and technical services (8%)
- Public administration (7%)
- Administrative and support and waste management services (6%)

- Health care and social assistance (21%)
- Educational services (16%)
- Retail trade (9%)
- Accommodation and food services (8%)
- Professional, scientific, and technical services (8%)
- Public administration (7%)
- Administrative and support and waste management services (6%)
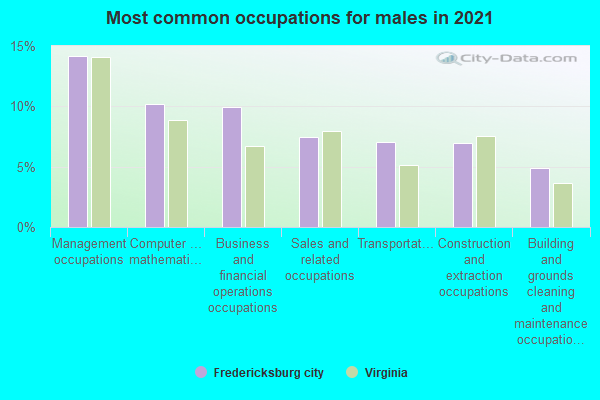
- Management occupations (12%)
- Computer and mathematical occupations (11%)
- Sales and related occupations (9%)
- Business and financial operations occupations (8%)
- Construction and extraction occupations (8%)
- Transportation occupations (7%)
- Office and administrative support occupations (5%)
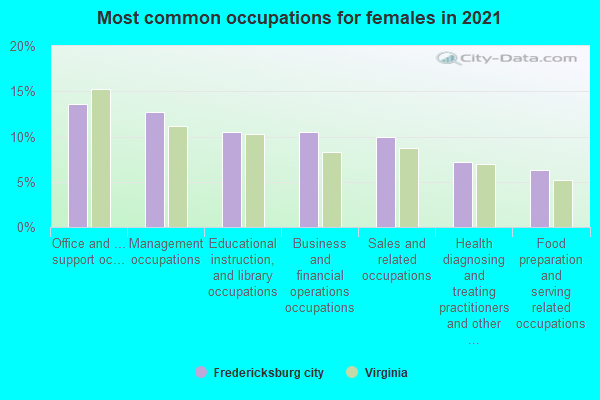
- Office and administrative support occupations (15%)
- Management occupations (14%)
- Business and financial operations occupations (13%)
- Educational instruction, and library occupations (11%)
- Sales and related occupations (8%)
- Health diagnosing and treating practitioners and other technical occupations (6%)
- Food preparation and serving related occupations (5%)

- Afghanistan (34%)
- Mexico (10%)
- El Salvador (9%)
- Honduras (8%)
- Iran (5%)
- Guatemala (4%)
- Russia (3%)
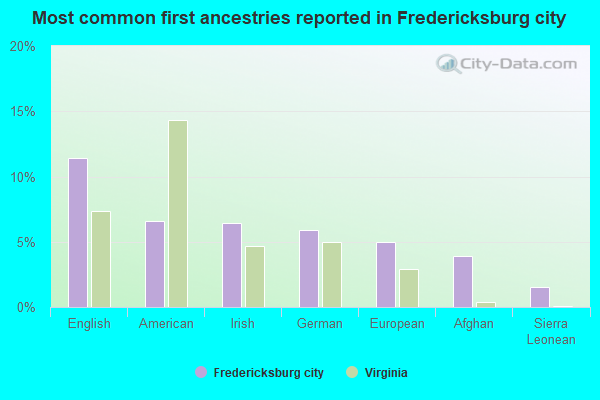
- English (10%)
- American (6%)
- Afghan (5%)
- Irish (5%)
- European (5%)
- German (4%)
- Sierra Leonean (1%)
People in group quarters in Fredericksburg city, Virginia in 2010:
- 2,329 people in college/university student housing
- 99 people in emergency and transitional shelters (with sleeping facilities) for people experiencing homelessness
- 78 people in nursing facilities/skilled-nursing facilities
- 60 people in other noninstitutional facilities
- 11 people in group homes intended for adults
- 8 people in residential treatment centers for juveniles (non-correctional)
- 7 people in workers' group living quarters and job corps centers
- 4 people in group homes for juveniles (non-correctional)
People in group quarters in Fredericksburg city, Virginia in 2000:
- 2,045 people in college dormitories (includes college quarters off campus)
- 150 people in other noninstitutional group quarters
- 48 people in short-term care, detention or diagnostic centers for delinquent children
- 45 people in local jails and other confinement facilities (including police lockups)
- 31 people in other nonhousehold living situations
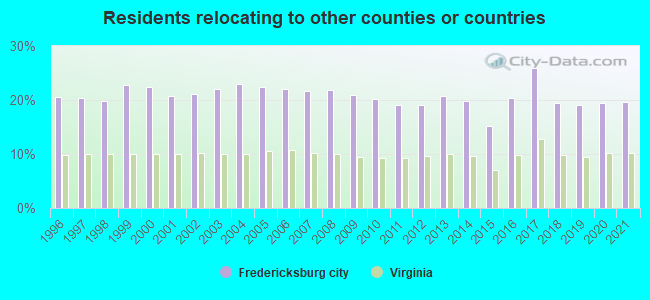
18.98% of this county's 2021 resident taxpayers lived in other counties in 2020 ($63,458 average adjusted gross income)
| Here: | 18.98% |
| Virginia average: | 10.16% |
10 or fewer of this county's residents moved from foreign countries.
14.42% relocated from other counties in Virginia ($47,383 average AGI)
4.56% relocated from other states ($16,075 average AGI)
Fredericksburg city: 4.56% Virginia average: 3.91%

Top counties from which taxpayers relocated into this county between 2020 and 2021:
| from Spotsylvania County, VA | |
| from Stafford County, VA | |
| from Prince William County, VA | |
| from Fairfax County, VA | |
| from Orange County, VA | |
| from King George County, VA | |
| from Caroline County, VA |
19.68% of this county's 2020 resident taxpayers moved to other counties in 2021 ($73,587 average adjusted gross income)
| Here: | 19.68% |
| Virginia average: | 10.20% |
10 or fewer of this county's residents moved to foreign countries.
15.08% relocated to other counties in Virginia ($55,124 average AGI)
4.60% relocated to other states ($18,463 average AGI)
Fredericksburg city: 4.60% Virginia average: 3.98%
Top counties to which taxpayers relocated from this county between 2020 and 2021:
| to Spotsylvania County, VA | |
| to Stafford County, VA | |
| to Caroline County, VA | |
| to Prince William County, VA | |
| to Fairfax County, VA | |
| to Richmond city, VA | |
| to King George County, VA |
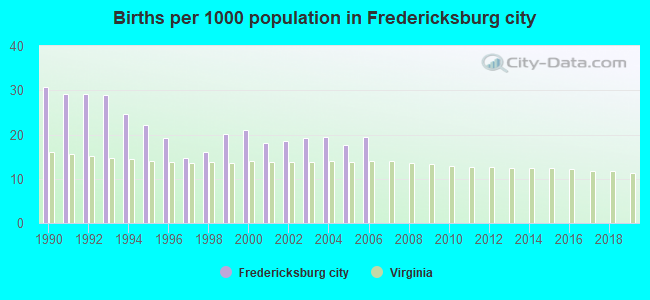
Births per 1000 population from 1990 to 1999: 23.5
Births per 1000 population from 2000 to 2006: 19.1
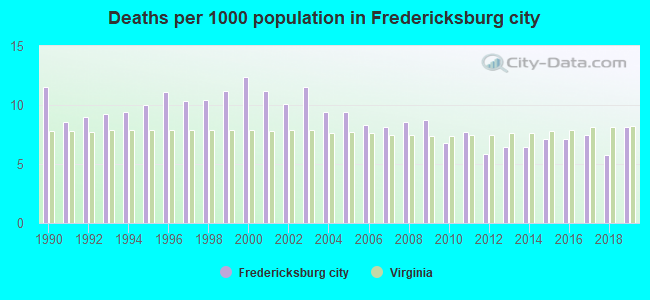
Deaths per 1000 population from 1990 to 1999: 10.1
Deaths per 1000 population from 2000 to 2009: 9.8
Deaths per 1000 population from 2010 to 2020: 7.0
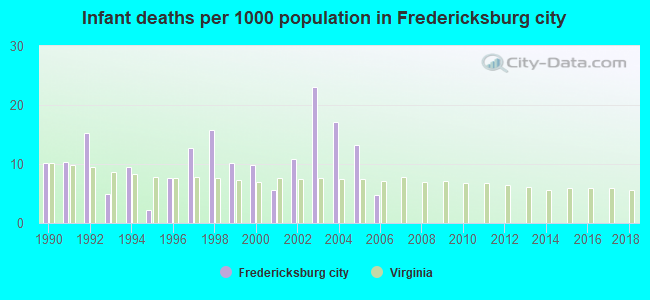
Infant deaths per 1000 live births from 1990 to 1999: 9.9
Infant deaths per 1000 live births from 2000 to 2006: 12.1
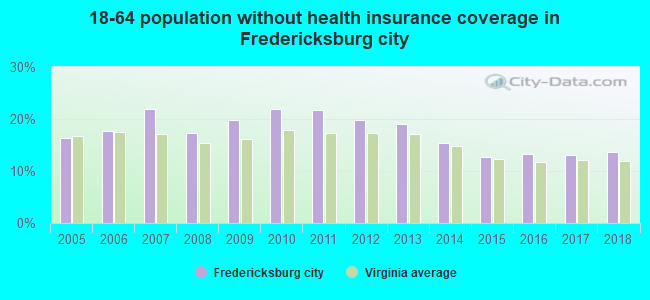
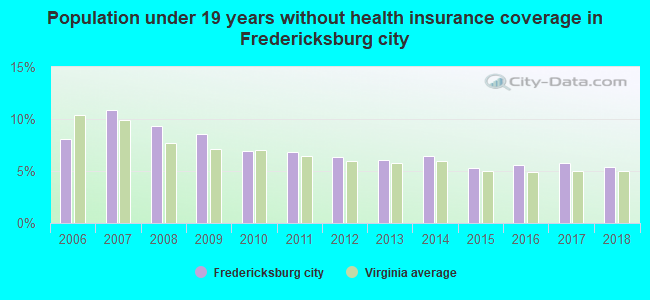
Persons under 19 years old without health insurance coverage in 2018: 5.4%

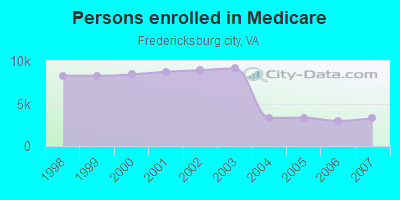
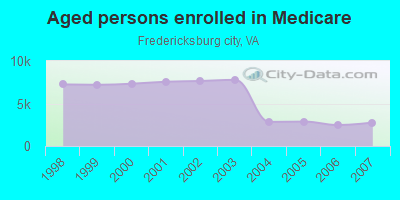
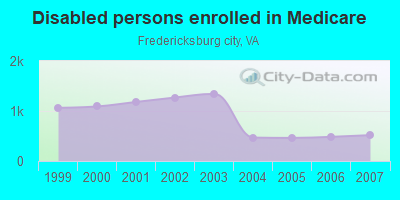
Persons enrolled in hospital insurance and/or supplemental medical insurance (Medicare) in July 1, 2007: 3,275 (2,758 aged, 517 disabled)
Children under 18 without health insurance coverage in 2007: 523 (10%)
Most common underlying causes of death in Fredericksburg city, Virginia in 1999 - 2019:
- Bronchus or lung, unspecified - Malignant neoplasms (219)
- Acute myocardial infarction, unspecified (177)
- Atherosclerotic heart disease (131)
- Alzheimer disease, unspecified (74)
- Unspecified dementia (49)
- Chronic obstructive pulmonary disease, unspecified (46)
- Septicaemia, unspecified (11)
- Pneumonia, unspecified (10)
- Stroke, not specified as haemorrhage or infarction (10)
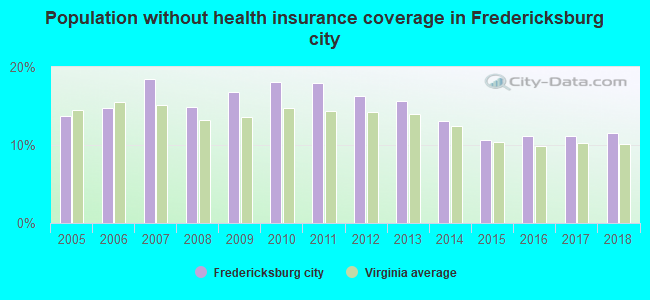
Population without health insurance coverage in 2000: 13%
Children under 18 without health insurance coverage in 2000: 11%
Short term general hospital admissions per 100,000 population in 2004: 118,589
Short term general hospital beds per 100,000 population in 2004: 1,994
Emergency room visits per 100,000 population in 2004: 384,231
General practice office based MDs per 100,000 population in 2005: 1,900
Medical specialist MDs per 100,000 population in 2005: 1,042
Dentists per 100,000 population in 1998: 29
Total births per 100,000 population, July 2005 - July 2006 : 92
Total deaths per 100,000 population, July 2005 - July 2006: 386
Limited-service eating places per 100,000 population in 2005 : 34
Beer, wine & liquor stores per 100,000 population in 2005: 1
Suicides per 1,000,000 population from 2000 to 2006: 159.3. This is more than state average.
Household type by relationship:
Households: 28,451- Male householders: 5,616 (1,884 living alone), Female householders: 5,973 (2,251 living alone)
4,149 spouses (4,088 opposite-sex spouses), 1,097 unmarried partners, (1,039 opposite-sex unmarried partners), 7,149 children (6,917 natural, 32 adopted, 214 stepchildren), 580 grandchildren, 218 brothers or sisters, 144 parents, 0 foster children, 201 other relatives, 989 non-relatives
- In group quarters: 2,361
Size of family households: 2,816 2-persons, 1,222 3-persons, 1,092 4-persons, 276 5-persons, 488 6-persons, 115 7-or-more-persons.
Size of nonfamily households: 4,135 1-person, 1,389 2-persons, 113 3-persons, 24 5-persons, 5 7-or-more-persons.
2,756 married couples with children.
2,567 single-parent households (508 men, 2,059 women).
83.3% of residents of Fredericksburg city speak English at home.
8.0% of residents speak Spanish at home (53% speak English very well, 21% speak English well, 26% speak English not well).
6.6% of residents speak other Indo-European language at home (54% speak English very well, 27% speak English well, 15% speak English not well, 4% don't speak English at all).
0.6% of residents speak Asian or Pacific Island language at home (45% speak English very well, 52% speak English well, 3% speak English not well).
1.1% of residents speak other language at home (70% speak English very well, 19% speak English well, 12% speak English not well).
In fiscal year 2004:
Federal Government expenditure: $325,991,000 ($15,935 per capita)
Department of Defense expenditure: $97,855,000
Federal direct payments to individuals for retirement and disability: $206,952,000
Federal other direct payments to individuals: $52,759,000
Federal direct payments not to individuals: $236,000
Federal grants: $20,719,000
Federal procurement contracts: $27,289,000 ($17,098,000 Department of Defense)
Federal salaries and wages: $18,036,000 ($264,000 Department of Defense)
Federal Government direct loans: $405,000
Federal guaranteed/insured loans: $15,568,000
Federal Government insurance: $0,000
Population change from April 1, 2000 to July 1, 2005:
Births: 2,027| Here: | 98 per 1000 residents |
| State: | 70 per 1000 residents |
Deaths: 1,176
| Here: | 57 per 1000 residents |
| State: | 40 per 1000 residents |
Net international migration: +250
| Here: | +12 per 1000 residents |
| State: | +18 per 1000 residents |
Net internal migration: +441
| Here: | +21 per 1000 residents |
| State: | +14 per 1000 residents |

Total withdrawal of fresh water for public supply: 0.98 millions of gallons per day (all from surface)
| Here: | 7.7 |
| State: | 7.0 |
| Here: | 3.9 |
| State: | 4.3 |
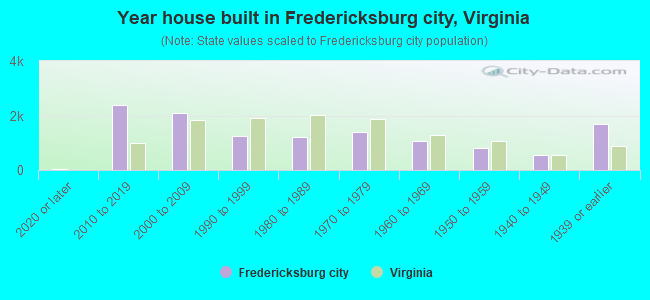
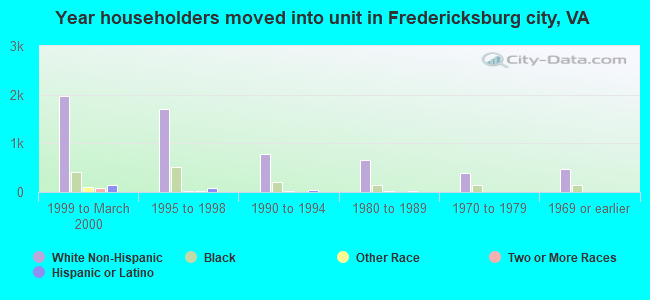
- Year house built in Fredericksburg city, Virginia
- 482020 or later
- 3,0062010 to 2019
- 1,8072000 to 2009
- 1,3721990 to 1999
- 9381980 to 1989
- 1,4361970 to 1979
- 9461960 to 1969
- 7471950 to 1959
- 5041940 to 1949
- 1,6941939 or earlier
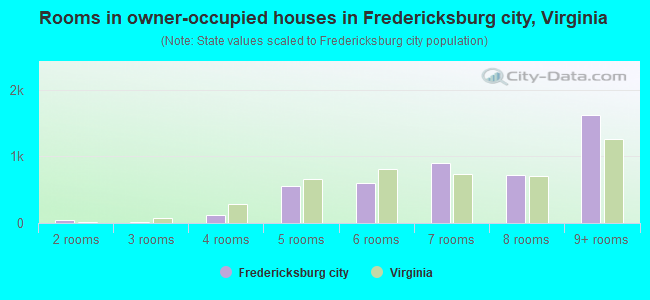
- Rooms in owner-occupied houses in Fredericksburg city, Virginia
- 01 room
- 172 rooms
- 483 rooms
- 1664 rooms
- 5565 rooms
- 4576 rooms
- 8707 rooms
- 6838 rooms
- 1,6889+ rooms
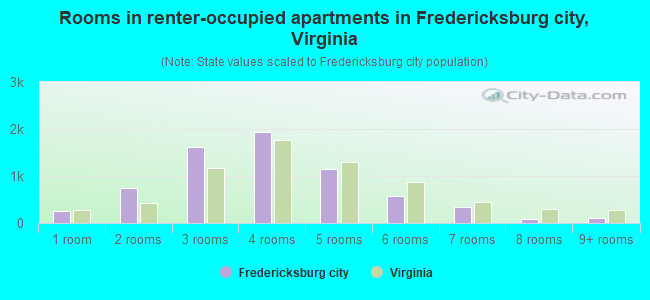
- Rooms in renter-occupied apartments in Fredericksburg city, Virginia
- 2681 room
- 5642 rooms
- 1,7843 rooms
- 1,9954 rooms
- 1,2355 rooms
- 5136 rooms
- 4007 rooms
- 1408 rooms
- 1399+ rooms
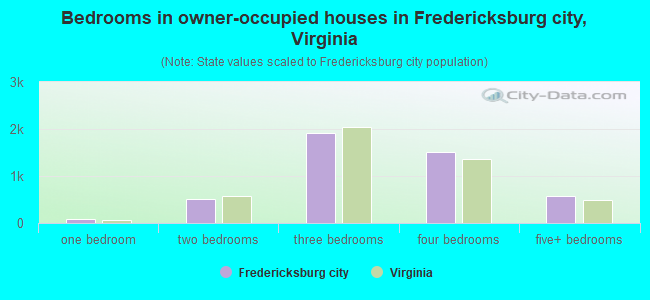
- Bedrooms in owner-occupied houses in Fredericksburg city, Virginia
- 0no bedroom
- 701 bedroom
- 5412 bedrooms
- 1,7433 bedrooms
- 1,5124 bedrooms
- 6265+ bedrooms
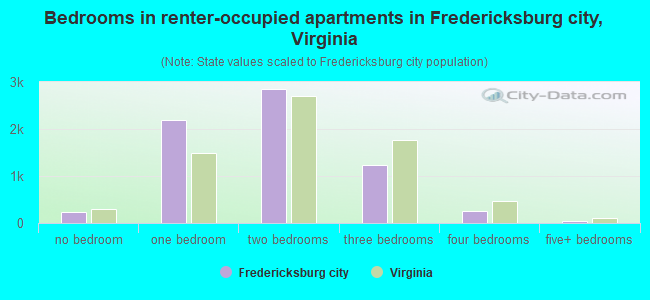
- Bedrooms in renter-occupied apartments in Fredericksburg city, Virginia
- 270no bedroom
- 2,0421 bedroom
- 2,6852 bedrooms
- 1,7313 bedrooms
- 2474 bedrooms
- 545+ bedrooms
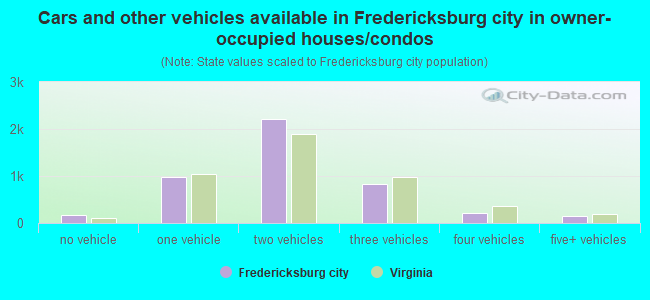
- Cars and other vehicles available in Fredericksburg city in owner-occupied houses/condos
- 159no vehicle
- 9561 vehicle
- 2,2542 vehicles
- 7393 vehicles
- 1944 vehicles
- 2035+ vehicles
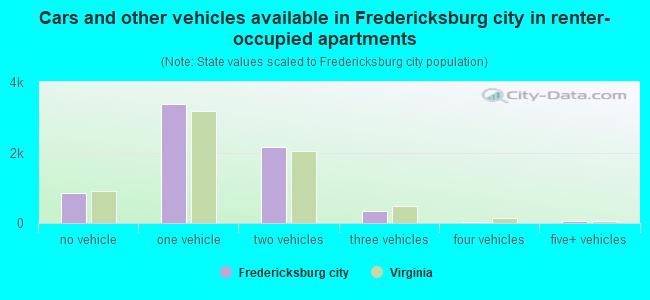
- Cars and other vehicles available in Fredericksburg city in renter-occupied apartments
- 913no vehicle
- 3,7201 vehicle
- 1,9292 vehicles
- 4143 vehicles
- 284 vehicles
- 385+ vehicles
72.8% of Fredericksburg city residents lived in the same house 1 years ago.
Out of people who lived in different houses, 18% lived in this county.
Out of people who lived in different counties, 76% lived in Virginia.
| Fredericksburg city: | 72.8% |
| State average: | 86.6% |
Place of birth for U.S.-born residents:
- This state: 14,154
- Other state: 10,370
- Northeast: 3,139
- Midwest: 1,264
- South: 4,866
- West: 1,097
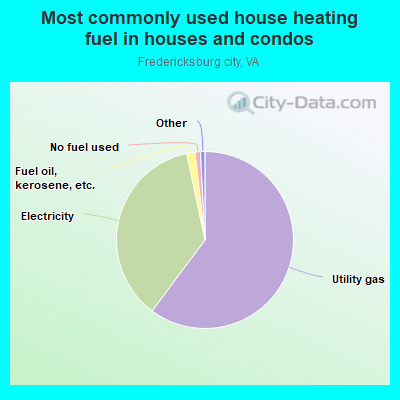
- 62.1%Utility gas
- 34.1%Electricity
- 1.4%Fuel oil, kerosene, etc.
- 0.8%Bottled, tank, or LP gas
- 0.7%No fuel used
- 0.6%Solar energy
- 0.3%Other fuel
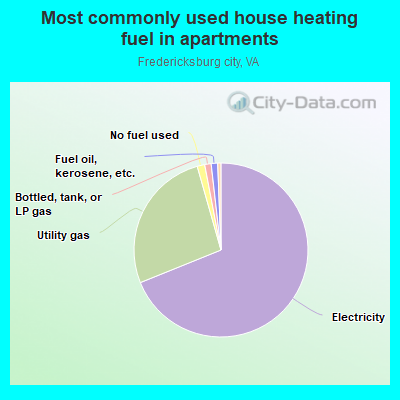
- 70.2%Electricity
- 25.3%Utility gas
- 1.5%Bottled, tank, or LP gas
- 1.5%No fuel used
- 1.3%Fuel oil, kerosene, etc.
- 0.2%Other fuel
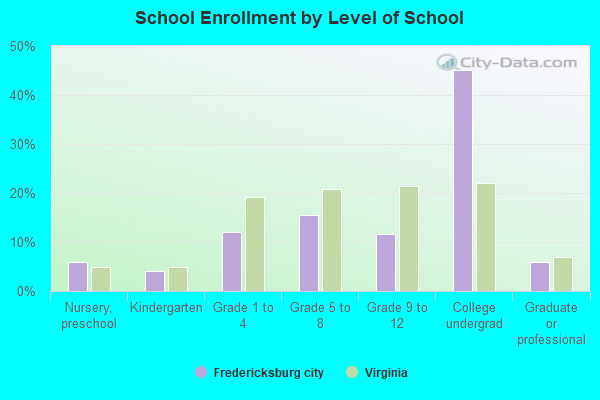
Private vs. public school enrollment:
| Here: | 14.0% |
| Virginia: | 13.2% |
| Here: | 12.8% |
| Virginia: | 10.2% |
| Here: | 6.9% |
| Virginia: | 18.7% |

Supplemental Security Income (SSI) in 2004:
- Total number of recipients: 569
- Number of aged recipients: 55
- Number of blind and disabled recipients: 514
- Number of recipients under 18: 87
- Number of recipients between 18 and 64: 367
- Number of recipients older than 64: 115
- Number of recipients also receiving OASDI: 210
- Amount of payments (thousands of dollars): 236
| Most common first names in Fredericksburg city, VA among deceased individuals | ||
| Name | Count | Lived (average) |
|---|---|---|
| John | 529 | 73.8 years |
| Mary | 499 | 78.7 years |
| James | 499 | 72.6 years |
| William | 487 | 73.8 years |
| Robert | 397 | 71.1 years |
| Charles | 301 | 72.9 years |
| George | 268 | 75.6 years |
| Joseph | 238 | 72.4 years |
| Thomas | 224 | 70.7 years |
| Elizabeth | 216 | 78.7 years |
| Most common last names in Fredericksburg city, VA among deceased individuals | ||
| Last name | Count | Lived (average) |
|---|---|---|
| Smith | 233 | 76.1 years |
| Sullivan | 225 | 75.8 years |
| Jones | 222 | 74.4 years |
| Johnson | 198 | 75.2 years |
| Brown | 180 | 73.9 years |
| Williams | 147 | 74.9 years |
| Shelton | 146 | 76.7 years |
| Newton | 129 | 72.6 years |
| Taylor | 106 | 71.8 years |
| White | 106 | 72.7 years |
| Businesses in Fredericksburg city, VA | ||||
| Name | Count | Name | Count | |
|---|---|---|---|---|
| 7-Eleven | 5 | LensCrafters | 1 | |
| AT&T | 2 | Long John Silver's | 1 | |
| Advance Auto Parts | 1 | Lowe's | 1 | |
| Ann Taylor | 1 | Marriott | 1 | |
| Applebee's | 1 | MasterBrand Cabinets | 10 | |
| Arby's | 1 | McDonald's | 8 | |
| Ashley Furniture | 1 | Men's Wearhouse | 1 | |
| AutoZone | 1 | New Balance | 2 | |
| Barnes & Noble | 1 | Nike | 15 | |
| Baskin-Robbins | 1 | Office Depot | 1 | |
| Best Western | 2 | Old Navy | 1 | |
| Buffalo Wild Wings | 1 | Olive Garden | 1 | |
| Burger King | 1 | Outback | 1 | |
| CVS | 2 | Outback Steakhouse | 1 | |
| Caribou Coffee | 1 | Panda Express | 1 | |
| Catherines | 1 | Papa John's Pizza | 1 | |
| Chick-Fil-A | 1 | PetSmart | 1 | |
| Chico's | 1 | Pier 1 Imports | 1 | |
| Chipotle | 1 | Pizza Hut | 1 | |
| Chuck E. Cheese's | 1 | Plato's Closet | 1 | |
| Cracker Barrel | 1 | Popeyes | 1 | |
| Cricket Wireless | 1 | Qdoba Mexican Grill | 1 | |
| DHL | 1 | Quality | 1 | |
| Decora Cabinetry | 2 | Quiznos | 1 | |
| Domino's Pizza | 1 | RadioShack | 1 | |
| DressBarn | 1 | Rite Aid | 1 | |
| Dressbarn | 1 | Ruby Tuesday | 1 | |
| Dunkin Donuts | 1 | Ryan's Grill | 1 | |
| Ethan Allen | 1 | SAS Shoes | 1 | |
| Famous Footwear | 1 | Sprint Nextel | 1 | |
| FedEx | 12 | Staples | 1 | |
| Firestone Complete Auto Care | 1 | Starbucks | 4 | |
| GNC | 1 | Subway | 1 | |
| GameStop | 2 | Super 8 | 1 | |
| Giant | 1 | T-Mobile | 3 | |
| H&R Block | 2 | T.G.I. Driday's | 1 | |
| Hardee's | 1 | Taco Bell | 1 | |
| Hilton | 2 | Talbots | 1 | |
| Hobby Lobby | 1 | Target | 1 | |
| Home Depot | 1 | The Room Place | 1 | |
| IHOP | 1 | U-Haul | 2 | |
| JoS. A. Bank | 1 | UPS | 14 | |
| Jones New York | 1 | Verizon Wireless | 1 | |
| KFC | 2 | Walmart | 1 | |
| Kohl's | 1 | Wendy's | 1 | |
| Lane Bryant | 1 | |||
Fredericksburg city on our top lists:
- #2 on the list of "Top 101 counties with the highest percentage of residents relocating from other counties between 2010 and 2011"
- #5 on the list of "Top 101 counties with the highest percentage of residents relocating to other counties in 2011"
- #30 on the list of "Top 101 counties with the smallest number of children under 18 without health insurance coverage in 2000"
- #90 on the list of "Top 101 counties with the lowest Particulate Matter (PM10) Annual air pollution readings in 2012 (µg/m3)"