Buckingham County, Virginia (VA)
County owner-occupied free and clear houses and condos in 2010: 1,849
County owner-occupied houses and condos in 2000: 4,148
Renter-occupied apartments: 1,440 (it was 1,176 in 2000)
| % of renters here: | 22% |
| State: | 33% |
Land area: 581 sq. mi.
Water area: 2.7 sq. mi.
Population density: 29 people per square mile (low).
Industries providing employment: Educational, health and social services (19.6%), Construction (14.0%), Retail trade (14.0%), Transportation and warehousing,and utilities (10.7%).
Type of workers:
- Private wage or salary: 75%
- Government: 17%
- Self-employed, not incorporated: 8%
- Unpaid family work: 0%
- OSM Map
- General Map
- Google Map
- MSN Map

- 10,10759.9%White Non-Hispanic Alone
- 5,37831.9%Black Non-Hispanic Alone
- 8405.0%Two or more races
- 4462.6%Hispanic or Latino
- 540.3%Some other race alone
- 330.2%American Indian and Alaska Native alone
- 40.02%Asian alone

| Median resident age: | 43.6 years |
| Virginia median age: | 39.0 years |
| Males: 9,471 | |
| Females: 7,513 |

 | Speeding Ticket-Buckingham County , NC License holder (0 replies) |
| Watch this table daily (34 replies) |
| Some interesting Trivia About Virginia.... (19 replies) |
| Buying farm land (7 replies) |
| Is Charlottesville, VA the place for me? (6 replies) |
| Cell Phone Service in RURAL Virginia? Sprint, Verizon, Other? (9 replies) |
| Buckingham County: | 2.0 people |
| Virginia: | 3 people |
Estimated median household income in 2022: $58,949 ($29,882 in 1999)
| This county: | $58,949 |
| Virginia: | $85,873 |
Median contract rent in 2022 for apartments: $598 (lower quartile is $461, upper quartile is $740)
| This county: | $598 |
| State: | $1270 |
Estimated median house or condo value in 2022: $173,056 (it was $71,200 in 2000)
| Buckingham: | $173,056 |
| Virginia: | $365,700 |
Mean price in 2022:
Median monthly housing costs for homes and condos with a mortgage: $1,156Detached houses: $212,396
Here: $212,396 State: $472,865 Mobile homes: $94,771
Here: $94,771 State: $100,736
Median monthly housing costs for units without a mortgage: $364
Institutionalized population: 2,250
Crime in 2021 (reported by the sheriff's office or county police, not the county total):
- Murders: 1
- Rapes: 6
- Robberies: 3
- Assaults: 10
- Burglaries: 33
- Thefts: 123
- Auto thefts: 32
Crime in 2020 (reported by the sheriff's office or county police, not the county total):
- Murders: 1
- Rapes: 2
- Robberies: 2
- Assaults: 15
- Burglaries: 31
- Thefts: 103
- Auto thefts: 19
Single-family new house construction building permits:
- 2022: 100 buildings, average cost: $197,600
- 2021: 84 buildings, average cost: $178,100
- 2020: 49 buildings, average cost: $157,600
- 2019: 49 buildings, average cost: $178,400
- 2018: 23 buildings, average cost: $167,000
- 2017: 31 buildings, average cost: $162,800
- 2016: 29 buildings, average cost: $144,400
- 2015: 47 buildings, average cost: $160,100
- 2014: 34 buildings, average cost: $132,000
- 2013: 46 buildings, average cost: $184,700
- 2012: 33 buildings, average cost: $150,300
- 2011: 30 buildings, average cost: $112,900
- 2010: 31 buildings, average cost: $112,900
- 2009: 36 buildings, average cost: $150,500
- 2008: 85 buildings, average cost: $121,800
- 2007: 101 buildings, average cost: $128,600
- 2006: 121 buildings, average cost: $130,000
- 2005: 102 buildings, average cost: $133,300
- 2004: 79 buildings, average cost: $128,300
- 2003: 74 buildings, average cost: $89,100
- 2002: 60 buildings, average cost: $107,400
- 2001: 50 buildings, average cost: $82,900
- 2000: 53 buildings, average cost: $99,200
- 1999: 45 buildings, average cost: $82,800
- 1998: 40 buildings, average cost: $75,300
- 1997: 51 buildings, average cost: $81,200


Median real estate property taxes paid for housing units with mortgages in 2022: $898 (0.5%)
Median real estate property taxes paid for housing units with no mortgage in 2022: $790 (0.5%)


| Buckingham County: | 14.8% |
| Virginia: | 10.6% |
Median age of residents in 2022: 43.6 years old
(Males: 41.6 years old, Females: 47.5 years old)
(Median age for: White residents: 45.4 years old, Black residents: 44.3 years old, American Indian residents: 58.4 years old, Asian residents: 40.3 years old, Hispanic or Latino residents: 26.0 years old, Other race residents: 14.6 years old)
Fair market rent in 2006 for a 1-bedroom apartment in Buckingham County is $434 a month.
Fair market rent for a 2-bedroom apartment is $483 a month.
Fair market rent for a 3-bedroom apartment is $621 a month.
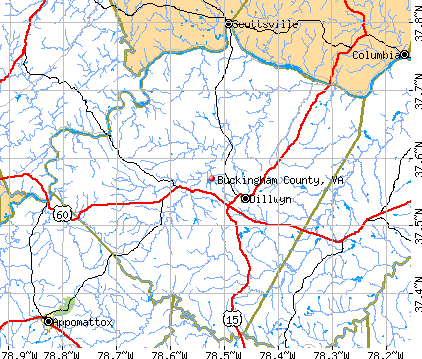
Cities in this county include: Dillwyn, Yogaville, Buckingham Courthouse.
| Here: | 4.3% |
| Virginia: | 2.7% |


Current college students: 336
People 25 years of age or older with a high school degree or higher: 84.1%
People 25 years of age or older with a bachelor's degree or higher: 12.2%
Number of foreign born residents: 253 (42.3% naturalized citizens)
| Buckingham County: | 1.5% |
| Whole state: | 12.7% |

- Year of entry for the foreign-born population
- 702010 or later
- 1482000 to 2009
- 251990 to 1999
- 181980 to 1989
- 121970 to 1979
- 45Before 1970
Mean travel time to work (commute): & minutes
Percentage of county residents living and working in this county: 100.6%
Housing units in structures:
- One, detached: 5,114
- One, attached: 28
- Two: 16
- 3 or 4: 18
- 5 to 9: 29
- 10 to 19: 28
- 20 or more: 4
- Mobile homes: 1,969
- Boats, RVs, vans, etc.: 14
Housing units in Buckingham County with a mortgage: 2,252 (215 second mortgage, 33 home equity loan, 135 both second mortgage and home equity loan)
Houses without a mortgage: 42
| Here: | 4.5% with mortgage |
| State: | 97.2% with mortgage |
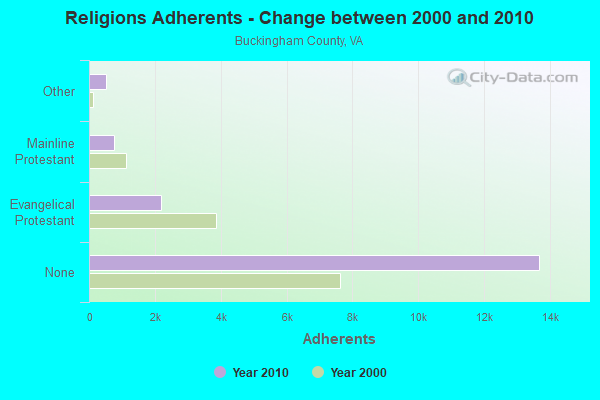
Religion statistics for Buckingham County
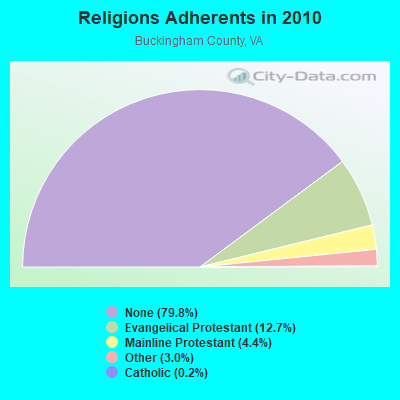
| Religion | Adherents | Congregations |
|---|---|---|
| Evangelical Protestant | 2,175 | 17 |
| Mainline Protestant | 749 | 14 |
| Other | 507 | 3 |
| Catholic | 34 | 1 |
| Black Protestant | - | 1 |
| None | 13,681 | - |
Source: Clifford Grammich, Kirk Hadaway, Richard Houseal, Dale E.Jones, Alexei Krindatch, Richie Stanley and Richard H.Taylor. 2012. 2010 U.S.Religion Census: Religious Congregations & Membership Study. Association of Statisticians of American Religious Bodies. Jones, Dale E., et al. 2002. Congregations and Membership in the United States 2000. Nashville, TN: Glenmary Research Center.
Food Environment Statistics:
| Buckingham County: | 1.25 / 10,000 pop. |
| State: | 2.03 / 10,000 pop. |
| This county: | 1.25 / 10,000 pop. |
| Virginia: | 1.43 / 10,000 pop. |
| Buckingham County: | 6.26 / 10,000 pop. |
| Virginia: | 4.03 / 10,000 pop. |
| This county: | 2.50 / 10,000 pop. |
| State: | 7.65 / 10,000 pop. |
| Buckingham County: | 12.1% |
| Virginia: | 9.3% |
| Buckingham County: | 30.1% |
| State: | 26.7% |
| Here: | 17.7% |
| State: | 18.6% |
Agriculture in Buckingham County:
Average size of farms: 209 acresAverage value of agricultural products sold per farm: $52,066
Average value of crops sold per acre for harvested cropland: $87.61
The value of nursery, greenhouse, floriculture, and sod as a percentage of the total market value of agricultural products sold: 4.02%
The value of livestock, poultry, and their products as a percentage of the total market value of agricultural products sold: 90.64%
Average total farm production expenses per farm: $41,335
Harvested cropland as a percentage of land in farms: 26.66%
Irrigated harvested cropland as a percentage of land in farms: 2.17%
Average market value of all machinery and equipment per farm: $28,861
The percentage of farms operated by a family or individual: 90.49%
Average age of principal farm operators: 58 years
Average number of cattle and calves per 100 acres of all land in farms: 22.17
Corn for grain: 460 harvested acres
All wheat for grain: 271 harvested acres
Vegetables: 24 harvested acres
Land in orchards: 13 acres
Earthquake activity:
Buckingham County-area historical earthquake activity is significantly above Virginia state average. It is 46% smaller than the overall U.S. average.On 8/23/2011 at 17:51:04, a magnitude 5.8 (5.8 MW, Depth: 3.7 mi, Class: Moderate, Intensity: VI - VII) earthquake occurred 39.9 miles away from Buckingham County center
On 12/9/2003 at 20:59:18, a magnitude 4.5 (4.5 ML, Depth: 6.2 mi, Class: Light, Intensity: IV - V) earthquake occurred 27.3 miles away from the county center
On 8/9/2020 at 12:07:37, a magnitude 5.1 (5.1 MW, Depth: 4.7 mi) earthquake occurred 160.7 miles away from the county center
On 12/9/2003 at 20:59:14, a magnitude 4.5 (4.5 MB, 4.5 LG) earthquake occurred 34.1 miles away from the county center
On 8/25/2011 at 05:07:52, a magnitude 4.5 (4.5 ML, Depth: 4.2 mi) earthquake occurred 40.2 miles away from Buckingham County center
On 8/24/2011 at 00:04:36, a magnitude 4.2 (4.2 ML) earthquake occurred 39.3 miles away from the county center
Magnitude types: regional Lg-wave magnitude (LG), body-wave magnitude (MB), local magnitude (ML), moment magnitude (MW)
Most recent natural disasters:
- Virginia Covid-19 Pandemic, Incident Period: January 20, 2020, Major Disaster (Presidential) Declared DR-4512-VA: April 2, 2020, FEMA Id: 4512, Natural disaster type: Other
- Virginia Hurricane Sandy, Incident Period: October 26, 2012 to November 01, 2012, Emergency Declared EM-3359: October 29, 2012, FEMA Id: 3359, Natural disaster type: Hurricane
- Virginia Severe Storms and Straight-line Winds, Incident Period: June 29, 2012 to July 01, 2012, Major Disaster (Presidential) Declared DR-4072: July 27, 2012, FEMA Id: 4072, Natural disaster type: Storm, Wind
- Virginia Severe Winter Storms and Snowstorms, Incident Period: February 05, 2010 to February 11, 2010, Major Disaster (Presidential) Declared DR-1905: April 27, 2010, FEMA Id: 1905, Natural disaster type: Snowstorm, Winter Storm
- Virginia Hurricane Katrina Evacuation, Incident Period: August 29, 2005 to October 01, 2005, Emergency Declared EM-3240: September 12, 2005, FEMA Id: 3240, Natural disaster type: Hurricane
- Virginia Hurricane Isabel, Incident Period: September 18, 2003 to October 01, 2003, Major Disaster (Presidential) Declared DR-1491: September 18, 2003, FEMA Id: 1491, Natural disaster type: Hurricane
- Virginia Winter Storm, Incident Period: January 25, 2000 to January 30, 2000, Major Disaster (Presidential) Declared DR-1318: February 28, 2000, FEMA Id: 1318, Natural disaster type: Winter Storm
- Virginia Hurricane Fran, Incident Period: September 05, 1996 to September 23, 1996, Major Disaster (Presidential) Declared DR-1135: September 06, 1996, FEMA Id: 1135, Natural disaster type: Hurricane
- Virginia Blizzard, Incident Period: January 06, 1996 to January 12, 1996, Major Disaster (Presidential) Declared DR-1086: January 13, 1996, FEMA Id: 1086, Natural disaster type: Blizzard
- Virginia Ice Storm, Winter Storm, Severe Storm, Incident Period: March 01, 1994 to March 05, 1994, Major Disaster (Presidential) Declared DR-1021: April 11, 1994, FEMA Id: 1021, Natural disaster type: Ice Storm, Winter Storm, Storm
- 7 other natural disasters have been reported since 1953.
The number of natural disasters in Buckingham County (17) is near the US average (15).
Major Disasters (Presidential) Declared: 12
Emergencies Declared: 5
Causes of natural disasters: Storms: 5, Hurricanes: 4, Winter Storms: 4, Floods: 3, Droughts: 2, Ice Storms: 2, Blizzard: 1, Snowstorm: 1, Tropical Storm: 1, Wind: 1, Other: 1 (Note: some incidents may be assigned to more than one category).

Means of transportation to work:
- Drove a car alone: 2,589 (79.1%)
- Carpooled: 155 (4.7%)
- Bus: 7 (0.2%)
- Taxicab, motorcycle, or other means: 8 (0.2%)
- Bicycle: 1 (0.0%)
- Walked: 37 (1.1%)
- Worked at home: 439 (13.4%)


- Health care and social assistance (18%)
- Retail trade (13%)
- Educational services (10%)
- Public administration (7%)
- Finance and insurance (5%)
- Professional, scientific, and technical services (4%)
- Other services, except public administration (4%)

- Health care and social assistance (24%)
- Retail trade (17%)
- Educational services (13%)
- Public administration (10%)
- Finance and insurance (6%)
- Professional, scientific, and technical services (6%)
- Other services, except public administration (5%)

- Construction and extraction occupations (18%)
- Transportation occupations (11%)
- Material moving occupations (9%)
- Management occupations (9%)
- Installation, maintenance, and repair occupations (8%)
- Sales and related occupations (6%)
- Production occupations (5%)

- Office and administrative support occupations (23%)
- Management occupations (11%)
- Healthcare support occupations (9%)
- Sales and related occupations (8%)
- Educational instruction, and library occupations (6%)
- Material moving occupations (5%)
- Health diagnosing and treating practitioners and other technical occupations (4%)

- Russia (21%)
- Mexico (18%)
- Honduras (17%)
- Jamaica (8%)
- El Salvador (8%)
- Guatemala (5%)
- Germany (5%)

- English (17%)
- American (14%)
- German (6%)
- Irish (4%)
- Italian (2%)
- European (1%)
- Scottish (1%)


People in group quarters in Buckingham County, Virginia in 2010:
- 2,173 people in state prisons
- 56 people in nursing facilities/skilled-nursing facilities
- 41 people in other noninstitutional facilities
- 28 people in residential treatment centers for adults
- 21 people in residential treatment centers for juveniles (non-correctional)
- 7 people in workers' group living quarters and job corps centers
People in group quarters in Buckingham County, Virginia in 2000:
- 1,992 people in state prisons
- 104 people in homes for abused, dependent, and neglected children
- 67 people in nursing homes
- 31 people in other nonhousehold living situations
- 5 people in other noninstitutional group quarters
8.54% of this county's 2021 resident taxpayers lived in other counties in 2020 ($36,315 average adjusted gross income)
| Here: | 8.54% |
| Virginia average: | 10.16% |
10 or fewer of this county's residents moved from foreign countries.
7.15% relocated from other counties in Virginia ($28,814 average AGI)
1.39% relocated from other states ($7,501 average AGI)
Buckingham County: 1.39% Virginia average: 3.91%

Top counties from which taxpayers relocated into this county between 2020 and 2021:
| from Albemarle County, VA | |
| from Prince Edward County, VA | |
| from Cumberland County, VA | |
| from Fluvanna County, VA |
5.41% of this county's 2020 resident taxpayers moved to other counties in 2021 ($43,983 average adjusted gross income)
| Here: | 5.41% |
| Virginia average: | 10.20% |
10 or fewer of this county's residents moved to foreign countries.
4.74% relocated to other counties in Virginia ($38,303 average AGI)
0.67% relocated to other states ($5,679 average AGI)
Buckingham County: 0.67% Virginia average: 3.98%

Top counties to which taxpayers relocated from this county between 2020 and 2021:
| to Albemarle County, VA | |
| to Cumberland County, VA | |
| to Prince Edward County, VA |
Births per 1000 population from 1990 to 1999: 10.9
Births per 1000 population from 2000 to 2006: 9.0

Deaths per 1000 population from 1990 to 1999: 9.8
Deaths per 1000 population from 2000 to 2009: 10.3
Deaths per 1000 population from 2010 to 2020: 9.6

Infant deaths per 1000 live births from 1990 to 1999: 7.6
Infant deaths per 1000 live births from 2000 to 2006: 13.4

Persons under 19 years old without health insurance coverage in 2018: 7.1%


Persons enrolled in hospital insurance and/or supplemental medical insurance (Medicare) in July 1, 2007: 2,490 (1,952 aged, 538 disabled)
Children under 18 without health insurance coverage in 2007: 366 (12%)


Most common underlying causes of death in Buckingham County, Virginia in 1999 - 2019:
- Bronchus or lung, unspecified - Malignant neoplasms (220)
- Atherosclerotic heart disease (131)
- Acute myocardial infarction, unspecified (71)
- Other forms of acute ischaemic heart disease (60)
- Unspecified dementia (43)
- Chronic obstructive pulmonary disease, unspecified (32)
- Stroke, not specified as haemorrhage or infarction (12)
- Congestive heart failure (11)
Population without health insurance coverage in 2000: 12%
Children under 18 without health insurance coverage in 2000: 8%
Medical specialist MDs per 100,000 population in 2005: 1,333
Dentists per 100,000 population in 1998: 6
Total births per 100,000 population, July 2005 - July 2006 : 20
Total deaths per 100,000 population, July 2005 - July 2006: 6
Limited-service eating places per 100,000 population in 2005 : 6
Crimes per 100,000 population in 1996: 1
Household type by relationship:
Households: 16,984- Male householders: 2,842 (758 living alone), Female householders: 3,221 (961 living alone)
3,028 spouses (2,983 opposite-sex spouses), 352 unmarried partners, (324 opposite-sex unmarried partners), 4,303 children (3,988 natural, 50 adopted, 267 stepchildren), 383 grandchildren, 207 brothers or sisters, 120 parents, 5 foster children, 284 other relatives, 227 non-relatives
- In group quarters: 2,004
Size of family households: 1,926 2-persons, 909 3-persons, 616 4-persons, 391 5-persons, 102 6-persons, 112 7-or-more-persons.
Size of nonfamily households: 1,719 1-person, 219 2-persons, 39 3-persons, 19 4-persons.
1,727 married couples with children.
763 single-parent households (264 men, 499 women).
96.2% of residents of Buckingham speak English at home.
1.8% of residents speak Spanish at home (53% speak English very well, 26% speak English well, 13% speak English not well, 8% don't speak English at all).
1.7% of residents speak other Indo-European language at home (70% speak English very well, 30% speak English well).
0.1% of residents speak other language at home (100% speak English very well).
In fiscal year 2004:
Federal Government expenditure: $71,307,000 ($4,479 per capita)
Department of Defense expenditure: $2,717,000
Federal direct payments to individuals for retirement and disability: $30,727,000
Federal other direct payments to individuals: $15,736,000
Federal direct payments not to individuals: $284,000
Federal grants: $21,352,000
Federal procurement contracts: $1,581,000 ($1,216,000 Department of Defense)
Federal salaries and wages: $1,627,000 ($0,000 Department of Defense)
Federal Government direct loans: $574,000
Federal guaranteed/insured loans: $5,843,000
Federal Government insurance: $761,000
Population change from April 1, 2000 to July 1, 2005:
Births: 768| Here: | 48 per 1000 residents |
| State: | 70 per 1000 residents |
Deaths: 863
| Here: | 54 per 1000 residents |
| State: | 40 per 1000 residents |
Net international migration: +29
| Here: | +2 per 1000 residents |
| State: | +18 per 1000 residents |
Net internal migration: +526
| Here: | +33 per 1000 residents |
| State: | +14 per 1000 residents |

Total withdrawal of fresh water for public supply: 0.40 millions of gallons per day (all from surface)
| Here: | 6.1 |
| State: | 7.0 |
| Here: | 5.0 |
| State: | 4.3 |

- Year house built in Buckingham County, Virginia
- 322020 or later
- 7402010 to 2019
- 1,7172000 to 2009
- 1,3551990 to 1999
- 9251980 to 1989
- 9161970 to 1979
- 3851960 to 1969
- 3621950 to 1959
- 1401940 to 1949
- 6891939 or earlier

- Rooms in owner-occupied houses in Buckingham County, Virginia
- 01 room
- 122 rooms
- 1473 rooms
- 3754 rooms
- 1,0775 rooms
- 1,2256 rooms
- 6767 rooms
- 6358 rooms
- 4439+ rooms

- Rooms in renter-occupied apartments in Buckingham County, Virginia
- 641 room
- 282 rooms
- 1403 rooms
- 1884 rooms
- 5125 rooms
- 3046 rooms
- 1037 rooms
- 408 rooms
- 579+ rooms

- Bedrooms in owner-occupied houses in Buckingham County, Virginia
- 0no bedroom
- 1521 bedroom
- 7552 bedrooms
- 2,6673 bedrooms
- 9444 bedrooms
- 745+ bedrooms

- Bedrooms in renter-occupied apartments in Buckingham County, Virginia
- 84no bedroom
- 821 bedroom
- 4852 bedrooms
- 7313 bedrooms
- 634 bedrooms
- 65+ bedrooms

- Cars and other vehicles available in Buckingham County in owner-occupied houses/condos
- 238no vehicle
- 1,0551 vehicle
- 1,1202 vehicles
- 1,1973 vehicles
- 4994 vehicles
- 4955+ vehicles

- Cars and other vehicles available in Buckingham County in renter-occupied apartments
- 158no vehicle
- 4401 vehicle
- 4712 vehicles
- 2203 vehicles
- 1124 vehicles
- 435+ vehicles
92.6% of Buckingham County residents lived in the same house 1 years ago.
Out of people who lived in different houses, 22% lived in this county.
Out of people who lived in different counties, 95% lived in Virginia.
| Buckingham County: | 92.6% |
| State average: | 86.6% |
Place of birth for U.S.-born residents:
- This state: 12,888
- Other state: 3,562
- Northeast: 1,357
- Midwest: 380
- South: 1,347
- West: 484


- 68.6%Electricity
- 15.8%Bottled, tank, or LP gas
- 9.8%Wood
- 4.3%Fuel oil, kerosene, etc.
- 0.9%Utility gas
- 0.3%No fuel used
- 0.3%Solar energy

- 80.4%Electricity
- 7.0%Wood
- 6.8%Bottled, tank, or LP gas
- 3.8%Fuel oil, kerosene, etc.
- 0.9%Utility gas
- 0.6%Solar energy
- 0.6%No fuel used
Private vs. public school enrollment:
| Here: | 14.9% |
| Virginia: | 13.2% |
| Here: | 6.1% |
| Virginia: | 10.2% |
| Here: | 7.1% |
| Virginia: | 18.7% |


Buckingham County government finances - Expenditure in 2017:
- Bond Funds - Cash and Securities: $105,000
- Charges - Sewerage: $268,000
Elementary and Secondary Education School Lunch: $194,000
Other: $55,000
Parks and Recreation: $28,000
Solid Waste Management: $15,000
Elementary and Secondary Education School Tuition and Transportation: $6,000
Elementary and Secondary Education - Other: $4,000
- Construction - Sewerage: $2,031,000
Regular Highways: $243,000
Water Utilities: $197,000
- Current Operations - Elementary and Secondary Education: $22,714,000
Police Protection: $2,135,000
Solid Waste Management: $948,000
Central Staff Services: $840,000
Financial Administration: $760,000
Water Utilities: $698,000
General Public Buildings: $641,000
Health - Other: $635,000
General - Other: $633,000
Judicial and Legal Services: $478,000
Correctional Institutions: $405,000
Local Fire Protection: $277,000
Sewerage: $243,000
Parks and Recreation: $210,000
Libraries: $163,000
Protective Inspection and Regulation - Other: $127,000
Natural Resources - Other: $101,000
- Federal Intergovernmental - Sewerage: $2,024,000
Other: $559,000
Highways: $206,000
Education: $51,000
- General - Interest on Debt: $1,569,000
- Local Intergovernmental - Education: $39,000
- Long Term Debt - Beginning Outstanding - Unspecified Public Purpose: $47,548,000
Outstanding Unspecified Public Purpose: $45,589,000
Retired Unspecified Public Purpose: $1,959,000
Beginning Outstanding - Public Debt for Private Purpose: $1,453,000
Outstanding Nonguaranteed - Industrial Revenue: $1,401,000
Retired Nonguaranteed - Public Debt for Private Purpose: $52,000
- Miscellaneous - General Revenue - Other: $280,000
Rents: $80,000
Fines and Forfeits: $34,000
Interest Earnings: $18,000
Sale of Property: $16,000
- Other Capital Outlay - Elementary and Secondary Education: $542,000
- Other Funds - Cash and Securities: $12,414,000
- Revenue - Water Utilities: $1,340,000
- Sinking Funds - Cash and Securities: $1,914,000
- State Intergovernmental - Education: $16,003,000
Other: $1,747,000
General Local Government Support: $1,611,000
- Tax - Property: $15,139,000
General Sales and Gross Receipts: $735,000
Public Utilities Sales: $379,000
Motor Vehicle License: $338,000
Documentary and Stock Transfer: $115,000
Other License: $81,000
- Total Salaries and Wages: $12,741,000
- Water Utilities - Interest on Debt: $161,000
Buckingham County government finances - Revenue in 2017:
- Bond Funds - Cash and Securities: $105,000
- Charges - Sewerage: $268,000
Elementary and Secondary Education School Lunch: $194,000
Other: $55,000
Parks and Recreation: $28,000
Solid Waste Management: $15,000
Elementary and Secondary Education School Tuition and Transportation: $6,000
Elementary and Secondary Education - Other: $4,000
- Construction - Sewerage: $2,031,000
Regular Highways: $243,000
Water Utilities: $197,000
- Current Operations - Elementary and Secondary Education: $22,714,000
Police Protection: $2,135,000
Solid Waste Management: $948,000
Central Staff Services: $840,000
Financial Administration: $760,000
Water Utilities: $698,000
General Public Buildings: $641,000
Health - Other: $635,000
General - Other: $633,000
Judicial and Legal Services: $478,000
Correctional Institutions: $405,000
Local Fire Protection: $277,000
Sewerage: $243,000
Parks and Recreation: $210,000
Libraries: $163,000
Protective Inspection and Regulation - Other: $127,000
Natural Resources - Other: $101,000
- Federal Intergovernmental - Sewerage: $2,024,000
Other: $559,000
Highways: $206,000
Education: $51,000
- General - Interest on Debt: $1,569,000
- Local Intergovernmental - Education: $39,000
- Long Term Debt - Beginning Outstanding - Unspecified Public Purpose: $47,548,000
Outstanding Unspecified Public Purpose: $45,589,000
Retired Unspecified Public Purpose: $1,959,000
Beginning Outstanding - Public Debt for Private Purpose: $1,453,000
Outstanding Nonguaranteed - Industrial Revenue: $1,401,000
Retired Nonguaranteed - Public Debt for Private Purpose: $52,000
- Miscellaneous - General Revenue - Other: $280,000
Rents: $80,000
Fines and Forfeits: $34,000
Interest Earnings: $18,000
Sale of Property: $16,000
- Other Capital Outlay - Elementary and Secondary Education: $542,000
- Other Funds - Cash and Securities: $12,414,000
- Revenue - Water Utilities: $1,340,000
- Sinking Funds - Cash and Securities: $1,914,000
- State Intergovernmental - Education: $16,003,000
Other: $1,747,000
General Local Government Support: $1,611,000
- Tax - Property: $15,139,000
General Sales and Gross Receipts: $735,000
Public Utilities Sales: $379,000
Motor Vehicle License: $338,000
Documentary and Stock Transfer: $115,000
Other License: $81,000
- Total Salaries and Wages: $12,741,000
- Water Utilities - Interest on Debt: $161,000
Buckingham County government finances - Debt in 2017:
- Bond Funds - Cash and Securities: $105,000
- Charges - Sewerage: $268,000
Elementary and Secondary Education School Lunch: $194,000
Other: $55,000
Parks and Recreation: $28,000
Solid Waste Management: $15,000
Elementary and Secondary Education School Tuition and Transportation: $6,000
Elementary and Secondary Education - Other: $4,000
- Construction - Sewerage: $2,031,000
Regular Highways: $243,000
Water Utilities: $197,000
- Current Operations - Elementary and Secondary Education: $22,714,000
Police Protection: $2,135,000
Solid Waste Management: $948,000
Central Staff Services: $840,000
Financial Administration: $760,000
Water Utilities: $698,000
General Public Buildings: $641,000
Health - Other: $635,000
General - Other: $633,000
Judicial and Legal Services: $478,000
Correctional Institutions: $405,000
Local Fire Protection: $277,000
Sewerage: $243,000
Parks and Recreation: $210,000
Libraries: $163,000
Protective Inspection and Regulation - Other: $127,000
Natural Resources - Other: $101,000
- Federal Intergovernmental - Sewerage: $2,024,000
Other: $559,000
Highways: $206,000
Education: $51,000
- General - Interest on Debt: $1,569,000
- Local Intergovernmental - Education: $39,000
- Long Term Debt - Beginning Outstanding - Unspecified Public Purpose: $47,548,000
Outstanding Unspecified Public Purpose: $45,589,000
Retired Unspecified Public Purpose: $1,959,000
Beginning Outstanding - Public Debt for Private Purpose: $1,453,000
Outstanding Nonguaranteed - Industrial Revenue: $1,401,000
Retired Nonguaranteed - Public Debt for Private Purpose: $52,000
- Miscellaneous - General Revenue - Other: $280,000
Rents: $80,000
Fines and Forfeits: $34,000
Interest Earnings: $18,000
Sale of Property: $16,000
- Other Capital Outlay - Elementary and Secondary Education: $542,000
- Other Funds - Cash and Securities: $12,414,000
- Revenue - Water Utilities: $1,340,000
- Sinking Funds - Cash and Securities: $1,914,000
- State Intergovernmental - Education: $16,003,000
Other: $1,747,000
General Local Government Support: $1,611,000
- Tax - Property: $15,139,000
General Sales and Gross Receipts: $735,000
Public Utilities Sales: $379,000
Motor Vehicle License: $338,000
Documentary and Stock Transfer: $115,000
Other License: $81,000
- Total Salaries and Wages: $12,741,000
- Water Utilities - Interest on Debt: $161,000
Buckingham County government finances - Cash and Securities in 2017:
- Bond Funds - Cash and Securities: $105,000
- Charges - Sewerage: $268,000
Elementary and Secondary Education School Lunch: $194,000
Other: $55,000
Parks and Recreation: $28,000
Solid Waste Management: $15,000
Elementary and Secondary Education School Tuition and Transportation: $6,000
Elementary and Secondary Education - Other: $4,000
- Construction - Sewerage: $2,031,000
Regular Highways: $243,000
Water Utilities: $197,000
- Current Operations - Elementary and Secondary Education: $22,714,000
Police Protection: $2,135,000
Solid Waste Management: $948,000
Central Staff Services: $840,000
Financial Administration: $760,000
Water Utilities: $698,000
General Public Buildings: $641,000
Health - Other: $635,000
General - Other: $633,000
Judicial and Legal Services: $478,000
Correctional Institutions: $405,000
Local Fire Protection: $277,000
Sewerage: $243,000
Parks and Recreation: $210,000
Libraries: $163,000
Protective Inspection and Regulation - Other: $127,000
Natural Resources - Other: $101,000
- Federal Intergovernmental - Sewerage: $2,024,000
Other: $559,000
Highways: $206,000
Education: $51,000
- General - Interest on Debt: $1,569,000
- Local Intergovernmental - Education: $39,000
- Long Term Debt - Beginning Outstanding - Unspecified Public Purpose: $47,548,000
Outstanding Unspecified Public Purpose: $45,589,000
Retired Unspecified Public Purpose: $1,959,000
Beginning Outstanding - Public Debt for Private Purpose: $1,453,000
Outstanding Nonguaranteed - Industrial Revenue: $1,401,000
Retired Nonguaranteed - Public Debt for Private Purpose: $52,000
- Miscellaneous - General Revenue - Other: $280,000
Rents: $80,000
Fines and Forfeits: $34,000
Interest Earnings: $18,000
Sale of Property: $16,000
- Other Capital Outlay - Elementary and Secondary Education: $542,000
- Other Funds - Cash and Securities: $12,414,000
- Revenue - Water Utilities: $1,340,000
- Sinking Funds - Cash and Securities: $1,914,000
- State Intergovernmental - Education: $16,003,000
Other: $1,747,000
General Local Government Support: $1,611,000
- Tax - Property: $15,139,000
General Sales and Gross Receipts: $735,000
Public Utilities Sales: $379,000
Motor Vehicle License: $338,000
Documentary and Stock Transfer: $115,000
Other License: $81,000
- Total Salaries and Wages: $12,741,000
- Water Utilities - Interest on Debt: $161,000
Supplemental Security Income (SSI) in 2006:
- Total number of recipients: 485
- Number of aged recipients: 97
- Number of blind and disabled recipients: 388
- Number of recipients under 18: 56
- Number of recipients between 18 and 64: 279
- Number of recipients older than 64: 150
- Number of recipients also receiving OASDI: 245
- Amount of payments (thousands of dollars): 183
| Most common first names in Buckingham County, VA among deceased individuals | ||
| Name | Count | Lived (average) |
|---|---|---|
| John | 74 | 75.4 years |
| James | 59 | 69.5 years |
| Mary | 58 | 79.3 years |
| William | 47 | 77.5 years |
| Robert | 35 | 74.8 years |
| George | 29 | 71.1 years |
| Willie | 25 | 74.5 years |
| Annie | 24 | 83.2 years |
| Thomas | 21 | 76.2 years |
| Margaret | 20 | 80.9 years |
| Most common last names in Buckingham County, VA among deceased individuals | ||
| Last name | Count | Lived (average) |
|---|---|---|
| Jamerson | 44 | 73.6 years |
| Jones | 41 | 71.8 years |
| Taylor | 40 | 74.2 years |
| Booker | 35 | 69.5 years |
| Anderson | 32 | 73.6 years |
| Brown | 30 | 79.1 years |
| Shumaker | 29 | 73.8 years |
| Allen | 25 | 76.4 years |
| Maxey | 23 | 78.9 years |
| Harris | 23 | 76.4 years |
| Businesses in Buckingham County, VA | ||||
| Name | Count | Name | Count | |
|---|---|---|---|---|
| Advance Auto Parts | 1 | McDonald's | 1 | |
| Curves | 1 | Subway | 1 | |
| Ford | 1 | U-Haul | 1 | |
| H&R Block | 1 | |||