Barnwell County, South Carolina (SC)
County owner-occupied free and clear houses and condos in 2010: 3,164
County owner-occupied houses and condos in 2000: 6,811
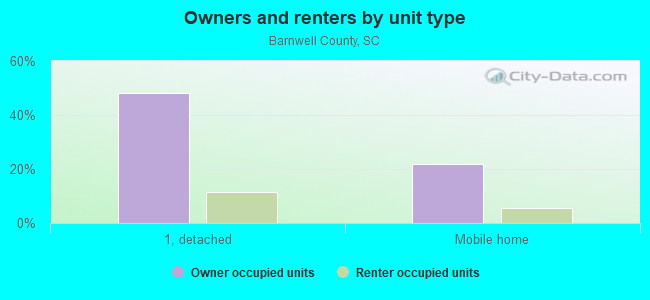
Renter-occupied apartments: 2,657 (it was 2,210 in 2000)
| % of renters here: | 24% |
| State: | 31% |
Land area: 548 sq. mi.
Water area: 8.8 sq. mi.
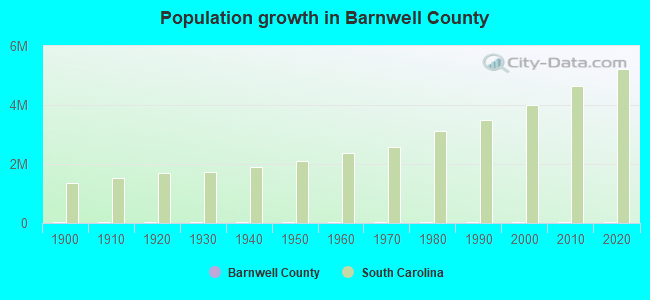
Population density: 39 people per square mile (low).
Industries providing employment: Educational, health and social services (21.5%), Manufacturing (17.5%), Arts, entertainment, recreation, accommodation and food services (10.6%).
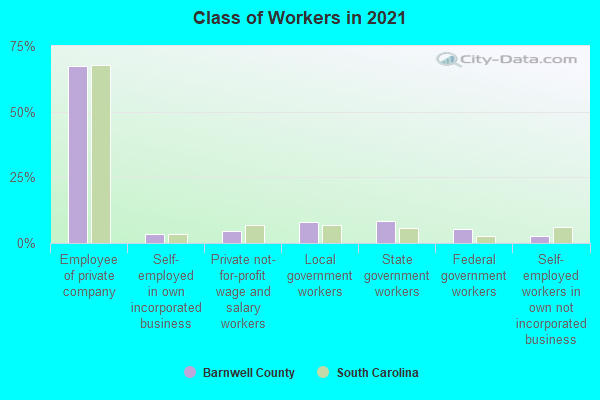
Type of workers:
- Private wage or salary: 77%
- Government: 20%
- Self-employed, not incorporated: 3%
- Unpaid family work: 0%
- OSM Map
- General Map
- Google Map
- MSN Map

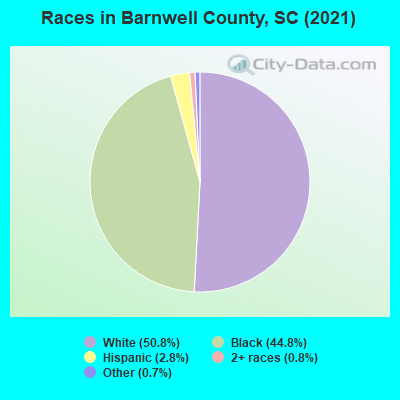
- 10,47149.6%White Non-Hispanic Alone
- 9,06843.0%Black Non-Hispanic Alone
- 6253.0%Hispanic or Latino
- 5262.5%Two or more races
- 3291.6%Some other race alone
- 580.3%Asian alone
- 240.1%American Indian and Alaska Native alone
| Median resident age: | 41.4 years |
| South Carolina median age: | 40.5 years |
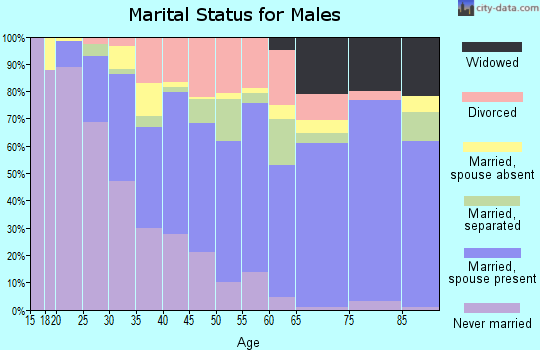
| Males: 10,527 | |
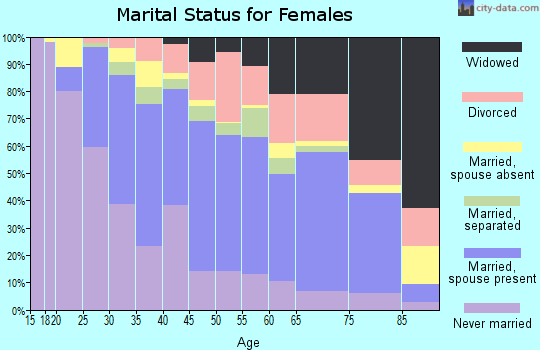
| Females: 10,687 |

 | Most Rural Locations? (19 replies) |
| Charleston roots and family trees (25 replies) |
| How far back does your Charleston genealogy go? (12 replies) |
| SC ranked 7th in highway performance and efficiency (100 replies) |
| building house in Aiken, SC (5 replies) |
| 100 jobs coming to Barnwell (1 reply) |
| Barnwell County: | 2.0 people |
| South Carolina: | 2 people |
Estimated median household income in 2022: $42,798 ($28,591 in 1999)
| This county: | $42,798 |
| South Carolina: | $64,115 |
Median contract rent in 2022 for apartments: $534 (lower quartile is $303, upper quartile is $678)
| This county: | $534 |
| State: | $893 |
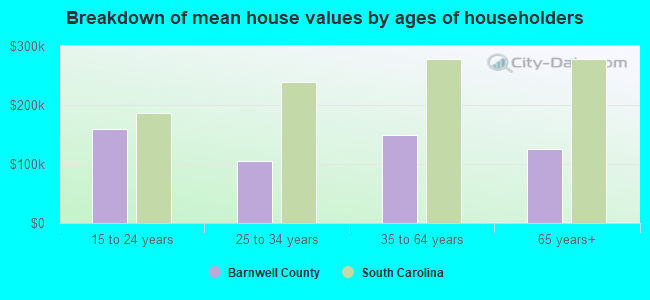
Estimated median house or condo value in 2022: $114,346 (it was $51,500 in 2000)
| Barnwell: | $114,346 |
| South Carolina: | $254,600 |
Median monthly housing costs for homes and condos with a mortgage: $1,180
Median monthly housing costs for units without a mortgage: $393
Institutionalized population: 246
Crime in 2021 (reported by the sheriff's office or county police, not the county total):
- Murders: 3
- Rapes: 8
- Robberies: 4
- Assaults: 69
- Burglaries: 69
- Thefts: 139
- Auto thefts: 43
Crime in 2020 (reported by the sheriff's office or county police, not the county total):
- Murders: 4
- Rapes: 1
- Robberies: 1
- Assaults: 109
- Burglaries: 69
- Thefts: 146
- Auto thefts: 31
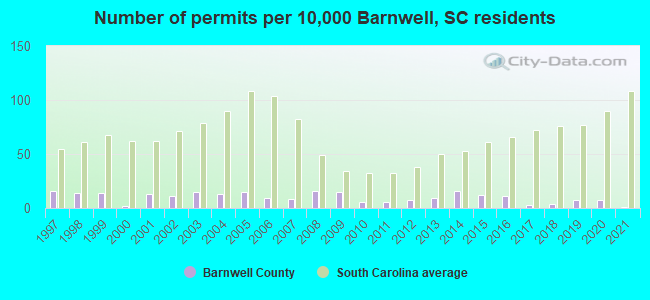
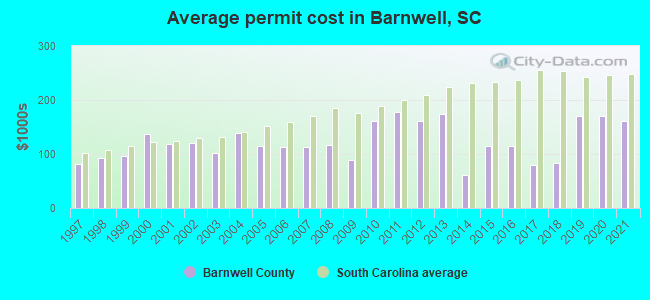
Single-family new house construction building permits:
- 2022: 31 buildings, average cost: $170,800
- 2021: 2 buildings, average cost: $162,000
- 2020: 17 buildings, average cost: $170,700
- 2019: 16 buildings, average cost: $170,400
- 2018: 10 buildings, average cost: $82,600
- 2017: 8 buildings, average cost: $79,400
- 2016: 26 buildings, average cost: $113,600
- 2015: 27 buildings, average cost: $114,600
- 2014: 37 buildings, average cost: $62,200
- 2013: 20 buildings, average cost: $173,700
- 2012: 17 buildings, average cost: $161,500
- 2011: 15 buildings, average cost: $177,400
- 2010: 15 buildings, average cost: $162,200
- 2009: 36 buildings, average cost: $88,900
- 2008: 37 buildings, average cost: $116,800
- 2007: 18 buildings, average cost: $112,500
- 2006: 22 buildings, average cost: $112,500
- 2005: 36 buildings, average cost: $115,000
- 2004: 31 buildings, average cost: $139,000
- 2003: 35 buildings, average cost: $102,100
- 2002: 25 buildings, average cost: $121,100
- 2001: 30 buildings, average cost: $117,700
- 2000: 4 buildings, average cost: $136,500
- 1999: 34 buildings, average cost: $96,900
- 1998: 33 buildings, average cost: $93,300
- 1997: 37 buildings, average cost: $81,000
Median real estate property taxes paid for housing units with mortgages in 2022: $1,100 (0.7%)
Median real estate property taxes paid for housing units with no mortgage in 2022: $516 (0.6%)


| Barnwell County: | 24.6% |
| South Carolina: | 14.0% |
Median age of residents in 2022: 41.4 years old
(Males: 37.9 years old, Females: 43.7 years old)
(Median age for: White residents: 46.5 years old, Black residents: 39.3 years old, Hispanic or Latino residents: 23.7 years old, Other race residents: 26.1 years old)
Fair market rent in 2006 for a 1-bedroom apartment in Barnwell County is $419 a month.
Fair market rent for a 2-bedroom apartment is $481 a month.
Fair market rent for a 3-bedroom apartment is $579 a month.
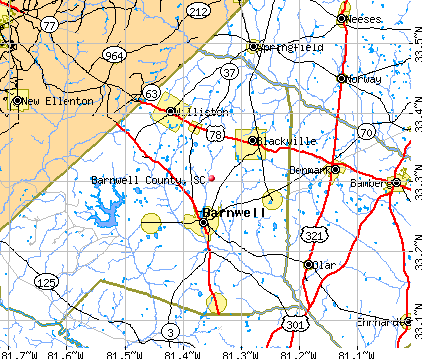
Cities in this county include: Barnwell, Williston, Blackville, Hilda, Snelling, Kline, Elko.
Neighboring counties: Baldwin County, Georgia  , Greenlee County, Arizona , Los Angeles County, California , Ouachita County, Arkansas , Washington County, Mississippi , Monroe County, Georgia .
| Here: | 5.3% |
| South Carolina: | 3.1% |

Current college students: 669
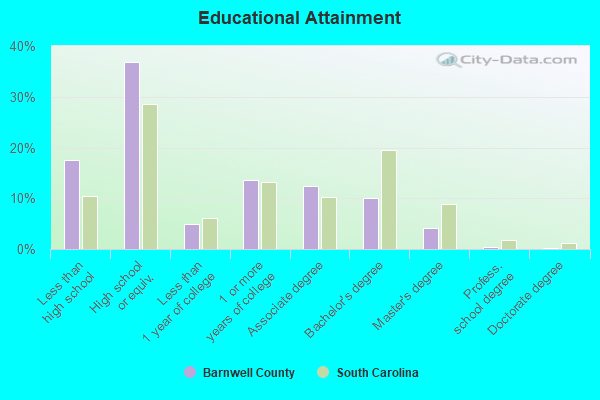
People 25 years of age or older with a high school degree or higher: 82.8%
People 25 years of age or older with a bachelor's degree or higher: 14.3%
Number of foreign born residents: 527 (33.9% naturalized citizens)
| Barnwell County: | 2.5% |
| Whole state: | 5.2% |
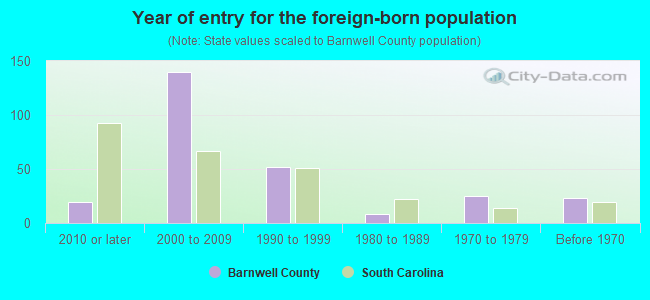
- Year of entry for the foreign-born population
- 2512010 or later
- 1872000 to 2009
- 321990 to 1999
- 81980 to 1989
- 251970 to 1979
- 23Before 1970
Mean travel time to work (commute): minutes
Percentage of county residents living and working in this county: 97.8%
Housing units in structures:
- One, detached: 6,264
- One, attached: 70
- Two: 136
- 3 or 4: 493
- 5 to 9: 221
- 10 to 19: 32
- 20 to 49: 63
- 50 or more: 80
- Mobile homes: 2,787
- Boats, RVs, vans, etc.: 18
Housing units in Barnwell County with a mortgage: 2,697 (172 second mortgage, 17 home equity loan, 117 both second mortgage and home equity loan)
Houses without a mortgage: 52
| Here: | 3.7% with mortgage |
| State: | 97.3% with mortgage |
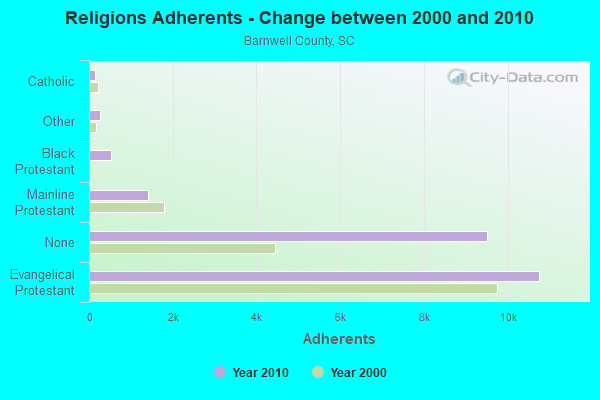
Religion statistics for Barnwell County
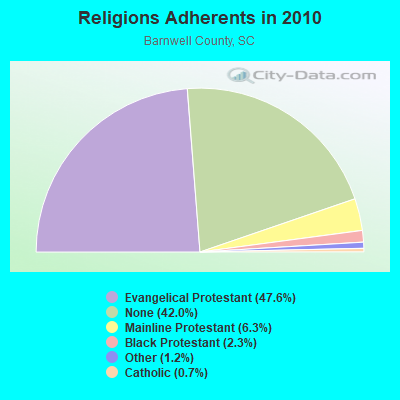
| Religion | Adherents | Congregations |
|---|---|---|
| Evangelical Protestant | 10,760 | 47 |
| Mainline Protestant | 1,419 | 9 |
| Black Protestant | 518 | 4 |
| Other | 269 | 3 |
| Catholic | 150 | 2 |
| None | 9,505 | - |
Source: Clifford Grammich, Kirk Hadaway, Richard Houseal, Dale E.Jones, Alexei Krindatch, Richie Stanley and Richard H.Taylor. 2012. 2010 U.S.Religion Census: Religious Congregations & Membership Study. Association of Statisticians of American Religious Bodies. Jones, Dale E., et al. 2002. Congregations and Membership in the United States 2000. Nashville, TN: Glenmary Research Center.
Food Environment Statistics:
| Barnwell County: | 2.18 / 10,000 pop. |
| State: | 1.99 / 10,000 pop. |
| Here: | 0.44 / 10,000 pop. |
| South Carolina: | 0.15 / 10,000 pop. |
| This county: | 0.87 / 10,000 pop. |
| South Carolina: | 0.85 / 10,000 pop. |
| Barnwell County: | 6.53 / 10,000 pop. |
| South Carolina: | 5.38 / 10,000 pop. |
| This county: | 5.66 / 10,000 pop. |
| State: | 7.75 / 10,000 pop. |
| Barnwell County: | 13.9% |
| South Carolina: | 10.6% |
| Barnwell County: | 35.6% |
| State: | 29.4% |
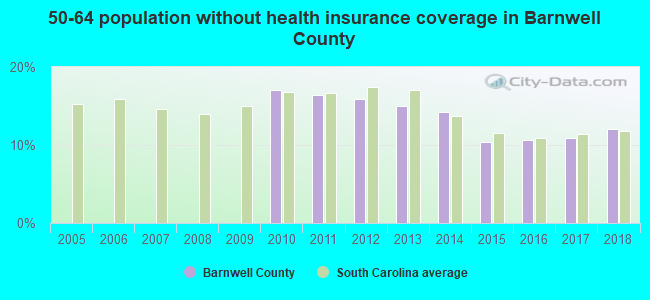
| Here: | 16.6% |
| State: | 13.4% |
Agriculture in Barnwell County:
Average size of farms: 230 acresAverage value of agricultural products sold per farm: $19,102
Average value of crops sold per acre for harvested cropland: $247.12
The value of nursery, greenhouse, floriculture, and sod as a percentage of the total market value of agricultural products sold: 12.43%
The value of livestock, poultry, and their products as a percentage of the total market value of agricultural products sold: 33.59%
Average total farm production expenses per farm: $31,230
Harvested cropland as a percentage of land in farms: 22.32%
Irrigated harvested cropland as a percentage of land in farms: 6.46%
Average market value of all machinery and equipment per farm: $63,207
The percentage of farms operated by a family or individual: 92.97%
Average age of principal farm operators: 56 years
Average number of cattle and calves per 100 acres of all land in farms: 4.92
Milk cows as a percentage of all cattle and calves: 0.10%
Corn for grain: 4312 harvested acres
All wheat for grain: 1144 harvested acres
Upland cotton: 4467 harvested acres
Soybeans for beans: 2697 harvested acres
Vegetables: 874 harvested acres
Land in orchards: 314 acres
Earthquake activity:
Barnwell County-area historical earthquake activity is significantly above South Carolina state average. It is 29% smaller than the overall U.S. average.On 8/2/1974 at 08:52:09, a magnitude 4.9 (4.3 MB, 4.9 LG, Class: Light, Intensity: IV - V) earthquake occurred 76.3 miles away from Barnwell County center
On 11/22/1974 at 05:25:55, a magnitude 4.7 (4.7 MB) earthquake occurred 75.3 miles away from the county center
On 8/21/1992 at 16:31:55, a magnitude 4.4 (4.1 MB, 4.1 LG, 4.4 LG, Depth: 6.2 mi) earthquake occurred 73.7 miles away from the county center
On 8/9/2020 at 12:07:37, a magnitude 5.1 (5.1 MW, Depth: 4.7 mi, Class: Moderate, Intensity: VI - VII) earthquake occurred 219.9 miles away from the county center
On 8/23/2011 at 17:51:04, a magnitude 5.8 (5.8 MW, Depth: 3.7 mi) earthquake occurred 371.9 miles away from Barnwell County center
On 2/15/2014 at 03:23:38, a magnitude 4.1 (4.1 MW, Depth: 3.2 mi) earthquake occurred 55.5 miles away from the county center
Magnitude types: regional Lg-wave magnitude (LG), body-wave magnitude (MB), moment magnitude (MW)
Most recent natural disasters:
- South Carolina Severe Storms, Tornadoes, And Straight-line Winds, Incident Period: April 12, 2020 - April 13, 2020, FEMA Id: 4542, Natural disaster type: Storm, Tornado, Wind
- South Carolina Covid-19 Pandemic, Incident Period: January 20, 2020, FEMA Id: 4492, Natural disaster type: Other
- South Carolina Hurricane Irma, Incident Period: September 6, 2017 - September 13, 2017, FEMA Id: 4346, Natural disaster type: Hurricane
- South Carolina Hurricane Matthew, Incident Period: October 04, 2016 to October 30, 2016, Emergency Declared EM-3378: October 06, 2016, FEMA Id: 3378, Natural disaster type: Hurricane
- South Carolina Hurricane Matthew, Incident Period: October 04, 2016 to October 30, 2016, Major Disaster (Presidential) Declared DR-4286: October 11, 2016, FEMA Id: 4286, Natural disaster type: Hurricane
- South Carolina Severe Storms and Flooding, Incident Period: October 01, 2015 to October 23, 2015, Emergency Declared EM-3373: October 03, 2015, FEMA Id: 3373, Natural disaster type: Storm, Flood
- South Carolina Severe Winter Storm, Incident Period: February 10, 2014 to February 19, 2014, Emergency Declared EM-3369: February 12, 2014, FEMA Id: 3369, Natural disaster type: Winter Storm
- South Carolina Severe Winter Storm, Incident Period: February 10, 2014 to February 15, 2014, Major Disaster (Presidential) Declared DR-4166: March 12, 2014, FEMA Id: 4166, Natural disaster type: Winter Storm
- South Carolina Hurricane Katrina Evacuation, Incident Period: August 29, 2005 to October 01, 2005, Emergency Declared EM-3233: September 10, 2005, FEMA Id: 3233, Natural disaster type: Hurricane
- South Carolina Severe Ice Storm, Incident Period: January 26, 2004 to January 30, 2004, Major Disaster (Presidential) Declared DR-1509: February 13, 2004, FEMA Id: 1509, Natural disaster type: Ice Storm
- 4 other natural disasters have been reported since 1953.
The number of natural disasters in Barnwell County (14) is near the US average (15).
Major Disasters (Presidential) Declared: 5
Emergencies Declared: 6
Causes of natural disasters: Hurricanes: 6, Winter Storms: 3, Storms: 2, Drought: 1, Flood: 1, Ice Storm: 1, Tornado: 1, Wind: 1, Other: 1 (Note: some incidents may be assigned to more than one category).
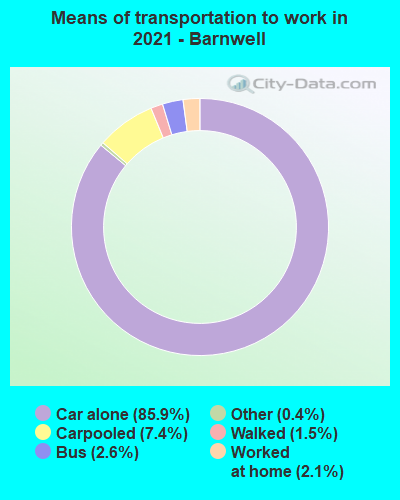
Means of transportation to work:
- Drove a car alone: 5,724 (80.0%)
- Carpooled: 693 (9.7%)
- Bus: 189 (2.6%)
- Taxicab, motorcycle, or other means: 39 (0.5%)
- Bicycle: 11 (0.2%)
- Walked: 67 (0.9%)
- Worked at home: 251 (3.5%)
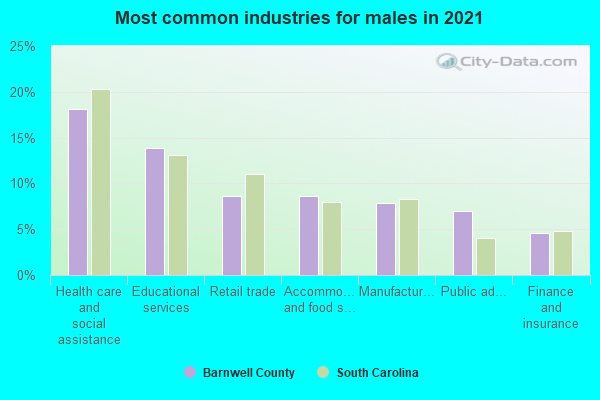
- Health care and social assistance (21%)
- Educational services (12%)
- Accommodation and food services (11%)
- Retail trade (9%)
- Manufacturing (9%)
- Public administration (5%)
- Finance and insurance (5%)
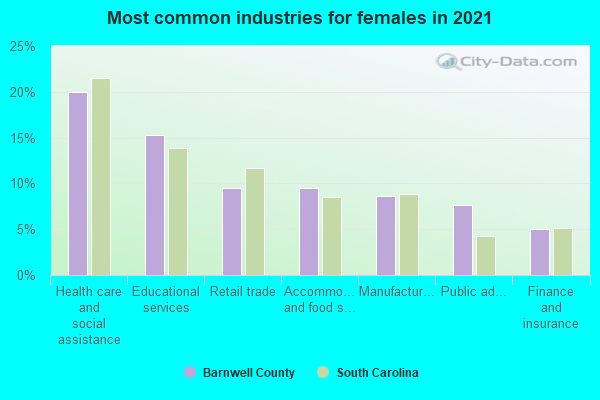
- Health care and social assistance (22%)
- Educational services (12%)
- Accommodation and food services (11%)
- Retail trade (9%)
- Manufacturing (9%)
- Public administration (5%)
- Finance and insurance (5%)
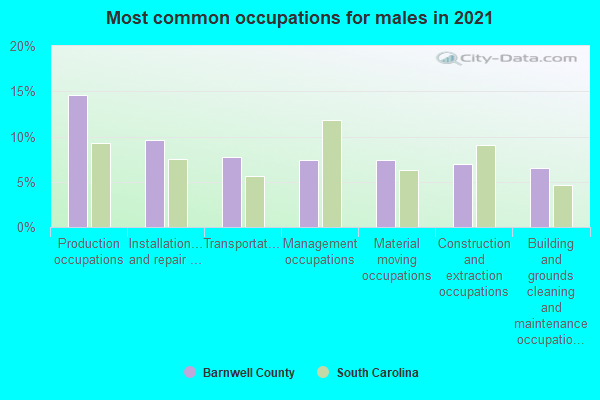
- Production occupations (18%)
- Transportation occupations (11%)
- Management occupations (8%)
- Installation, maintenance, and repair occupations (8%)
- Construction and extraction occupations (8%)
- Building and grounds cleaning and maintenance occupations (6%)
- Office and administrative support occupations (6%)
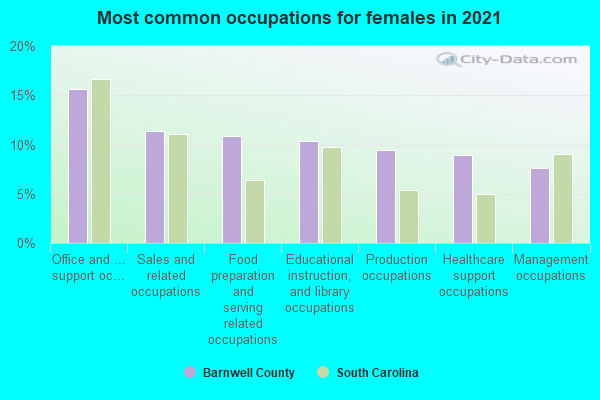
- Office and administrative support occupations (18%)
- Healthcare support occupations (13%)
- Educational instruction, and library occupations (10%)
- Sales and related occupations (10%)
- Food preparation and serving related occupations (10%)
- Production occupations (9%)
- Management occupations (8%)
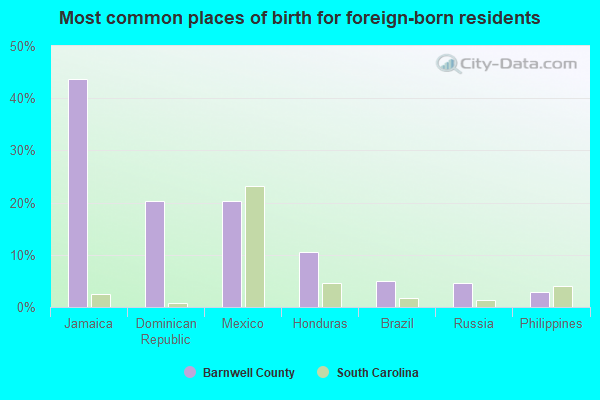
- Jamaica (21%)
- Other South Central Asia (12%)
- Ghana (11%)
- India (10%)
- Brazil (10%)
- Dominican Republic (7%)
- China, excluding Hong Kong and Taiwan (6%)
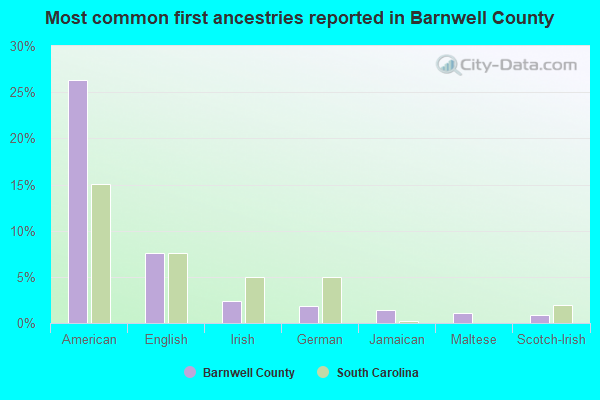
- American (28%)
- English (6%)
- Irish (2%)
- African (2%)
- German (2%)
- Scottish (1%)
- Scotch-Irish (1%)
People in group quarters in Barnwell County, South Carolina in 2010:
- 168 people in nursing facilities/skilled-nursing facilities
- 70 people in local jails and other municipal confinement facilities
- 39 people in group homes intended for adults
- 8 people in group homes for juveniles (non-correctional)
People in group quarters in Barnwell County, South Carolina in 2000:
- 171 people in nursing homes
- 61 people in local jails and other confinement facilities (including police lockups)
- 21 people in other noninstitutional group quarters
- 16 people in homes for the mentally retarded
- 8 people in other group homes
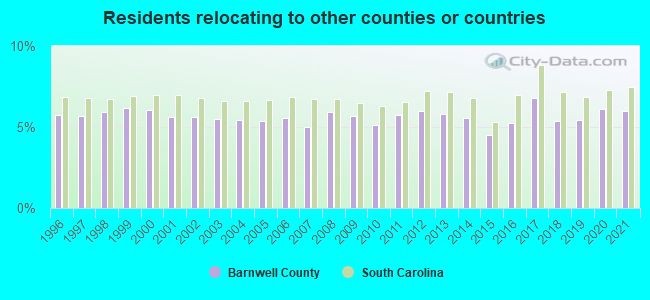
6.17% of this county's 2021 resident taxpayers lived in other counties in 2020 ($39,489 average adjusted gross income)
| Here: | 6.17% |
| South Carolina average: | 8.89% |
10 or fewer of this county's residents moved from foreign countries.
4.18% relocated from other counties in South Carolina ($27,113 average AGI)
2.00% relocated from other states ($12,376 average AGI)
Barnwell County: 2.00% South Carolina average: 4.96%

Top counties from which taxpayers relocated into this county between 2020 and 2021:
| from Aiken County, SC | |
| from Bamberg County, SC | |
| from Allendale County, SC | |
| from Richland County, SC | |
| from Lexington County, SC |
5.99% of this county's 2020 resident taxpayers moved to other counties in 2021 ($42,460 average adjusted gross income)
| Here: | 5.99% |
| South Carolina average: | 7.46% |
10 or fewer of this county's residents moved to foreign countries.
4.80% relocated to other counties in South Carolina ($33,164 average AGI)
1.19% relocated to other states ($9,297 average AGI)
Barnwell County: 1.19% South Carolina average: 3.47%
Top counties to which taxpayers relocated from this county between 2020 and 2021:
| to Aiken County, SC | |
| to Richland County, SC | |
| to Bamberg County, SC | |
| to Lexington County, SC | |
| to Orangeburg County, SC | |
| to Allendale County, SC |
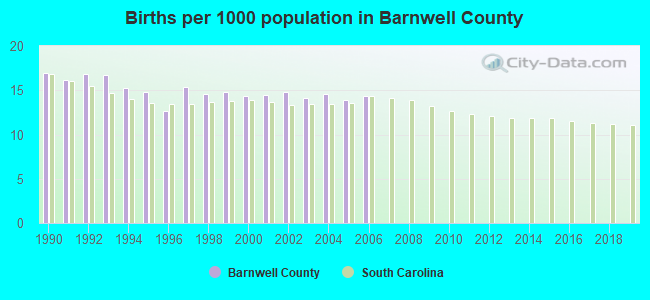
Births per 1000 population from 1990 to 1999: 15.4
Births per 1000 population from 2000 to 2006: 14.4
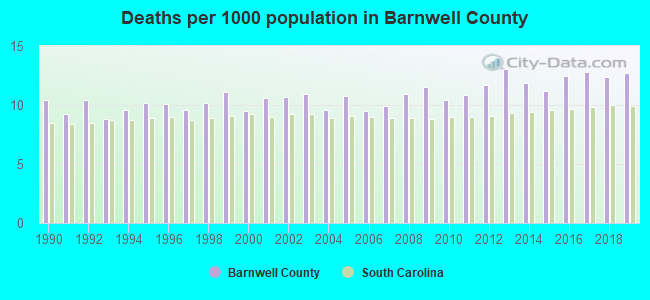
Deaths per 1000 population from 1990 to 1999: 10.0
Deaths per 1000 population from 2000 to 2009: 10.4
Deaths per 1000 population from 2010 to 2020: 12.4
Infant deaths per 1000 live births from 1990 to 1999: 10.4
Infant deaths per 1000 live births from 2000 to 2006: 13.3

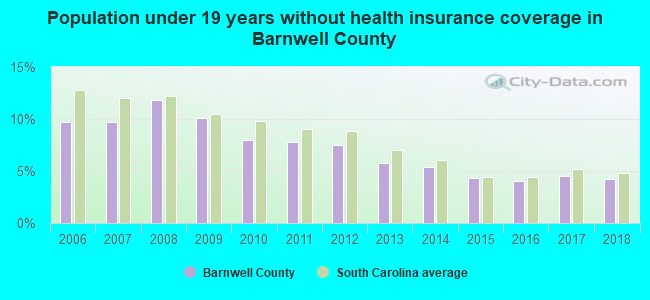
Persons under 19 years old without health insurance coverage in 2018: 4.2%
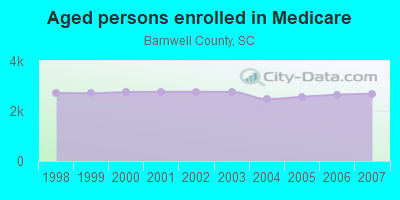
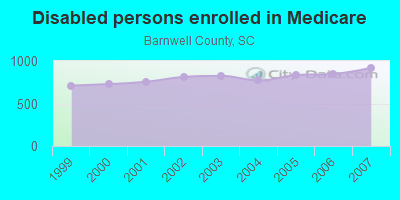
Persons enrolled in hospital insurance and/or supplemental medical insurance (Medicare) in July 1, 2007: 3,616 (2,696 aged, 920 disabled)
Children under 18 without health insurance coverage in 2007: 543 (9%)

Most common underlying causes of death in Barnwell County, South Carolina in 1999 - 2019:
- Atherosclerotic heart disease (363)
- Bronchus or lung, unspecified - Malignant neoplasms (282)
- Chronic obstructive pulmonary disease, unspecified (194)
- Congestive heart failure (109)
- Alzheimer disease, unspecified (102)
- Acute myocardial infarction, unspecified (95)
- Stroke, not specified as haemorrhage or infarction (90)
- Pneumonia, unspecified (38)
- Unspecified dementia (35)
- Other forms of acute ischaemic heart disease (15)
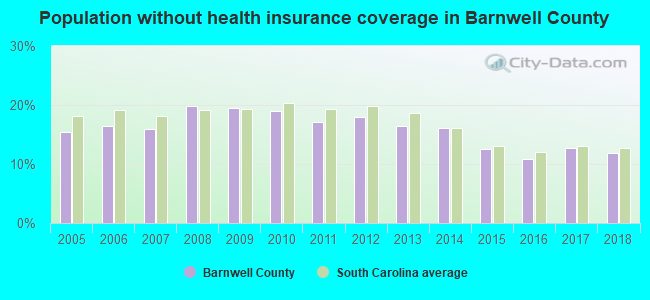
Population without health insurance coverage in 2000: 17%
Children under 18 without health insurance coverage in 2000: 14%
Short term general hospital admissions per 100,000 population in 2004: 4,978
Short term general hospital beds per 100,000 population in 2004: 141
Emergency room visits per 100,000 population in 2004: 47,970
General practice office based MDs per 100,000 population in 2005: 1,491
Medical specialist MDs per 100,000 population in 2005: 1,058
Dentists per 100,000 population in 1998: 13
Total births per 100,000 population, July 2005 - July 2006 : 28
Total deaths per 100,000 population, July 2005 - July 2006: 86
Crimes per 100,000 population in 1996: 1
Household type by relationship:
Households: 21,214- Male householders: 3,742 (1,289 living alone), Female householders: 5,076 (1,848 living alone)
3,228 spouses (3,228 opposite-sex spouses), 318 unmarried partners, (316 opposite-sex unmarried partners), 6,353 children (5,985 natural, 175 adopted, 187 stepchildren), 777 grandchildren, 275 brothers or sisters, 171 parents, 29 foster children, 269 other relatives, 492 non-relatives
- In group quarters: 410
Size of family households: 2,987 2-persons, 1,213 3-persons, 706 4-persons, 214 5-persons, 109 6-persons, 158 7-or-more-persons.
Size of nonfamily households: 3,139 1-person, 287 2-persons, 15 5-persons.
1,388 married couples with children.
2,584 single-parent households (194 men, 2,390 women).
96.9% of residents of Barnwell speak English at home.
1.7% of residents speak Spanish at home (66% speak English very well, 23% speak English well, 11% speak English not well).
0.9% of residents speak other Indo-European language at home (99% speak English very well, 1% speak English well).
0.2% of residents speak Asian or Pacific Island language at home (100% speak English very well).
0.3% of residents speak other language at home (100% speak English well).
In fiscal year 2004:
Federal Government expenditure: $149,443,000 ($6,385 per capita)
Department of Defense expenditure: $11,173,000
Federal direct payments to individuals for retirement and disability: $54,653,000
Federal other direct payments to individuals: $32,872,000
Federal direct payments not to individuals: $3,745,000
Federal grants: $46,086,000
Federal procurement contracts: $9,416,000 ($8,737,000 Department of Defense)
Federal salaries and wages: $2,672,000 ($6,000 Department of Defense)
Federal Government direct loans: $3,491,000
Federal guaranteed/insured loans: $2,382,000
Federal Government insurance: $2,685,000
Population change from April 1, 2000 to July 1, 2005:
Births: 1,789| Here: | 77 per 1000 residents |
| State: | 69 per 1000 residents |
Deaths: 1,299
| Here: | 56 per 1000 residents |
| State: | 46 per 1000 residents |
Net international migration: +19
| Here: | +1 per 1000 residents |
| State: | +9 per 1000 residents |
Net internal migration: -615
| Here: | |
| State: |
Total withdrawal of fresh water for public supply: 2.73 millions of gallons per day (all from ground)
| Here: | 6.1 |
| State: | 6.4 |
| Here: | 4.5 |
| State: | 4.5 |
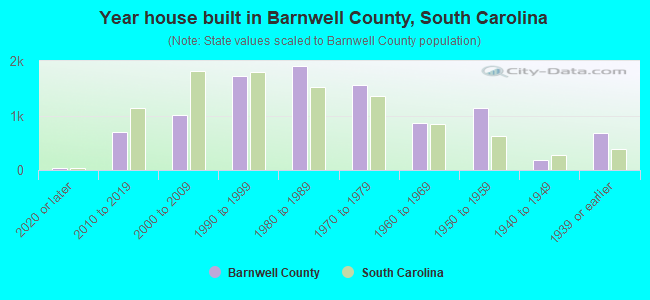
- Year house built in Barnwell County, South Carolina
- 252020 or later
- 6402010 to 2019
- 9832000 to 2009
- 1,9381990 to 1999
- 2,0611980 to 1989
- 1,3771970 to 1979
- 9021960 to 1969
- 1,0571950 to 1959
- 1821940 to 1949
- 5871939 or earlier
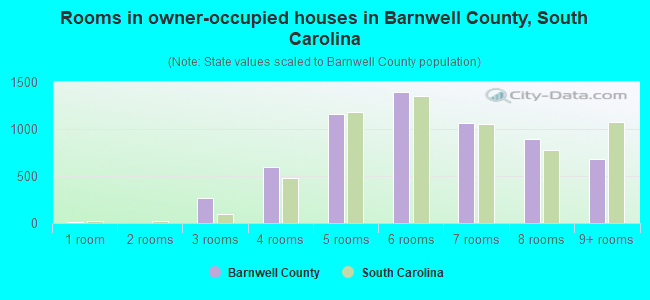
- Rooms in owner-occupied houses in Barnwell County, South Carolina
- 51 room
- 02 rooms
- 2553 rooms
- 5964 rooms
- 1,3615 rooms
- 1,5776 rooms
- 1,0367 rooms
- 7148 rooms
- 8059+ rooms
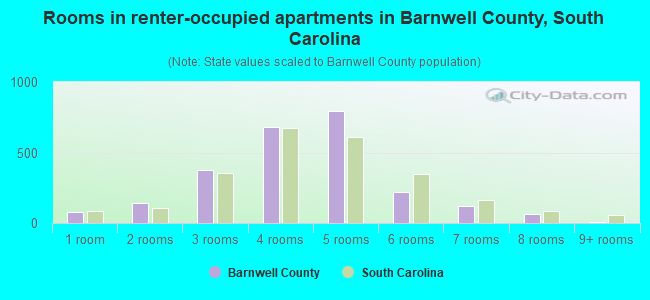
- Rooms in renter-occupied apartments in Barnwell County, South Carolina
- 701 room
- 2052 rooms
- 2693 rooms
- 7724 rooms
- 7325 rooms
- 2876 rooms
- 657 rooms
- 508 rooms
- 199+ rooms
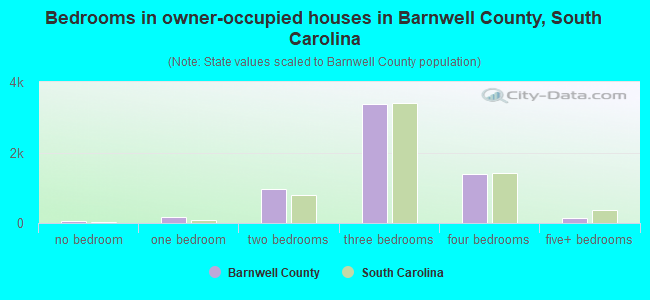
- Bedrooms in owner-occupied houses in Barnwell County, South Carolina
- 38no bedroom
- 1471 bedroom
- 1,0242 bedrooms
- 3,7393 bedrooms
- 1,2514 bedrooms
- 1355+ bedrooms

- Bedrooms in renter-occupied apartments in Barnwell County, South Carolina
- 72no bedroom
- 4721 bedroom
- 9542 bedrooms
- 8443 bedrooms
- 924 bedrooms
- 145+ bedrooms
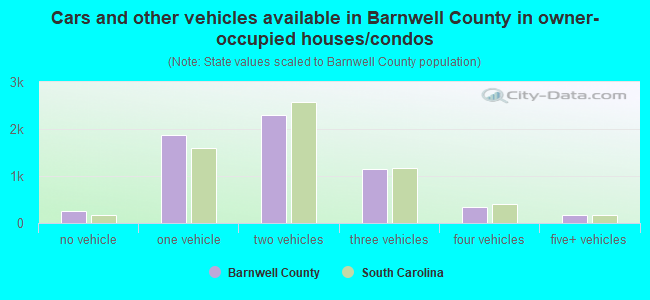
- Cars and other vehicles available in Barnwell County in owner-occupied houses/condos
- 266no vehicle
- 1,9661 vehicle
- 2,1962 vehicles
- 1,3163 vehicles
- 4404 vehicles
- 1705+ vehicles

- Cars and other vehicles available in Barnwell County in renter-occupied apartments
- 687no vehicle
- 1,1521 vehicle
- 4112 vehicles
- 1613 vehicles
- 104 vehicles
- 95+ vehicles
90.9% of Barnwell County residents lived in the same house 1 years ago.
Out of people who lived in different houses, 29% lived in this county.
Out of people who lived in different counties, 88% lived in South Carolina.
| Barnwell County: | 90.9% |
| State average: | 86.5% |
Place of birth for U.S.-born residents:
- This state: 14,169
- Other state: 6,245
- Northeast: 1,226
- Midwest: 557
- South: 4,212
- West: 182
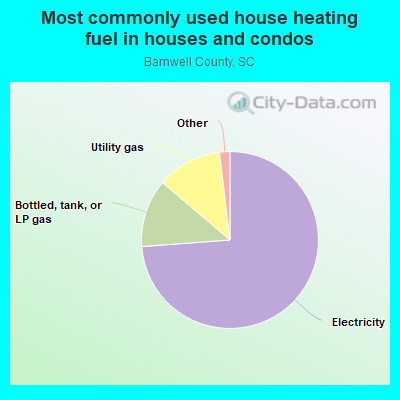
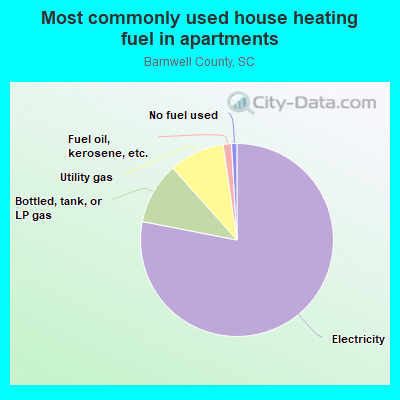
- 75.3%Electricity
- 12.5%Bottled, tank, or LP gas
- 10.9%Utility gas
- 0.8%Wood
- 0.4%Fuel oil, kerosene, etc.
- 82.6%Electricity
- 8.6%Utility gas
- 6.2%Bottled, tank, or LP gas
- 1.2%No fuel used
- 0.8%Wood
- 0.6%Other fuel
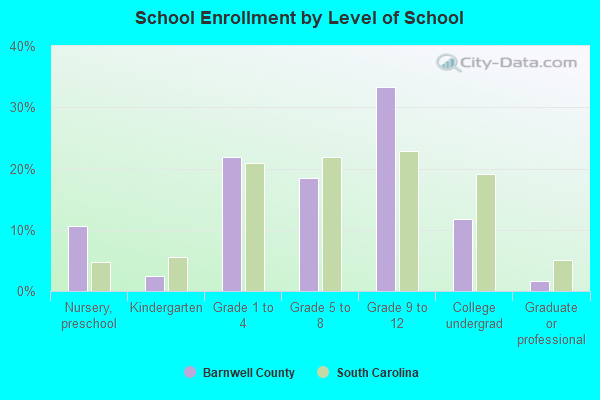
Private vs. public school enrollment:
| Here: | 20.3% |
| South Carolina: | 14.4% |
| Here: | 14.0% |
| South Carolina: | 11.1% |
| Here: | 15.2% |
| South Carolina: | 21.9% |

Barnwell County government finances - Expenditure in 2018:
- Bond Funds - Cash and Securities: $406,000
- Charges - Solid Waste Management: $459,000
Air Transportation: $184,000
Natural Resources - Other: $14,000
- Construction - Judicial and Legal Services: $158,000
- Current Operations - General - Other: $7,847,000
Police Protection: $2,469,000
Correctional Institutions: $1,743,000
Regular Highways: $1,183,000
Financial Administration: $1,138,000
Solid Waste Management: $1,084,000
Health - Other: $1,031,000
Judicial and Legal Services: $759,000
Central Staff Services: $672,000
Air Transportation: $451,000
Local Fire Protection: $384,000
Protective Inspection and Regulation - Other: $49,000
Parks and Recreation: $40,000
Miscellaneous Commercial Activities - Other: $8,000
Natural Resources - Other: $1,000
- Federal Intergovernmental - Other: $2,382,000
Air Transportation: $480,000
- General - Interest on Debt: $878,000
- Intergovernmental to Local - Other - Health - Other: $220,000
Other - Libraries: $206,000
Other - Public Welfare - Other: $72,000
Other - Central Staff Services: $43,000
- Intergovernmental to State - Public Welfare: $40,000
- Local Intergovernmental - Highways: $784,000
Other: $727,000
- Long Term Debt - Beginning Outstanding - Unspecified Public Purpose: $21,954,000
Outstanding Unspecified Public Purpose: $20,596,000
Retired Unspecified Public Purpose: $1,868,000
Issue, Unspecified Public Purpose: $511,000
- Miscellaneous - General Revenue - Other: $5,292,000
Fines and Forfeits: $366,000
Donations From Private Sources: $17,000
Interest Earnings: $9,000
- Other Capital Outlay - Solid Waste Management: $214,000
Local Fire Protection: $110,000
- Other Funds - Cash and Securities: $20,828,000
- State Intergovernmental - Other: $3,957,000
- Tax - Property: $5,806,000
Other License: $46,000
Motor Vehicle License: $16,000
- Total Salaries and Wages: $5,917,000
Barnwell County government finances - Revenue in 2018:
- Bond Funds - Cash and Securities: $406,000
- Charges - Solid Waste Management: $459,000
Air Transportation: $184,000
Natural Resources - Other: $14,000
- Construction - Judicial and Legal Services: $158,000
- Current Operations - General - Other: $7,847,000
Police Protection: $2,469,000
Correctional Institutions: $1,743,000
Regular Highways: $1,183,000
Financial Administration: $1,138,000
Solid Waste Management: $1,084,000
Health - Other: $1,031,000
Judicial and Legal Services: $759,000
Central Staff Services: $672,000
Air Transportation: $451,000
Local Fire Protection: $384,000
Protective Inspection and Regulation - Other: $49,000
Parks and Recreation: $40,000
Miscellaneous Commercial Activities - Other: $8,000
Natural Resources - Other: $1,000
- Federal Intergovernmental - Other: $2,382,000
Air Transportation: $480,000
- General - Interest on Debt: $878,000
- Intergovernmental to Local - Other - Health - Other: $220,000
Other - Libraries: $206,000
Other - Public Welfare - Other: $72,000
Other - Central Staff Services: $43,000
- Intergovernmental to State - Public Welfare: $40,000
- Local Intergovernmental - Highways: $784,000
Other: $727,000
- Long Term Debt - Beginning Outstanding - Unspecified Public Purpose: $21,954,000
Outstanding Unspecified Public Purpose: $20,596,000
Retired Unspecified Public Purpose: $1,868,000
Issue, Unspecified Public Purpose: $511,000
- Miscellaneous - General Revenue - Other: $5,292,000
Fines and Forfeits: $366,000
Donations From Private Sources: $17,000
Interest Earnings: $9,000
- Other Capital Outlay - Solid Waste Management: $214,000
Local Fire Protection: $110,000
- Other Funds - Cash and Securities: $20,828,000
- State Intergovernmental - Other: $3,957,000
- Tax - Property: $5,806,000
Other License: $46,000
Motor Vehicle License: $16,000
- Total Salaries and Wages: $5,917,000
Barnwell County government finances - Debt in 2018:
- Bond Funds - Cash and Securities: $406,000
- Charges - Solid Waste Management: $459,000
Air Transportation: $184,000
Natural Resources - Other: $14,000
- Construction - Judicial and Legal Services: $158,000
- Current Operations - General - Other: $7,847,000
Police Protection: $2,469,000
Correctional Institutions: $1,743,000
Regular Highways: $1,183,000
Financial Administration: $1,138,000
Solid Waste Management: $1,084,000
Health - Other: $1,031,000
Judicial and Legal Services: $759,000
Central Staff Services: $672,000
Air Transportation: $451,000
Local Fire Protection: $384,000
Protective Inspection and Regulation - Other: $49,000
Parks and Recreation: $40,000
Miscellaneous Commercial Activities - Other: $8,000
Natural Resources - Other: $1,000
- Federal Intergovernmental - Other: $2,382,000
Air Transportation: $480,000
- General - Interest on Debt: $878,000
- Intergovernmental to Local - Other - Health - Other: $220,000
Other - Libraries: $206,000
Other - Public Welfare - Other: $72,000
Other - Central Staff Services: $43,000
- Intergovernmental to State - Public Welfare: $40,000
- Local Intergovernmental - Highways: $784,000
Other: $727,000
- Long Term Debt - Beginning Outstanding - Unspecified Public Purpose: $21,954,000
Outstanding Unspecified Public Purpose: $20,596,000
Retired Unspecified Public Purpose: $1,868,000
Issue, Unspecified Public Purpose: $511,000
- Miscellaneous - General Revenue - Other: $5,292,000
Fines and Forfeits: $366,000
Donations From Private Sources: $17,000
Interest Earnings: $9,000
- Other Capital Outlay - Solid Waste Management: $214,000
Local Fire Protection: $110,000
- Other Funds - Cash and Securities: $20,828,000
- State Intergovernmental - Other: $3,957,000
- Tax - Property: $5,806,000
Other License: $46,000
Motor Vehicle License: $16,000
- Total Salaries and Wages: $5,917,000
Barnwell County government finances - Cash and Securities in 2018:
- Bond Funds - Cash and Securities: $406,000
- Charges - Solid Waste Management: $459,000
Air Transportation: $184,000
Natural Resources - Other: $14,000
- Construction - Judicial and Legal Services: $158,000
- Current Operations - General - Other: $7,847,000
Police Protection: $2,469,000
Correctional Institutions: $1,743,000
Regular Highways: $1,183,000
Financial Administration: $1,138,000
Solid Waste Management: $1,084,000
Health - Other: $1,031,000
Judicial and Legal Services: $759,000
Central Staff Services: $672,000
Air Transportation: $451,000
Local Fire Protection: $384,000
Protective Inspection and Regulation - Other: $49,000
Parks and Recreation: $40,000
Miscellaneous Commercial Activities - Other: $8,000
Natural Resources - Other: $1,000
- Federal Intergovernmental - Other: $2,382,000
Air Transportation: $480,000
- General - Interest on Debt: $878,000
- Intergovernmental to Local - Other - Health - Other: $220,000
Other - Libraries: $206,000
Other - Public Welfare - Other: $72,000
Other - Central Staff Services: $43,000
- Intergovernmental to State - Public Welfare: $40,000
- Local Intergovernmental - Highways: $784,000
Other: $727,000
- Long Term Debt - Beginning Outstanding - Unspecified Public Purpose: $21,954,000
Outstanding Unspecified Public Purpose: $20,596,000
Retired Unspecified Public Purpose: $1,868,000
Issue, Unspecified Public Purpose: $511,000
- Miscellaneous - General Revenue - Other: $5,292,000
Fines and Forfeits: $366,000
Donations From Private Sources: $17,000
Interest Earnings: $9,000
- Other Capital Outlay - Solid Waste Management: $214,000
Local Fire Protection: $110,000
- Other Funds - Cash and Securities: $20,828,000
- State Intergovernmental - Other: $3,957,000
- Tax - Property: $5,806,000
Other License: $46,000
Motor Vehicle License: $16,000
- Total Salaries and Wages: $5,917,000
Supplemental Security Income (SSI) in 2006:
- Total number of recipients: 1,043
- Number of aged recipients: 104
- Number of blind and disabled recipients: 939
- Number of recipients under 18: 176
- Number of recipients between 18 and 64: 624
- Number of recipients older than 64: 243
- Number of recipients also receiving OASDI: 392
- Amount of payments (thousands of dollars): 454
| Most common first names in Barnwell County, SC among deceased individuals | ||
| Name | Count | Lived (average) |
|---|---|---|
| James | 203 | 69.8 years |
| Mary | 156 | 76.2 years |
| John | 144 | 73.0 years |
| William | 137 | 71.3 years |
| Willie | 112 | 71.2 years |
| Robert | 82 | 71.0 years |
| George | 81 | 72.4 years |
| Annie | 77 | 80.5 years |
| Henry | 61 | 72.5 years |
| Elizabeth | 50 | 79.5 years |
| Most common last names in Barnwell County, SC among deceased individuals | ||
| Last name | Count | Lived (average) |
|---|---|---|
| Williams | 174 | 74.1 years |
| Still | 132 | 74.6 years |
| Johnson | 111 | 71.1 years |
| Sanders | 105 | 75.2 years |
| Brown | 98 | 72.4 years |
| Hutto | 71 | 72.3 years |
| Black | 70 | 76.8 years |
| Owens | 70 | 73.0 years |
| Smith | 69 | 74.8 years |
| Creech | 68 | 71.8 years |
| Businesses in Barnwell County, SC | ||||
| Name | Count | Name | Count | |
|---|---|---|---|---|
| Advance Auto Parts | 1 | McDonald's | 1 | |
| CVS | 1 | Nike | 3 | |
| Days Inn | 1 | Pizza Hut | 1 | |
| Domino's Pizza | 1 | RadioShack | 1 | |
| FedEx | 4 | Rite Aid | 1 | |
| Ford | 2 | Subway | 3 | |
| H&R Block | 2 | True Value | 1 | |
| Hardee's | 2 | U-Haul | 2 | |
| KFC | 1 | UPS | 3 | |
| MasterBrand Cabinets | 2 | Walmart | 1 | |