Trotwood, Ohio Submit your own pictures of this city and show them to the world
OSM Map
General Map
Google Map
MSN Map
OSM Map
General Map
Google Map
MSN Map
OSM Map
General Map
Google Map
MSN Map
OSM Map
General Map
Google Map
MSN Map
Please wait while loading the map...
Population in 2022: 22,959 (93% urban, 7% rural). Population change since 2000: -16.3%Males: 9,759 Females: 13,200
March 2022 cost of living index in Trotwood: 93.6 (less than average, U.S. average is 100) Percentage of residents living in poverty in 2022: 23.8%for White Non-Hispanic residents , 24.6% for Black residents , 1.7% for Hispanic or Latino residents , 5.4% for other race residents , 11.5% for two or more races residents )
Profiles of local businesses
Business Search - 14 Million verified businesses
Data:
Median household income ($)
Median household income (% change since 2000)
Household income diversity
Ratio of average income to average house value (%)
Ratio of average income to average rent
Median household income ($) - White
Median household income ($) - Black or African American
Median household income ($) - Asian
Median household income ($) - Hispanic or Latino
Median household income ($) - American Indian and Alaska Native
Median household income ($) - Multirace
Median household income ($) - Other Race
Median household income for houses/condos with a mortgage ($)
Median household income for apartments without a mortgage ($)
Races - White alone (%)
Races - White alone (% change since 2000)
Races - Black alone (%)
Races - Black alone (% change since 2000)
Races - American Indian alone (%)
Races - American Indian alone (% change since 2000)
Races - Asian alone (%)
Races - Asian alone (% change since 2000)
Races - Hispanic (%)
Races - Hispanic (% change since 2000)
Races - Native Hawaiian and Other Pacific Islander alone (%)
Races - Native Hawaiian and Other Pacific Islander alone (% change since 2000)
Races - Two or more races (%)
Races - Two or more races (% change since 2000)
Races - Other race alone (%)
Races - Other race alone (% change since 2000)
Racial diversity
Unemployment (%)
Unemployment (% change since 2000)
Unemployment (%) - White
Unemployment (%) - Black or African American
Unemployment (%) - Asian
Unemployment (%) - Hispanic or Latino
Unemployment (%) - American Indian and Alaska Native
Unemployment (%) - Multirace
Unemployment (%) - Other Race
Population density (people per square mile)
Population - Males (%)
Population - Females (%)
Population - Males (%) - White
Population - Males (%) - Black or African American
Population - Males (%) - Asian
Population - Males (%) - Hispanic or Latino
Population - Males (%) - American Indian and Alaska Native
Population - Males (%) - Multirace
Population - Males (%) - Other Race
Population - Females (%) - White
Population - Females (%) - Black or African American
Population - Females (%) - Asian
Population - Females (%) - Hispanic or Latino
Population - Females (%) - American Indian and Alaska Native
Population - Females (%) - Multirace
Population - Females (%) - Other Race
Coronavirus confirmed cases (May 16, 2024)
Deaths caused by coronavirus (May 16, 2024)
Coronavirus confirmed cases (per 100k population) (May 16, 2024)
Deaths caused by coronavirus (per 100k population) (May 16, 2024)
Daily increase in number of cases (May 16, 2024)
Weekly increase in number of cases (May 16, 2024)
Cases doubled (in days) (May 16, 2024)
Hospitalized patients (Apr 18, 2022)
Negative test results (Apr 18, 2022)
Total test results (Apr 18, 2022)
COVID Vaccine doses distributed (per 100k population) (Sep 19, 2023)
COVID Vaccine doses administered (per 100k population) (Sep 19, 2023)
COVID Vaccine doses distributed (Sep 19, 2023)
COVID Vaccine doses administered (Sep 19, 2023)
Likely homosexual households (%)
Likely homosexual households (% change since 2000)
Likely homosexual households - Lesbian couples (%)
Likely homosexual households - Lesbian couples (% change since 2000)
Likely homosexual households - Gay men (%)
Likely homosexual households - Gay men (% change since 2000)
Cost of living index
Median gross rent ($)
Median contract rent ($)
Median monthly housing costs ($)
Median house or condo value ($)
Median house or condo value ($ change since 2000)
Mean house or condo value by units in structure - 1, detached ($)
Mean house or condo value by units in structure - 1, attached ($)
Mean house or condo value by units in structure - 2 ($)
Mean house or condo value by units in structure by units in structure - 3 or 4 ($)
Mean house or condo value by units in structure - 5 or more ($)
Mean house or condo value by units in structure - Boat, RV, van, etc. ($)
Mean house or condo value by units in structure - Mobile home ($)
Median house or condo value ($) - White
Median house or condo value ($) - Black or African American
Median house or condo value ($) - Asian
Median house or condo value ($) - Hispanic or Latino
Median house or condo value ($) - American Indian and Alaska Native
Median house or condo value ($) - Multirace
Median house or condo value ($) - Other Race
Median resident age
Resident age diversity
Median resident age - Males
Median resident age - Females
Median resident age - White
Median resident age - Black or African American
Median resident age - Asian
Median resident age - Hispanic or Latino
Median resident age - American Indian and Alaska Native
Median resident age - Multirace
Median resident age - Other Race
Median resident age - Males - White
Median resident age - Males - Black or African American
Median resident age - Males - Asian
Median resident age - Males - Hispanic or Latino
Median resident age - Males - American Indian and Alaska Native
Median resident age - Males - Multirace
Median resident age - Males - Other Race
Median resident age - Females - White
Median resident age - Females - Black or African American
Median resident age - Females - Asian
Median resident age - Females - Hispanic or Latino
Median resident age - Females - American Indian and Alaska Native
Median resident age - Females - Multirace
Median resident age - Females - Other Race
Commute - mean travel time to work (minutes)
Travel time to work - Less than 5 minutes (%)
Travel time to work - Less than 5 minutes (% change since 2000)
Travel time to work - 5 to 9 minutes (%)
Travel time to work - 5 to 9 minutes (% change since 2000)
Travel time to work - 10 to 19 minutes (%)
Travel time to work - 10 to 19 minutes (% change since 2000)
Travel time to work - 20 to 29 minutes (%)
Travel time to work - 20 to 29 minutes (% change since 2000)
Travel time to work - 30 to 39 minutes (%)
Travel time to work - 30 to 39 minutes (% change since 2000)
Travel time to work - 40 to 59 minutes (%)
Travel time to work - 40 to 59 minutes (% change since 2000)
Travel time to work - 60 to 89 minutes (%)
Travel time to work - 60 to 89 minutes (% change since 2000)
Travel time to work - 90 or more minutes (%)
Travel time to work - 90 or more minutes (% change since 2000)
Marital status - Never married (%)
Marital status - Now married (%)
Marital status - Separated (%)
Marital status - Widowed (%)
Marital status - Divorced (%)
Median family income ($)
Median family income (% change since 2000)
Median non-family income ($)
Median non-family income (% change since 2000)
Median per capita income ($)
Median per capita income (% change since 2000)
Median family income ($) - White
Median family income ($) - Black or African American
Median family income ($) - Asian
Median family income ($) - Hispanic or Latino
Median family income ($) - American Indian and Alaska Native
Median family income ($) - Multirace
Median family income ($) - Other Race
Median year house/condo built
Median year apartment built
Year house built - Built 2005 or later (%)
Year house built - Built 2000 to 2004 (%)
Year house built - Built 1990 to 1999 (%)
Year house built - Built 1980 to 1989 (%)
Year house built - Built 1970 to 1979 (%)
Year house built - Built 1960 to 1969 (%)
Year house built - Built 1950 to 1959 (%)
Year house built - Built 1940 to 1949 (%)
Year house built - Built 1939 or earlier (%)
Average household size
Household density (households per square mile)
Average household size - White
Average household size - Black or African American
Average household size - Asian
Average household size - Hispanic or Latino
Average household size - American Indian and Alaska Native
Average household size - Multirace
Average household size - Other Race
Occupied housing units (%)
Vacant housing units (%)
Owner occupied housing units (%)
Renter occupied housing units (%)
Vacancy status - For rent (%)
Vacancy status - For sale only (%)
Vacancy status - Rented or sold, not occupied (%)
Vacancy status - For seasonal, recreational, or occasional use (%)
Vacancy status - For migrant workers (%)
Vacancy status - Other vacant (%)
Residents with income below the poverty level (%)
Residents with income below 50% of the poverty level (%)
Children below poverty level (%)
Poor families by family type - Married-couple family (%)
Poor families by family type - Male, no wife present (%)
Poor families by family type - Female, no husband present (%)
Poverty status for native-born residents (%)
Poverty status for foreign-born residents (%)
Poverty among high school graduates not in families (%)
Poverty among people who did not graduate high school not in families (%)
Residents with income below the poverty level (%) - White
Residents with income below the poverty level (%) - Black or African American
Residents with income below the poverty level (%) - Asian
Residents with income below the poverty level (%) - Hispanic or Latino
Residents with income below the poverty level (%) - American Indian and Alaska Native
Residents with income below the poverty level (%) - Multirace
Residents with income below the poverty level (%) - Other Race
Air pollution - Air Quality Index (AQI)
Air pollution - CO
Air pollution - NO2
Air pollution - SO2
Air pollution - Ozone
Air pollution - PM10
Air pollution - PM25
Air pollution - Pb
Crime - Murders per 100,000 population
Crime - Rapes per 100,000 population
Crime - Robberies per 100,000 population
Crime - Assaults per 100,000 population
Crime - Burglaries per 100,000 population
Crime - Thefts per 100,000 population
Crime - Auto thefts per 100,000 population
Crime - Arson per 100,000 population
Crime - City-data.com crime index
Crime - Violent crime index
Crime - Property crime index
Crime - Murders per 100,000 population (5 year average)
Crime - Rapes per 100,000 population (5 year average)
Crime - Robberies per 100,000 population (5 year average)
Crime - Assaults per 100,000 population (5 year average)
Crime - Burglaries per 100,000 population (5 year average)
Crime - Thefts per 100,000 population (5 year average)
Crime - Auto thefts per 100,000 population (5 year average)
Crime - Arson per 100,000 population (5 year average)
Crime - City-data.com crime index (5 year average)
Crime - Violent crime index (5 year average)
Crime - Property crime index (5 year average)
1996 Presidential Elections Results (%) - Democratic Party (Clinton)
1996 Presidential Elections Results (%) - Republican Party (Dole)
1996 Presidential Elections Results (%) - Other
2000 Presidential Elections Results (%) - Democratic Party (Gore)
2000 Presidential Elections Results (%) - Republican Party (Bush)
2000 Presidential Elections Results (%) - Other
2004 Presidential Elections Results (%) - Democratic Party (Kerry)
2004 Presidential Elections Results (%) - Republican Party (Bush)
2004 Presidential Elections Results (%) - Other
2008 Presidential Elections Results (%) - Democratic Party (Obama)
2008 Presidential Elections Results (%) - Republican Party (McCain)
2008 Presidential Elections Results (%) - Other
2012 Presidential Elections Results (%) - Democratic Party (Obama)
2012 Presidential Elections Results (%) - Republican Party (Romney)
2012 Presidential Elections Results (%) - Other
2016 Presidential Elections Results (%) - Democratic Party (Clinton)
2016 Presidential Elections Results (%) - Republican Party (Trump)
2016 Presidential Elections Results (%) - Other
2020 Presidential Elections Results (%) - Democratic Party (Biden)
2020 Presidential Elections Results (%) - Republican Party (Trump)
2020 Presidential Elections Results (%) - Other
Ancestries Reported - Arab (%)
Ancestries Reported - Czech (%)
Ancestries Reported - Danish (%)
Ancestries Reported - Dutch (%)
Ancestries Reported - English (%)
Ancestries Reported - French (%)
Ancestries Reported - French Canadian (%)
Ancestries Reported - German (%)
Ancestries Reported - Greek (%)
Ancestries Reported - Hungarian (%)
Ancestries Reported - Irish (%)
Ancestries Reported - Italian (%)
Ancestries Reported - Lithuanian (%)
Ancestries Reported - Norwegian (%)
Ancestries Reported - Polish (%)
Ancestries Reported - Portuguese (%)
Ancestries Reported - Russian (%)
Ancestries Reported - Scotch-Irish (%)
Ancestries Reported - Scottish (%)
Ancestries Reported - Slovak (%)
Ancestries Reported - Subsaharan African (%)
Ancestries Reported - Swedish (%)
Ancestries Reported - Swiss (%)
Ancestries Reported - Ukrainian (%)
Ancestries Reported - United States (%)
Ancestries Reported - Welsh (%)
Ancestries Reported - West Indian (%)
Ancestries Reported - Other (%)
Educational Attainment - No schooling completed (%)
Educational Attainment - Less than high school (%)
Educational Attainment - High school or equivalent (%)
Educational Attainment - Less than 1 year of college (%)
Educational Attainment - 1 or more years of college (%)
Educational Attainment - Associate degree (%)
Educational Attainment - Bachelor's degree (%)
Educational Attainment - Master's degree (%)
Educational Attainment - Professional school degree (%)
Educational Attainment - Doctorate degree (%)
School Enrollment - Nursery, preschool (%)
School Enrollment - Kindergarten (%)
School Enrollment - Grade 1 to 4 (%)
School Enrollment - Grade 5 to 8 (%)
School Enrollment - Grade 9 to 12 (%)
School Enrollment - College undergrad (%)
School Enrollment - Graduate or professional (%)
School Enrollment - Not enrolled in school (%)
School enrollment - Public schools (%)
School enrollment - Private schools (%)
School enrollment - Not enrolled (%)
Median number of rooms in houses and condos
Median number of rooms in apartments
Housing units lacking complete plumbing facilities (%)
Housing units lacking complete kitchen facilities (%)
Density of houses
Urban houses (%)
Rural houses (%)
Households with people 60 years and over (%)
Households with people 65 years and over (%)
Households with people 75 years and over (%)
Households with one or more nonrelatives (%)
Households with no nonrelatives (%)
Population in households (%)
Family households (%)
Nonfamily households (%)
Population in families (%)
Family households with own children (%)
Median number of bedrooms in owner occupied houses
Mean number of bedrooms in owner occupied houses
Median number of bedrooms in renter occupied houses
Mean number of bedrooms in renter occupied houses
Median number of vehichles in owner occupied houses
Mean number of vehichles in owner occupied houses
Median number of vehichles in renter occupied houses
Mean number of vehichles in renter occupied houses
Mortgage status - with mortgage (%)
Mortgage status - with second mortgage (%)
Mortgage status - with home equity loan (%)
Mortgage status - with both second mortgage and home equity loan (%)
Mortgage status - without a mortgage (%)
Average family size
Average family size - White
Average family size - Black or African American
Average family size - Asian
Average family size - Hispanic or Latino
Average family size - American Indian and Alaska Native
Average family size - Multirace
Average family size - Other Race
Geographical mobility - Same house 1 year ago (%)
Geographical mobility - Moved within same county (%)
Geographical mobility - Moved from different county within same state (%)
Geographical mobility - Moved from different state (%)
Geographical mobility - Moved from abroad (%)
Place of birth - Born in state of residence (%)
Place of birth - Born in other state (%)
Place of birth - Native, outside of US (%)
Place of birth - Foreign born (%)
Housing units in structures - 1, detached (%)
Housing units in structures - 1, attached (%)
Housing units in structures - 2 (%)
Housing units in structures - 3 or 4 (%)
Housing units in structures - 5 to 9 (%)
Housing units in structures - 10 to 19 (%)
Housing units in structures - 20 to 49 (%)
Housing units in structures - 50 or more (%)
Housing units in structures - Mobile home (%)
Housing units in structures - Boat, RV, van, etc. (%)
House/condo owner moved in on average (years ago)
Renter moved in on average (years ago)
Year householder moved into unit - Moved in 1999 to March 2000 (%)
Year householder moved into unit - Moved in 1995 to 1998 (%)
Year householder moved into unit - Moved in 1990 to 1994 (%)
Year householder moved into unit - Moved in 1980 to 1989 (%)
Year householder moved into unit - Moved in 1970 to 1979 (%)
Year householder moved into unit - Moved in 1969 or earlier (%)
Means of transportation to work - Drove car alone (%)
Means of transportation to work - Carpooled (%)
Means of transportation to work - Public transportation (%)
Means of transportation to work - Bus or trolley bus (%)
Means of transportation to work - Streetcar or trolley car (%)
Means of transportation to work - Subway or elevated (%)
Means of transportation to work - Railroad (%)
Means of transportation to work - Ferryboat (%)
Means of transportation to work - Taxicab (%)
Means of transportation to work - Motorcycle (%)
Means of transportation to work - Bicycle (%)
Means of transportation to work - Walked (%)
Means of transportation to work - Other means (%)
Working at home (%)
Industry diversity
Most Common Industries - Agriculture, forestry, fishing and hunting, and mining (%)
Most Common Industries - Agriculture, forestry, fishing and hunting (%)
Most Common Industries - Mining, quarrying, and oil and gas extraction (%)
Most Common Industries - Construction (%)
Most Common Industries - Manufacturing (%)
Most Common Industries - Wholesale trade (%)
Most Common Industries - Retail trade (%)
Most Common Industries - Transportation and warehousing, and utilities (%)
Most Common Industries - Transportation and warehousing (%)
Most Common Industries - Utilities (%)
Most Common Industries - Information (%)
Most Common Industries - Finance and insurance, and real estate and rental and leasing (%)
Most Common Industries - Finance and insurance (%)
Most Common Industries - Real estate and rental and leasing (%)
Most Common Industries - Professional, scientific, and management, and administrative and waste management services (%)
Most Common Industries - Professional, scientific, and technical services (%)
Most Common Industries - Management of companies and enterprises (%)
Most Common Industries - Administrative and support and waste management services (%)
Most Common Industries - Educational services, and health care and social assistance (%)
Most Common Industries - Educational services (%)
Most Common Industries - Health care and social assistance (%)
Most Common Industries - Arts, entertainment, and recreation, and accommodation and food services (%)
Most Common Industries - Arts, entertainment, and recreation (%)
Most Common Industries - Accommodation and food services (%)
Most Common Industries - Other services, except public administration (%)
Most Common Industries - Public administration (%)
Occupation diversity
Most Common Occupations - Management, business, science, and arts occupations (%)
Most Common Occupations - Management, business, and financial occupations (%)
Most Common Occupations - Management occupations (%)
Most Common Occupations - Business and financial operations occupations (%)
Most Common Occupations - Computer, engineering, and science occupations (%)
Most Common Occupations - Computer and mathematical occupations (%)
Most Common Occupations - Architecture and engineering occupations (%)
Most Common Occupations - Life, physical, and social science occupations (%)
Most Common Occupations - Education, legal, community service, arts, and media occupations (%)
Most Common Occupations - Community and social service occupations (%)
Most Common Occupations - Legal occupations (%)
Most Common Occupations - Education, training, and library occupations (%)
Most Common Occupations - Arts, design, entertainment, sports, and media occupations (%)
Most Common Occupations - Healthcare practitioners and technical occupations (%)
Most Common Occupations - Health diagnosing and treating practitioners and other technical occupations (%)
Most Common Occupations - Health technologists and technicians (%)
Most Common Occupations - Service occupations (%)
Most Common Occupations - Healthcare support occupations (%)
Most Common Occupations - Protective service occupations (%)
Most Common Occupations - Fire fighting and prevention, and other protective service workers including supervisors (%)
Most Common Occupations - Law enforcement workers including supervisors (%)
Most Common Occupations - Food preparation and serving related occupations (%)
Most Common Occupations - Building and grounds cleaning and maintenance occupations (%)
Most Common Occupations - Personal care and service occupations (%)
Most Common Occupations - Sales and office occupations (%)
Most Common Occupations - Sales and related occupations (%)
Most Common Occupations - Office and administrative support occupations (%)
Most Common Occupations - Natural resources, construction, and maintenance occupations (%)
Most Common Occupations - Farming, fishing, and forestry occupations (%)
Most Common Occupations - Construction and extraction occupations (%)
Most Common Occupations - Installation, maintenance, and repair occupations (%)
Most Common Occupations - Production, transportation, and material moving occupations (%)
Most Common Occupations - Production occupations (%)
Most Common Occupations - Transportation occupations (%)
Most Common Occupations - Material moving occupations (%)
People in Group quarters - Institutionalized population (%)
People in Group quarters - Correctional institutions (%)
People in Group quarters - Federal prisons and detention centers (%)
People in Group quarters - Halfway houses (%)
People in Group quarters - Local jails and other confinement facilities (including police lockups) (%)
People in Group quarters - Military disciplinary barracks (%)
People in Group quarters - State prisons (%)
People in Group quarters - Other types of correctional institutions (%)
People in Group quarters - Nursing homes (%)
People in Group quarters - Hospitals/wards, hospices, and schools for the handicapped (%)
People in Group quarters - Hospitals/wards and hospices for chronically ill (%)
People in Group quarters - Hospices or homes for chronically ill (%)
People in Group quarters - Military hospitals or wards for chronically ill (%)
People in Group quarters - Other hospitals or wards for chronically ill (%)
People in Group quarters - Hospitals or wards for drug/alcohol abuse (%)
People in Group quarters - Mental (Psychiatric) hospitals or wards (%)
People in Group quarters - Schools, hospitals, or wards for the mentally retarded (%)
People in Group quarters - Schools, hospitals, or wards for the physically handicapped (%)
People in Group quarters - Institutions for the deaf (%)
People in Group quarters - Institutions for the blind (%)
People in Group quarters - Orthopedic wards and institutions for the physically handicapped (%)
People in Group quarters - Wards in general hospitals for patients who have no usual home elsewhere (%)
People in Group quarters - Wards in military hospitals for patients who have no usual home elsewhere (%)
People in Group quarters - Juvenile institutions (%)
People in Group quarters - Long-term care (%)
People in Group quarters - Homes for abused, dependent, and neglected children (%)
People in Group quarters - Residential treatment centers for emotionally disturbed children (%)
People in Group quarters - Training schools for juvenile delinquents (%)
People in Group quarters - Short-term care, detention or diagnostic centers for delinquent children (%)
People in Group quarters - Type of juvenile institution unknown (%)
People in Group quarters - Noninstitutionalized population (%)
People in Group quarters - College dormitories (includes college quarters off campus) (%)
People in Group quarters - Military quarters (%)
People in Group quarters - On base (%)
People in Group quarters - Barracks, unaccompanied personnel housing (UPH), (Enlisted/Officer), ;and similar group living quarters for military personnel (%)
People in Group quarters - Transient quarters for temporary residents (%)
People in Group quarters - Military ships (%)
People in Group quarters - Group homes (%)
People in Group quarters - Homes or halfway houses for drug/alcohol abuse (%)
People in Group quarters - Homes for the mentally ill (%)
People in Group quarters - Homes for the mentally retarded (%)
People in Group quarters - Homes for the physically handicapped (%)
People in Group quarters - Other group homes (%)
People in Group quarters - Religious group quarters (%)
People in Group quarters - Dormitories (%)
People in Group quarters - Agriculture workers' dormitories on farms (%)
People in Group quarters - Job Corps and vocational training facilities (%)
People in Group quarters - Other workers' dormitories (%)
People in Group quarters - Crews of maritime vessels (%)
People in Group quarters - Other nonhousehold living situations (%)
People in Group quarters - Other noninstitutional group quarters (%)
Residents speaking English at home (%)
Residents speaking English at home - Born in the United States (%)
Residents speaking English at home - Native, born elsewhere (%)
Residents speaking English at home - Foreign born (%)
Residents speaking Spanish at home (%)
Residents speaking Spanish at home - Born in the United States (%)
Residents speaking Spanish at home - Native, born elsewhere (%)
Residents speaking Spanish at home - Foreign born (%)
Residents speaking other language at home (%)
Residents speaking other language at home - Born in the United States (%)
Residents speaking other language at home - Native, born elsewhere (%)
Residents speaking other language at home - Foreign born (%)
Class of Workers - Employee of private company (%)
Class of Workers - Self-employed in own incorporated business (%)
Class of Workers - Private not-for-profit wage and salary workers (%)
Class of Workers - Local government workers (%)
Class of Workers - State government workers (%)
Class of Workers - Federal government workers (%)
Class of Workers - Self-employed workers in own not incorporated business and Unpaid family workers (%)
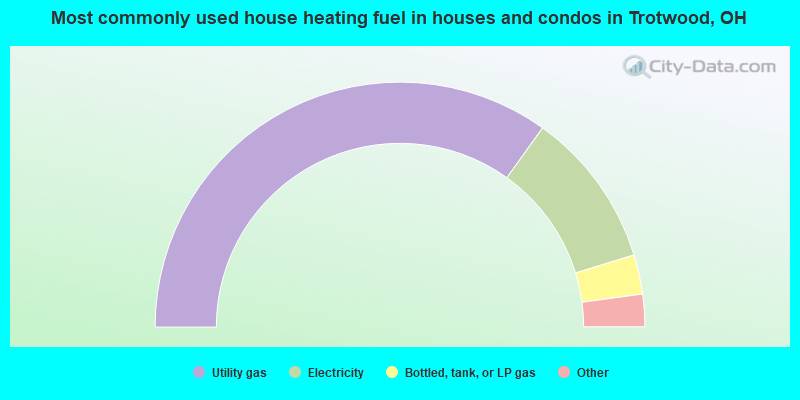
House heating fuel used in houses and condos - Utility gas (%)
House heating fuel used in houses and condos - Bottled, tank, or LP gas (%)
House heating fuel used in houses and condos - Electricity (%)
House heating fuel used in houses and condos - Fuel oil, kerosene, etc. (%)
House heating fuel used in houses and condos - Coal or coke (%)
House heating fuel used in houses and condos - Wood (%)
House heating fuel used in houses and condos - Solar energy (%)
House heating fuel used in houses and condos - Other fuel (%)
House heating fuel used in houses and condos - No fuel used (%)
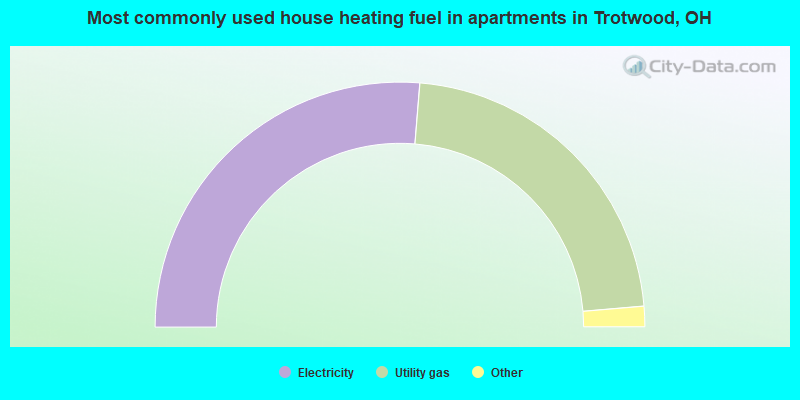
House heating fuel used in apartments - Utility gas (%)
House heating fuel used in apartments - Bottled, tank, or LP gas (%)
House heating fuel used in apartments - Electricity (%)
House heating fuel used in apartments - Fuel oil, kerosene, etc. (%)
House heating fuel used in apartments - Coal or coke (%)
House heating fuel used in apartments - Wood (%)
House heating fuel used in apartments - Solar energy (%)
House heating fuel used in apartments - Other fuel (%)
House heating fuel used in apartments - No fuel used (%)
Armed forces status - In Armed Forces (%)
Armed forces status - Civilian (%)
Armed forces status - Civilian - Veteran (%)
Armed forces status - Civilian - Nonveteran (%)
Fatal accidents locations in years 2005-2021
Fatal accidents locations in 2005
Fatal accidents locations in 2006
Fatal accidents locations in 2007
Fatal accidents locations in 2008
Fatal accidents locations in 2009
Fatal accidents locations in 2010
Fatal accidents locations in 2011
Fatal accidents locations in 2012
Fatal accidents locations in 2013
Fatal accidents locations in 2014
Fatal accidents locations in 2015
Fatal accidents locations in 2016
Fatal accidents locations in 2017
Fatal accidents locations in 2018
Fatal accidents locations in 2019
Fatal accidents locations in 2020
Fatal accidents locations in 2021
Alcohol use - People drinking some alcohol every month (%)
Alcohol use - People not drinking at all (%)
Alcohol use - Average days/month drinking alcohol
Alcohol use - Average drinks/week
Alcohol use - Average days/year people drink much
Audiometry - Average condition of hearing (%)
Audiometry - People that can hear a whisper from across a quiet room (%)
Audiometry - People that can hear normal voice from across a quiet room (%)
Audiometry - Ears ringing, roaring, buzzing (%)
Audiometry - Had a job exposure to loud noise (%)
Audiometry - Had off-work exposure to loud noise (%)
Blood Pressure & Cholesterol - Has high blood pressure (%)
Blood Pressure & Cholesterol - Checking blood pressure at home (%)
Blood Pressure & Cholesterol - Frequently checking blood cholesterol (%)
Blood Pressure & Cholesterol - Has high cholesterol level (%)
Consumer Behavior - Money monthly spent on food at supermarket/grocery store
Consumer Behavior - Money monthly spent on food at other stores
Consumer Behavior - Money monthly spent on eating out
Consumer Behavior - Money monthly spent on carryout/delivered foods
Consumer Behavior - Income spent on food at supermarket/grocery store (%)
Consumer Behavior - Income spent on food at other stores (%)
Consumer Behavior - Income spent on eating out (%)
Consumer Behavior - Income spent on carryout/delivered foods (%)
Current Health Status - General health condition (%)
Current Health Status - Blood donors (%)
Current Health Status - Has blood ever tested for HIV virus (%)
Current Health Status - Left-handed people (%)
Dermatology - People using sunscreen (%)
Diabetes - Diabetics (%)
Diabetes - Had a blood test for high blood sugar (%)
Diabetes - People taking insulin (%)
Diet Behavior & Nutrition - Diet health (%)
Diet Behavior & Nutrition - Milk product consumption (# of products/month)
Diet Behavior & Nutrition - Meals not home prepared (#/week)
Diet Behavior & Nutrition - Meals from fast food or pizza place (#/week)
Diet Behavior & Nutrition - Ready-to-eat foods (#/month)
Diet Behavior & Nutrition - Frozen meals/pizza (#/month)
Drug Use - People that ever used marijuana or hashish (%)
Drug Use - Ever used hard drugs (%)
Drug Use - Ever used any form of cocaine (%)
Drug Use - Ever used heroin (%)
Drug Use - Ever used methamphetamine (%)
Health Insurance - People covered by health insurance (%)
Kidney Conditions-Urology - Avg. # of times urinating at night
Medical Conditions - People with asthma (%)
Medical Conditions - People with anemia (%)
Medical Conditions - People with psoriasis (%)
Medical Conditions - People with overweight (%)
Medical Conditions - Elderly people having difficulties in thinking or remembering (%)
Medical Conditions - People who ever received blood transfusion (%)
Medical Conditions - People having trouble seeing even with glass/contacts (%)
Medical Conditions - People with arthritis (%)
Medical Conditions - People with gout (%)
Medical Conditions - People with congestive heart failure (%)
Medical Conditions - People with coronary heart disease (%)
Medical Conditions - People with angina pectoris (%)
Medical Conditions - People who ever had heart attack (%)
Medical Conditions - People who ever had stroke (%)
Medical Conditions - People with emphysema (%)
Medical Conditions - People with thyroid problem (%)
Medical Conditions - People with chronic bronchitis (%)
Medical Conditions - People with any liver condition (%)
Medical Conditions - People who ever had cancer or malignancy (%)
Mental Health - People who have little interest in doing things (%)
Mental Health - People feeling down, depressed, or hopeless (%)
Mental Health - People who have trouble sleeping or sleeping too much (%)
Mental Health - People feeling tired or having little energy (%)
Mental Health - People with poor appetite or overeating (%)
Mental Health - People feeling bad about themself (%)
Mental Health - People who have trouble concentrating on things (%)
Mental Health - People moving or speaking slowly or too fast (%)
Mental Health - People having thoughts they would be better off dead (%)
Oral Health - Average years since last visit a dentist
Oral Health - People embarrassed because of mouth (%)
Oral Health - People with gum disease (%)
Oral Health - General health of teeth and gums (%)
Oral Health - Average days a week using dental floss/device
Oral Health - Average days a week using mouthwash for dental problem
Oral Health - Average number of teeth
Pesticide Use - Households using pesticides to control insects (%)
Pesticide Use - Households using pesticides to kill weeds (%)
Physical Activity - People doing vigorous-intensity work activities (%)
Physical Activity - People doing moderate-intensity work activities (%)
Physical Activity - People walking or bicycling (%)
Physical Activity - People doing vigorous-intensity recreational activities (%)
Physical Activity - People doing moderate-intensity recreational activities (%)
Physical Activity - Average hours a day doing sedentary activities
Physical Activity - Average hours a day watching TV or videos
Physical Activity - Average hours a day using computer
Physical Functioning - People having limitations keeping them from working (%)
Physical Functioning - People limited in amount of work they can do (%)
Physical Functioning - People that need special equipment to walk (%)
Physical Functioning - People experiencing confusion/memory problems (%)
Physical Functioning - People requiring special healthcare equipment (%)
Prescription Medications - Average number of prescription medicines taking
Preventive Aspirin Use - Adults 40+ taking low-dose aspirin (%)
Reproductive Health - Vaginal deliveries (%)
Reproductive Health - Cesarean deliveries (%)
Reproductive Health - Deliveries resulted in a live birth (%)
Reproductive Health - Pregnancies resulted in a delivery (%)
Reproductive Health - Women breastfeeding newborns (%)
Reproductive Health - Women that had a hysterectomy (%)
Reproductive Health - Women that had both ovaries removed (%)
Reproductive Health - Women that have ever taken birth control pills (%)
Reproductive Health - Women taking birth control pills (%)
Reproductive Health - Women that have ever used Depo-Provera or injectables (%)
Reproductive Health - Women that have ever used female hormones (%)
Sexual Behavior - People 18+ that ever had sex (vaginal, anal, or oral) (%)
Sexual Behavior - Males 18+ that ever had vaginal sex with a woman (%)
Sexual Behavior - Males 18+ that ever performed oral sex on a woman (%)
Sexual Behavior - Males 18+ that ever had anal sex with a woman (%)
Sexual Behavior - Males 18+ that ever had any sex with a man (%)
Sexual Behavior - Females 18+ that ever had vaginal sex with a man (%)
Sexual Behavior - Females 18+ that ever performed oral sex on a man (%)
Sexual Behavior - Females 18+ that ever had anal sex with a man (%)
Sexual Behavior - Females 18+ that ever had any kind of sex with a woman (%)
Sexual Behavior - Average age people first had sex
Sexual Behavior - Average number of female sex partners in lifetime (males 18+)
Sexual Behavior - Average number of female vaginal sex partners in lifetime (males 18+)
Sexual Behavior - Average age people first performed oral sex on a woman (18+)
Sexual Behavior - Average number of woman performed oral sex on in lifetime (18+)
Sexual Behavior - Average number of male sex partners in lifetime (males 18+)
Sexual Behavior - Average number of male anal sex partners in lifetime (males 18+)
Sexual Behavior - Average age people first performed oral sex on a man (18+)
Sexual Behavior - Average number of male oral sex partners in lifetime (18+)
Sexual Behavior - People using protection when performing oral sex (%)
Sexual Behavior - Average number of times people have vaginal or anal sex a year
Sexual Behavior - People having sex without condom (%)
Sexual Behavior - Average number of male sex partners in lifetime (females 18+)
Sexual Behavior - Average number of male vaginal sex partners in lifetime (females 18+)
Sexual Behavior - Average number of female sex partners in lifetime (females 18+)
Sexual Behavior - Circumcised males 18+ (%)
Sleep Disorders - Average hours sleeping at night
Sleep Disorders - People that has trouble sleeping (%)
Smoking-Cigarette Use - People smoking cigarettes (%)
Taste & Smell - People 40+ having problems with smell (%)
Taste & Smell - People 40+ having problems with taste (%)
Taste & Smell - People 40+ that ever had wisdom teeth removed (%)
Taste & Smell - People 40+ that ever had tonsils teeth removed (%)
Taste & Smell - People 40+ that ever had a loss of consciousness because of a head injury (%)
Taste & Smell - People 40+ that ever had a broken nose or other serious injury to face or skull (%)
Taste & Smell - People 40+ that ever had two or more sinus infections (%)
Weight - Average height (inches)
Weight - Average weight (pounds)
Weight - Average BMI
Weight - People that are obese (%)
Weight - People that ever were obese (%)
Weight - People trying to lose weight (%)
According to our research of Ohio and other state lists, there were 9 registered sex offenders living in Trotwood, Ohio as of May 16, 2024 . The ratio of all residents to sex offenders in Trotwood is 2,700 to 1.The ratio of registered sex offenders to all residents in this city is much lower than the state average.
Officers per 1,000 residents here:
1.35Ohio average:
2.43
Latest news from Trotwood, OH collected exclusively by city-data.com from local newspapers, TV, and radio stations
Ancestries: German (4.9%), American (3.5%), African (3.1%), English (2.5%), Egyptian (1.3%).
Current Local Time:
Land area: 30.5 square miles.
Population density: 752 people per square mile (low).
777 residents are foreign born (1.9% Africa , 0.8% Europe , 0.3% Asia ).
Median real estate property taxes paid for housing units with mortgages in 2022: $2,014 (1.7%)Median real estate property taxes paid for housing units with no mortgage in 2022: $1,509 (1.9%)
Nearest city with pop. 50,000+: Dayton, OH
Nearest city with pop. 200,000+: Cincinnati, OH
Nearest city with pop. 1,000,000+: Chicago, IL
Nearest cities:
Latitude: 39.79 N, Longitude: 84.29 W
Daytime population change due to commuting: -5,326 (-23.1%)Workers who live and work in this city: 1,480 (15.1%)
Single-family new house construction building permits:
2016: 2 buildings , average cost: $254,1002015: 4 buildings , average cost: $112,0002014: 4 buildings , average cost: $112,0002013: 3 buildings , average cost: $112,0002012: 2 buildings , average cost: $112,0002011: 1 building , cost: $96,2002010: 1 building , cost: $130,0002009: 3 buildings , average cost: $223,3002008: 4 buildings , average cost: $233,8002007: 3 buildings , average cost: $343,7002006: 10 buildings , average cost: $155,8002005: 93 buildings , average cost: $108,0002004: 33 buildings , average cost: $106,7002003: 32 buildings , average cost: $98,7002002: 29 buildings , average cost: $94,4002001: 58 buildings , average cost: $92,3002000: 21 buildings , average cost: $106,0001999: 31 buildings , average cost: $143,9001998: 35 buildings , average cost: $114,0001997: 20 buildings , average cost: $102,500Unemployment in December 2023:
Most common occupations in Trotwood, OH (%)
Both Males Females
Assemblers and fabricators (5.4%)
Other production occupations, including supervisors (5.0%)
Other office and administrative support workers, including supervisors (4.8%)
Metal workers and plastic workers (4.7%)
Other management occupations, except farmers and farm managers (4.0%)
Building and grounds cleaning and maintenance occupations (3.5%)
Other sales and related occupations, including supervisors (3.2%)
Metal workers and plastic workers (9.0%)
Driver/sales workers and truck drivers (6.2%)
Other production occupations, including supervisors (6.2%)
Other management occupations, except farmers and farm managers (5.0%)
Building and grounds cleaning and maintenance occupations (5.0%)
Laborers and material movers, hand (4.8%)
Material recording, scheduling, dispatching, and distributing workers (4.8%)
Other office and administrative support workers, including supervisors (7.9%)
Assemblers and fabricators (6.5%)
Information and record clerks, except customer service representatives (4.9%)
Nursing, psychiatric, and home health aides (4.8%)
Preschool, kindergarten, elementary, and middle school teachers (4.6%)
Secretaries and administrative assistants (4.5%)
Customer service representatives (3.9%)
Tornado activity:
Trotwood-area historical tornado activity is slightly above Ohio state average. It is 64% greater than the overall U.S. average.
On 4/3/1974, a category F5 (max. wind speeds 261-318 mph) tornado 17.1 miles away from the Trotwood city center killed 36 people and injured 1150 people and caused between $50,000,000 and $500,000,000 in damages.
On 4/25/1961, a category F4 (max. wind speeds 207-260 mph) tornado 17.8 miles away from the city center injured 7 people and caused between $500,000 and $5,000,000 in damages.
Earthquake activity:
Trotwood-area historical earthquake activity is significantly above Ohio state average. It is 28% greater than the overall U.S. average. On 7/27/1980 at 18:52:21, a magnitude 5.2 (5.1 MB, 4.7 MS, 5.0 UK, 5.2 UK, Class: Moderate, Intensity: VI - VII) earthquake occurred 111.5 miles away from Trotwood center On 4/18/2008 at 09:36:59, a magnitude 5.4 (5.1 MB, 4.8 MS, 5.4 MW, 5.2 MW) earthquake occurred 214.1 miles away from Trotwood center On 7/12/1986 at 08:19:37, a magnitude 4.5 (4.5 MB, Class: Light, Intensity: IV - V) earthquake occurred 51.5 miles away from the city center On 4/18/2008 at 09:36:59, a magnitude 5.2 (5.2 MW, Depth: 8.9 mi) earthquake occurred 214.2 miles away from the city center On 6/10/1987 at 23:48:54, a magnitude 5.1 (4.9 MB, 4.4 MS, 4.6 MS, 5.1 LG) earthquake occurred 203.8 miles away from Trotwood center On 9/25/1998 at 19:52:52, a magnitude 5.2 (4.8 MB, 4.3 MS, 5.2 LG, 4.5 MW, Depth: 3.1 mi) earthquake occurred 235.6 miles away from the city center Magnitude types: regional Lg-wave magnitude (LG), body-wave magnitude (MB), surface-wave magnitude (MS), moment magnitude (MW) Natural disasters: The number of natural disasters in Montgomery County (9) is smaller than the US average (15).Major Disasters (Presidential) Declared: 4Emergencies Declared: 3Floods: 4, Storms: 3, Mudslides: 2, Winds: 2, Blizzard: 1, Heavy Rain: 1, Hurricane: 1, Landslide: 1, Snow: 1, Snowstorm: 1, Tornado: 1, Tropical Depression: 1, Winter Storm: 1, Other: 1 (Note: some incidents may be assigned to more than one category). Hospitals and medical centers in Trotwood: SHILOH SPRINGS CARE CENTER INC (3500 SHILOH SPRINGS ROAD)
Other hospitals and medical centers near Trotwood: FOUR SEASONS OF DAYTON NURSING AND REHABILITATION (Nursing Home, about 2 miles away; DAYTON, OH)
MARIA JOSEPH LIVING CARE CENTER (Nursing Home, about 2 miles away; DAYTON, OH)
ECHOING WOODS RESIDENTIAL CENTER (Hospital, about 3 miles away; DAYTON, OH)
CATALPA MANOR NURSING HOME (Nursing Home, about 3 miles away; DAYTON, OH)
NORTHWOOD NURSING AND REHABILITATION CENTER (Nursing Home, about 3 miles away; DAYTON, OH)
FRIENDSHIP VILLAGE (Nursing Home, about 3 miles away; DAYTON, OH)
GOOD SAMARITAN HOSPITAL (about 3 miles away; DAYTON, OH)
Colleges/universities with over 2000 students nearest to Trotwood:
Sinclair Community College (about 6 miles; Dayton, OH ; Full-time enrollment: 13,779)
University of Dayton (about 8 miles; Dayton, OH ; FT enrollment: 10,392)
Wright State University-Main Campus (about 12 miles; Dayton, OH ; FT enrollment: 14,482)
Fortis College-Centerville (about 13 miles; Centerville, OH ; FT enrollment: 4,527)
Central State University (about 23 miles; Wilberforce, OH ; FT enrollment: 2,094)
Edison State Community College (about 26 miles; Piqua, OH ; FT enrollment: 2,049)
Cedarville University (about 26 miles; Cedarville, OH ; FT enrollment: 3,396)
Public high school in Trotwood:
Public elementary/middle schools in Trotwood: TROTWOOD FITNESS & PREP ACAD Students: 313, Location: 3100 SHILOH SPRINGS RD, Grades: KG-8, Charter school )MADISON PARK ELEMENTARY Location: 301 S BROADWAY ST, Grades: 2-3)
TROTWOOD-MADISON EARLY LEARNING CENTER Location: 4400 N UNION RD, Grades: PK-1)
WESTBROOKE VILLAGE Location: 6500 WESTFORD RD, Grades: 2-5)
TROTWOOD-MADISON MIDDLE SCHOOL Location: 4420 N UNION RD, Grades: 6-8)
See full list of schools located in Trotwood
Notable locations in Trotwood: (A) , Trotwood Industrial Park (B) , Great Western Industrial Park (C) , Larch Tree Golf Course (D) , Sycamore Conservation and Education Farm (E) , Trotwood Fire Department Station 72 (F) , Trotwood Fire Department Station 73 (G) , Trotwood Fire Department Station 74 (H) , Precious Blood Childrens Home (I) . Display/hide their locations on the map
Shopping Centers: (1) , Kimco Shopping Center (2) , Salem Plaza Shopping Center (3) , Miracle Lane Shopping Center (4) , Salem Mall Shopping Center (5) , Trotwood Main Shopping Center (6) . Display/hide their locations on the map
Churches in Trotwood include: (A) , Grace Brethren Church of Trotwood (B) , Triumphant Cross Lutheran Church (C) , Precious Blood Convent (D) , Bethel Pentecostal Temple (E) , Trotwood United Church of Christ (F) , Trotwood Church of the Brethren (G) , Drexel Church of the Nazarene (H) , Union Church (I) . Display/hide their locations on the map
Cemeteries: (1) , Cedar Hill Cemetery (2) , Ehrstine Cemetery (3) , Turner Cemetery (4) , Dunker Church Cemetery (5) , Hay Cemetery (6) . Display/hide their locations on the map
Streams, rivers, and creeks: (A) , Dry Run (B) , Moss Creek (C) , Poplar Run (D) . Display/hide their locations on the map
Parks in Trotwood include: (1) , Madison Lakes Park (2) , Millhaven Park (3) , Salem Village Park (4) , John Wolfe Park (5) , Westbrooke Village Park (6) , North Broadway Park (7) , Trotwood Community Park (8) . Display/hide their locations on the map
Birthplace of: Chris Wright (basketball, born 1988) - Basketball player, Andre Hutson - Basketball player, Chris Scott - College basketball player (IUPUI Jaguars), Duane Butler - Player of and football.
Montgomery County has a predicted average indoor radon screening level greater than 4 pCi/L (pico curies per liter) - Highest Potential Average household size: This city:
2.3 peopleOhio:
2.4 people
Percentage of family households: This city:
61.6%Whole state:
65.0%
Percentage of households with unmarried partners: This city:
6.0%Whole state:
6.8%
Likely homosexual households (counted as self-reported same-sex unmarried-partner households)
Lesbian couples: 0.3% of all households Gay men: 0.2% of all households
People in group quarters in Trotwood in 2010:
550 people in nursing facilities/skilled-nursing facilities
56 people in other noninstitutional facilities
45 people in group homes intended for adults
People in group quarters in Trotwood in 2000:
582 people in nursing homes
86 people in religious group quarters
36 people in schools, hospitals, or wards for the intellectually disabled
13 people in homes for the mentally retarded
6 people in homes for the mentally ill
Banks with branches in Trotwood (2011 data):
Fifth Third Bank: Salem Mall Banking Center Branch at 2250 Shiloh Springs Road, branch established on 1986/02/13; Trotwood Branch at 1 East Main Street, branch established on 1907/01/01. Info updated 2009/10/05: Bank assets: $114,540.4 mil, Deposits: $89,689.1 mil, headquarters in Cincinnati, OH, positive income , Commercial Lending Specialization, 1378 total offices , Holding Company: Fifth Third Bancorp
KeyBank National Association: Trotwood Branch at 3031 Shiloh Springs Road, branch established on 1974/11/25. Info updated 2008/03/03: Bank assets: $86,198.8 mil, Deposits: $64,214.8 mil, headquarters in Cleveland, OH, positive income , Commercial Lending Specialization, 1067 total offices , Holding Company: Keycorp
For population 15 years and over in Trotwood:
Never married: 39.1%Now married: 35.0%Separated: 2.3%Widowed: 8.4%Divorced: 15.1% For population 25 years and over in Trotwood:
High school or higher: 90.6%Bachelor's degree or higher: 18.3%Graduate or professional degree: 7.7%Unemployed: 6.3%Mean travel time to work (commute): 22.2 minutes
Education Gini index (Inequality in education) Here:
10.0Ohio average:
11.0
Religion statistics for Trotwood, OH (based on Montgomery County data)
Religion Adherents Congregations Evangelical Protestant 93,334 306 Catholic 78,909 34 Mainline Protestant 47,961 143 Black Protestant 21,263 56 Other 14,123 41 Orthodox 4,205 3 None 275,358 -
Source: Clifford Grammich, Kirk Hadaway, Richard Houseal, Dale E.Jones, Alexei Krindatch, Richie Stanley and Richard H.Taylor. 2012. 2010 U.S.Religion Census: Religious Congregations & Membership Study. Association of Statisticians of American Religious Bodies. Jones, Dale E., et al. 2002. Congregations and Membership in the United States 2000. Nashville, TN: Glenmary Research Center. Graphs represent county-level data
Food Environment Statistics: Number of grocery stores : 82Montgomery County :
1.52 / 10,000 pop.Ohio :
1.89 / 10,000 pop.
Number of supercenters and club stores : 8This county :
0.15 / 10,000 pop.Ohio :
0.13 / 10,000 pop.
Number of convenience stores (no gas) : 75Montgomery County :
1.39 / 10,000 pop.Ohio :
1.25 / 10,000 pop.
Number of convenience stores (with gas) : 124Montgomery County :
2.31 / 10,000 pop.State :
2.93 / 10,000 pop.
Number of full-service restaurants : 310Montgomery County :
5.76 / 10,000 pop.Ohio :
6.25 / 10,000 pop.
Adult diabetes rate : Montgomery County :
11.0%Ohio :
10.3%
Adult obesity rate : This county :
30.5%Ohio :
29.1%
Low-income preschool obesity rate : Health and Nutrition: Healthy diet rate : This city:
48.4%Ohio:
50.4%
Average overall health of teeth and gums : People feeling badly about themselves : People not drinking alcohol at all : Average hours sleeping at night : General health condition : Average condition of hearing : More about Health and Nutrition of Trotwood, OH Residents
Local government employment and payroll (March 2022)
Function
Full-time employees
Monthly full-time payroll
Average yearly full-time wage
Part-time employees
Monthly part-time payroll
Police Protection - Officers
36 $213,889 $71,296 0 $0 Firefighters
30 $177,295 $70,918 28 $34,481 Streets and Highways
10 $56,696 $68,035 0 $0 Financial Administration
9 $44,830 $59,773 2 $2,931 Other and Unallocable
5 $21,597 $51,833 0 $0 Other Government Administration
4 $32,715 $98,145 2 $4,434 Police - Other
3 $11,605 $46,420 2 $3,485 Fire - Other
3 $21,519 $86,076 0 $0 Sewerage
1 $4,629 $55,548 0 $0 Water Supply
1 $4,629 $55,548 0 $0 Parks and Recreation
1 $4,119 $49,428 0 $0 Housing and Community Development (Local)
1 $3,970 $47,640 1 $1,049
Totals for Government
104 $597,493 $68,942 35 $46,380
Trotwood government finances - Expenditure in 2018 (per resident):
Construction - Parks and Recreation: $536,000 ($23.35)
Local Fire Protection: $295,000 ($12.85)Regular Highways: $88,000 ($3.83)Sewerage: $45,000 ($1.96)General Public Buildings: $9,000 ($0.39)Current Operations - Police Protection: $3,510,000 ($152.88)
Local Fire Protection: $3,292,000 ($143.39)Central Staff Services: $2,060,000 ($89.73)Sewerage: $1,587,000 ($69.12)Solid Waste Management: $1,332,000 ($58.02)Water Utilities: $1,281,000 ($55.80)Regular Highways: $1,214,000 ($52.88)General - Other: $1,039,000 ($45.25)Financial Administration: $924,000 ($40.25)Parks and Recreation: $276,000 ($12.02)General Public Buildings: $238,000 ($10.37)Judicial and Legal Services: $172,000 ($7.49)Protective Inspection and Regulation - Other: $83,000 ($3.62)Miscellaneous Commercial Activities - Other: $29,000 ($1.26)General - Interest on Debt: $578,000 ($25.18)
Other Capital Outlay - Local Fire Protection: $200,000 ($8.71)
Water Utilities: $178,000 ($7.75)Central Staff Services: $116,000 ($5.05)Parks and Recreation: $81,000 ($3.53)Regular Highways: $81,000 ($3.53)Police Protection: $15,000 ($0.65)Total Salaries and Wages: $6,141,000 ($267.48)
Water Utilities - Interest on Debt: $21,000 ($0.91)
Trotwood government finances - Revenue in 2018 (per resident):
Charges - Sewerage: $2,061,000 ($89.77)
Solid Waste Management: $1,412,000 ($61.50)Other: $1,408,000 ($61.33)Miscellaneous Commercial Activities: $35,000 ($1.52)Parks and Recreation: $4,000 ($0.17)Local Intergovernmental - Housing and Community Development: $265,000 ($11.54)
General Local Government Support: $259,000 ($11.28)Highways: $152,000 ($6.62)Miscellaneous - Special Assessments: $140,000 ($6.10)
General Revenue - Other: $114,000 ($4.97)Fines and Forfeits: $63,000 ($2.74)Interest Earnings: $47,000 ($2.05)Rents: $41,000 ($1.79)Sale of Property: $37,000 ($1.61)Donations From Private Sources: $2,000 ($0.09)Revenue - Water Utilities: $1,785,000 ($77.75)
State Intergovernmental - Highways: $1,722,000 ($75.00)
Housing and Community Development: $240,000 ($10.45)Other: $38,000 ($1.66)General Local Government Support: $6,000 ($0.26)Tax - Property: $5,575,000 ($242.82)
Individual Income: $3,744,000 ($163.07)Corporation Net Income: $1,159,000 ($50.48)Public Utilities Sales: $317,000 ($13.81)Motor Vehicle License: $166,000 ($7.23)Occupation and Business License - Other: $21,000 ($0.91)Alcoholic Beverage License: $11,000 ($0.48)Death and Gift: $2,000 ($0.09)Tobacco Products Sales: $1,000 ($0.04)
Trotwood government finances - Debt in 2018 (per resident):
Long Term Debt - Beginning Outstanding - Unspecified Public Purpose: $15,806,000 ($688.44)
Beginning Outstanding - Public Debt for Private Purpose: $15,806,000 ($688.44)Outstanding Nonguaranteed - Industrial Revenue: $15,766,000 ($686.70)Outstanding Unspecified Public Purpose: $15,766,000 ($686.70)Retired Nonguaranteed - Public Debt for Private Purpose: $811,000 ($35.32)Retired Unspecified Public Purpose: $811,000 ($35.32)Issue, Nonguaranteed - Public Debt for Private Purpose: $770,000 ($33.54)Issue, Unspecified Public Purpose: $770,000 ($33.54)
Trotwood government finances - Cash and Securities in 2018 (per resident):
Other Funds - Cash and Securities: $13,328,000 ($580.51)
Sinking Funds - Cash and Securities: $15,766,000 ($686.70)
5.90% of this county's 2021 resident taxpayers lived in other counties in 2020 ($51,044 average adjusted gross income )
Here:
5.90%Ohio average:
5.68%
0.06% of residents moved from foreign countries ($588 average AGI )Montgomery County:
0.06%Ohio average:
0.01%
Top counties from which taxpayers relocated into this county between 2020 and 2021:
6.00% of this county's 2020 resident taxpayers moved to other counties in 2021 ($58,304 average adjusted gross income )
Here:
6.00%Ohio average:
5.79%
0.04% of residents moved to foreign countries ($390 average AGI )Montgomery County:
0.04%Ohio average:
0.01%
Top counties to which taxpayers relocated from this county between 2020 and 2021:
Businesses in Trotwood, OH
Name Count Name Count
AT&T 1 McDonald's 1 AutoZone 1 Pizza Hut 1 Burger King 1 Target 1 CVS 1 The Athlete's Foot 1 H&R Block 2 U-Haul 1 KFC 1 Walgreens 1 Kmart 1 White Castle 1 Little Caesars Pizza 1 YMCA 1 Lowe's 1
Strongest AM radio stations in Trotwood:
WLW (700 AM; 50 kW; CINCINNATI, OH; Owner: JACOR BROADCASTING CORPORATION)
WONE (980 AM; 5 kW; DAYTON, OH; Owner: CITICASTERS LICENSES, L.P.)
WING (1410 AM; 5 kW; DAYTON, OH)
WHIO (1290 AM; 5 kW; DAYTON, OH; Owner: CXR HOLDINGS, INC.)
WDAO (1210 AM; daytime; 1 kW; DAYTON, OH; Owner: JOHNSON COMMUNICATIONS, INC.)
WTVN (610 AM; 50 kW; COLUMBUS, OH; Owner: CITICASTERS LICENSES, L.P.)
WSAI (1530 AM; 50 kW; CINCINNATI, OH; Owner: JACOR BROADCASTING CORPORATION)
WGNZ (1110 AM; daytime; 2 kW; FAIRBORN, OH; Owner: L&D BROADCASTORS INC.)
WRFD (880 AM; daytime; 23 kW; COLUMBUS-WORTHINGTON, OH; Owner: SALEM MEDIA OF OHIO, INC.)
WOWO (1190 AM; 50 kW; FORT WAYNE, IN; Owner: PATHFINDER COMMUNICATIONS CORPORATION)
WHAS (840 AM; 50 kW; LOUISVILLE, KY; Owner: CLEAR CHANNEL BROADCASTING LICENSES, INC.)
WIBC (1070 AM; 50 kW; INDIANAPOLIS, IN; Owner: EMMIS RADIO LICENSE CORPORATION)
WCNW (1560 AM; daytime; 5 kW; FAIRFIELD, OH)
Strongest FM radio stations in Trotwood:
WHKO (99.1 FM; DAYTON, OH; Owner: CXR HOLDINGS, INC.)
WRNB (92.1 FM; WEST CARROLLTON, OH; Owner: RADIO ONE OF DAYTON LICENSES, LLC)
WLQT (99.9 FM; KETTERING, OH; Owner: CITICASTERS LICENSES, L.P.)
WMMX (107.7 FM; DAYTON, OH; Owner: CITICASTERS LICENSES, L.P.)
WTUE (104.7 FM; DAYTON, OH; Owner: CITICASTERS LICENSES, L.P.)
WGTZ (92.9 FM; EATON, OH; Owner: BLUE CHIP BROADCASTING LICENSES, LTD)
WXEG (103.9 FM; BEAVERCREEK, OH; Owner: CITICASTERS LICENSES, L.P.)
WDPR (88.1 FM; WEST CARROLLTON, OH; Owner: DAYTON PUBLIC RADIO, INC.)
WFCJ (93.7 FM; MIAMISBURG, OH; Owner: MIAMI VALLEY CHRISTIAN BROADCASTING ASSOCIATION)
WDKF (94.5 FM; ENGLEWOOD, OH; Owner: CITICASTERS LICENSES, L.P.)
WDPS (89.5 FM; DAYTON, OH; Owner: DAYTON CITY SCHOOLS)
WQRP (89.5 FM; DAYTON, OH; Owner: WQRP FAMILY RADIO, INC.)
WPFB-FM (105.9 FM; MIDDLETOWN, OH; Owner: RADIO STATIONS WPAY/WPFB, INC.)
WMOJ (94.9 FM; FAIRFIELD, OH; Owner: WVAE LICO, INC.)
WYGY (96.5 FM; LEBANON, OH; Owner: WVAE LICO, INC.)
WRVT (88.7 FM; RUTLAND, VT; Owner: VERMONT PUBLIC RADIO)
WOKL (96.9 FM; TROY, OH; Owner: EDUCATIONAL MEDIA FOUNDATION)
WWSU (106.9 FM; FAIRBORN, OH; Owner: WRIGHT STATE UNIVERSITY)
WGRR (103.5 FM; HAMILTON, OH; Owner: INFINITY RADIO OPERATIONS INC.)
WDHT (102.9 FM; SPRINGFIELD, OH; Owner: BLUE CHIP BROADCASTING LICENSES, LTD)
TV broadcast stations around Trotwood:
WHIO-TV (Channel 7; DAYTON, OH; Owner: WHIO-TV HOLDINGS, INC.)
WDTN (Channel 2; DAYTON, OH; Owner: WDTN BROADCASTING, LLC)
WKEF (Channel 22; DAYTON, OH; Owner: WKEF LICENSEE L.P.)
WRGT-TV (Channel 45; DAYTON, OH; Owner: WRGT LICENSEE, LLC)
WPTD (Channel 16; DAYTON, OH; Owner: GREATER DAYTON PUBLIC TV, INC.)
W61DE (Channel 61; CINCINNATI, OH; Owner: TRINITY BROADCASTING NETWORK)
WRCX-LP (Channel 51; DAYTON, OH; Owner: ROSS COMMUNICATIONS, LTD.)
WBDT (Channel 26; SPRINGFIELD, OH; Owner: ACME TV LICENSES OF OHIO, LLC)
WWRD-LP (Channel 55; CENTERVILLE, OH; Owner: LIFE BROADCASTING NETWORK)
WKOI (Channel 43; RICHMOND, IN; Owner: TRINITY BROADCASTING OF INDIANA, INC.)
WPTO (Channel 14; OXFORD, OH; Owner: GREATER DAYTON PUBLIC TELEVISION, INC.)
W47BC (Channel 47; SPRINGFIELD, OH; Owner: TRINITY BROADCASTING NETWORK)
W66AQ (Channel 66; DAYTON, OH; Owner: WSTR LICENSEE, INC.)
National Bridge Inventory (NBI) Statistics 49 Number of bridges322ft / 97.5m Total length173,659 Total average daily traffic8,519 Total average daily truck traffic244,040 Total future (year 2020) average daily traffic
New bridges - historical statistics
3 1900-1909 1 1930-1939 1 1940-1949 2 1950-1959 11 1960-1969 6 1970-1979 7 1980-1989 11 1990-1999 4 2000-2009 3 2010-2019
See full National Bridge Inventory statistics for Trotwood, OH
FCC Registered Cell Phone Towers: 1 (
See the full list of FCC Registered Cell Phone Towers in Trotwood )
FCC Registered Antenna Towers: 50 (
See the full list of FCC Registered Antenna Towers )
FCC Registered Broadcast Land Mobile Towers: 13 (
See the full list of FCC Registered Broadcast Land Mobile Towers in Trotwood, OH )
FCC Registered Microwave Towers: 7
TROTWOOD, 2486 Union Road (Lat: 39.783056 Lon: -84.309444), Type: Tower, Structure height: 56.4 m, Overall height: 57.6 m, Call Sign: WQIK887, Assigned Frequencies: 11605.0 MHz, 11525.0 MHz, Grant Date: 03/06/2008, Expiration Date: 03/06/2018, Cancellation Date: 09/06/2009, Certifier: William Chastain, Registrant: Radio Dynamics Corporation, Silver Spring, MD 20914, Phone: (301) 493-5171, Fax: (301) 576-4553, Email:
URBANE, 5191 Shiloh Springs Rd (Stc320-Oh) (Lat: 39.819944 Lon: -84.332000), Type: Mtower, Structure height: 57.9 m, Overall height: 59.4 m, Call Sign: WREN590, Assigned Frequencies: 19460.0 MHz, Grant Date: 11/13/2019, Expiration Date: 11/13/2029, Cancellation Date: 06/02/2023, Certifier: Laurie Gebhardt, Registrant: Verizon Wireless LLC, 5055 North Point Pkwy, Np2ne Networ, Alpharetta, GA 30022, Phone: (770) 797-1070, Email:
CI16103A, Access Road Off Brookston Rd (Lat: 39.807000 Lon: -84.329000), Type: Mtower, Structure height: 57.9 m, Call Sign: WRUD687, Assigned Frequencies: 17980.0 MHz, 18060.0 MHz, 17980.0 MHz, 18060.0 MHz, 17980.0 MHz, 18060.0 MHz, 17980.0 MHz, 18060.0 MHz, 17980.0 MHz, 18060.0 MHz... (+12 more), Grant Date: 08/16/2022, Expiration Date: 08/16/2032, Cancellation Date: 02/12/2024, Certifier: Jenny Knopf, Registrant: T-Mobile Usa, Inc., 12920 Se 38th Street, Bellevue, WA 98006, Phone: (425) 383-8401, Email:
CI16031A, Trotwood Main Shopping Center (Lat: 39.795389 Lon: -84.296611), Type: Mtower, Structure height: 53.3 m, Call Sign: WRUD724, Assigned Frequencies: 19540.0 MHz, 19620.0 MHz, 19540.0 MHz, 19620.0 MHz, 19540.0 MHz, 19620.0 MHz, 19540.0 MHz, 19620.0 MHz, 19540.0 MHz, 19620.0 MHz... (+12 more), Grant Date: 08/16/2022, Expiration Date: 08/16/2032, Cancellation Date: 02/12/2024, Certifier: Jenny Knopf, Registrant: T-Mobile Usa, Inc., 12920 Se 38th Street, Bellevue, WA 98006, Phone: (425) 383-8401, Email:
CVCMH00340A, 5315 Olive Rd (Lat: 39.823389 Lon: -84.295417), Type: Mtower, Structure height: 57.2 m, Overall height: 58.4 m, Call Sign: WRWY469, Assigned Frequencies: 18115.0 MHz, 18115.0 MHz, 18115.0 MHz, 18115.0 MHz, 18115.0 MHz, 18115.0 MHz, 18115.0 MHz, 18115.0 MHz, 18115.0 MHz, 18115.0 MHz, 18115.0 MHz, 18115.0 MHz, Grant Date: 04/11/2023, Expiration Date: 04/11/2033, Certifier: Alison A Minea, Registrant: Dish Wireless L.L.C., 9601 S Meridan Blvd, Englewood, CO 80112, Phone: (202) 463-3709, Email:
CVCMH00573A, 5191 Shiloh Springs Rd (Stc320-Oh) (Lat: 39.819944 Lon: -84.332000), Type: Mtower, Structure height: 57.9 m, Overall height: 59.4 m, Call Sign: WRWY678, Assigned Frequencies: 19675.0 MHz, 19675.0 MHz, 19675.0 MHz, 19675.0 MHz, 19675.0 MHz, 19675.0 MHz, 19675.0 MHz, 19675.0 MHz, 19675.0 MHz, 19675.0 MHz, 19675.0 MHz, 19675.0 MHz, Grant Date: 04/12/2023, Expiration Date: 04/12/2033, Certifier: Alison A Minea, Registrant: Dish Wireless L.L.C., 9601 S Meridan Blvd, Englewood, CO 80112, Phone: (202) 463-3709, Email:
POST TOWN, N Side Of Post Town Rd (Lat: 39.782556 Lon: -84.308833), Type: Tower, Structure height: 76.2 m, Overall height: 79.2 m, Call Sign: WHC511, Assigned Frequencies: 6655.00 MHz, 6675.00 MHz, 6605.00 MHz, 6004.50 MHz, 5945.20 MHz, 5945.20 MHz, 6004.50 MHz, 6034.15 MHz, 6093.45 MHz, Grant Date: 07/18/2018, Expiration Date: 07/27/2028, Registrant: Dayton Power & Light, 1900 Dryden Rd, Dayton, OH 45439, Phone: (937) 331-4441, Email:
FCC Registered Amateur Radio Licenses: 37 (
See the full list of FCC Registered Amateur Radio Licenses in Trotwood )
FAA Registered Aircraft: 9 (
See the full list of FAA Registered Aircraft in Trotwood )
Home Mortgage Disclosure Act Aggregated Statistics For Year 2009(Based on 6 full and 4 partial tracts) A) FHA, FSA/RHS & VA B) Conventional C) Refinancings D) Home Improvement Loans F) Non-occupant Loans on G) Loans On Manufactured Number Average Value Number Average Value Number Average Value Number Average Value Number Average Value Number Average Value
LOANS ORIGINATED 81 $74,718 34 $60,687 143 $95,487 26 $11,583 18 $55,455 0 $0 APPLICATIONS APPROVED, NOT ACCEPTED 4 $80,970 6 $50,493 32 $92,403 4 $27,358 6 $45,585 0 $0 APPLICATIONS DENIED 27 $75,423 12 $66,891 175 $90,448 33 $11,918 23 $55,220 3 $24,657 APPLICATIONS WITHDRAWN 11 $69,298 4 $45,052 52 $99,727 4 $46,292 4 $46,632 0 $0 FILES CLOSED FOR INCOMPLETENESS 2 $93,825 1 $39,950 9 $73,872 0 $0 2 $51,080 0 $0
Aggregated Statistics For Year 2008(Based on 6 full and 4 partial tracts) A) FHA, FSA/RHS & VA B) Conventional C) Refinancings D) Home Improvement Loans E) Loans on Dwellings For 5+ Families F) Non-occupant Loans on G) Loans On Manufactured Number Average Value Number Average Value Number Average Value Number Average Value Number Average Value Number Average Value Number Average Value
LOANS ORIGINATED 73 $83,659 60 $65,583 188 $89,065 24 $18,101 1 $6,050,490 53 $68,681 1 $45,950 APPLICATIONS APPROVED, NOT ACCEPTED 9 $77,559 3 $14,730 42 $89,953 10 $23,937 0 $0 9 $70,071 0 $0 APPLICATIONS DENIED 39 $77,063 39 $79,875 299 $90,589 53 $29,608 0 $0 46 $68,139 1 $145,000 APPLICATIONS WITHDRAWN 14 $86,726 7 $84,311 102 $99,326 7 $53,703 0 $0 7 $68,544 1 $44,030 FILES CLOSED FOR INCOMPLETENESS 4 $64,388 5 $92,056 24 $97,898 6 $36,262 0 $0 7 $75,793 0 $0
Aggregated Statistics For Year 2007(Based on 6 full and 4 partial tracts) A) FHA, FSA/RHS & VA B) Conventional C) Refinancings D) Home Improvement Loans E) Loans on Dwellings For 5+ Families F) Non-occupant Loans on G) Loans On Manufactured Number Average Value Number Average Value Number Average Value Number Average Value Number Average Value Number Average Value Number Average Value
LOANS ORIGINATED 54 $103,711 204 $73,719 240 $86,974 56 $33,689 1 $127,130 87 $60,873 1 $61,560 APPLICATIONS APPROVED, NOT ACCEPTED 1 $66,290 31 $92,060 87 $90,755 17 $27,776 0 $0 13 $64,660 2 $125,870 APPLICATIONS DENIED 28 $94,160 111 $80,804 471 $93,152 120 $43,244 0 $0 90 $65,048 1 $62,200 APPLICATIONS WITHDRAWN 8 $83,231 27 $85,519 135 $96,617 24 $45,255 0 $0 17 $68,074 0 $0 FILES CLOSED FOR INCOMPLETENESS 3 $83,243 16 $77,254 49 $104,178 5 $46,622 0 $0 13 $65,439 0 $0
Aggregated Statistics For Year 2006(Based on 6 full and 4 partial tracts) A) FHA, FSA/RHS & VA B) Conventional C) Refinancings D) Home Improvement Loans E) Loans on Dwellings For 5+ Families F) Non-occupant Loans on G) Loans On Manufactured Number Average Value Number Average Value Number Average Value Number Average Value Number Average Value Number Average Value Number Average Value
LOANS ORIGINATED 68 $101,000 262 $75,001 374 $79,291 73 $34,811 5 $1,964,914 121 $57,230 3 $53,283 APPLICATIONS APPROVED, NOT ACCEPTED 4 $116,348 52 $77,815 123 $85,327 23 $26,354 1 $8,000 21 $63,674 1 $130,180 APPLICATIONS DENIED 14 $84,014 132 $78,570 601 $90,844 124 $35,765 0 $0 92 $63,992 3 $48,197 APPLICATIONS WITHDRAWN 7 $119,761 51 $80,336 268 $92,188 18 $33,656 0 $0 24 $77,257 0 $0 FILES CLOSED FOR INCOMPLETENESS 4 $91,548 15 $89,925 65 $98,631 2 $43,995 0 $0 3 $85,627 0 $0
Aggregated Statistics For Year 2005(Based on 6 full and 4 partial tracts) A) FHA, FSA/RHS & VA B) Conventional C) Refinancings D) Home Improvement Loans E) Loans on Dwellings For 5+ Families F) Non-occupant Loans on G) Loans On Manufactured Number Average Value Number Average Value Number Average Value Number Average Value Number Average Value Number Average Value Number Average Value
LOANS ORIGINATED 58 $107,520 325 $81,474 485 $82,655 57 $35,768 1 $563,000 110 $58,482 3 $33,403 APPLICATIONS APPROVED, NOT ACCEPTED 10 $119,951 90 $71,722 159 $86,820 16 $42,875 0 $0 21 $57,573 1 $55,390 APPLICATIONS DENIED 18 $102,989 152 $82,395 715 $94,686 140 $39,876 1 $35,000 55 $71,781 7 $47,377 APPLICATIONS WITHDRAWN 4 $80,915 68 $92,122 327 $105,540 39 $117,947 1 $54,000 32 $85,368 2 $36,450 FILES CLOSED FOR INCOMPLETENESS 3 $107,503 17 $73,195 61 $101,125 2 $70,435 0 $0 7 $74,390 0 $0
Aggregated Statistics For Year 2004(Based on 6 full and 4 partial tracts) A) FHA, FSA/RHS & VA B) Conventional C) Refinancings D) Home Improvement Loans E) Loans on Dwellings For 5+ Families F) Non-occupant Loans on G) Loans On Manufactured Number Average Value Number Average Value Number Average Value Number Average Value Number Average Value Number Average Value Number Average Value
LOANS ORIGINATED 66 $97,284 283 $78,929 607 $82,237 69 $37,451 2 $288,475 132 $66,638 2 $37,535 APPLICATIONS APPROVED, NOT ACCEPTED 12 $99,405 91 $73,642 229 $87,452 20 $30,350 0 $0 30 $57,717 1 $83,530 APPLICATIONS DENIED 23 $104,580 107 $88,194 720 $88,809 132 $35,248 0 $0 51 $115,305 2 $72,425 APPLICATIONS WITHDRAWN 7 $86,490 43 $86,816 376 $90,210 28 $57,581 0 $0 24 $77,565 0 $0 FILES CLOSED FOR INCOMPLETENESS 6 $111,945 5 $67,744 53 $93,468 2 $29,035 0 $0 4 $55,538 0 $0
Aggregated Statistics For Year 2003(Based on 6 full and 4 partial tracts) A) FHA, FSA/RHS & VA B) Conventional C) Refinancings D) Home Improvement Loans E) Loans on Dwellings For 5+ Families F) Non-occupant Loans on Number Average Value Number Average Value Number Average Value Number Average Value Number Average Value Number Average Value
LOANS ORIGINATED 82 $95,311 205 $81,285 948 $83,113 62 $19,329 2 $269,000 116 $67,786 APPLICATIONS APPROVED, NOT ACCEPTED 7 $71,967 47 $85,787 238 $82,799 15 $25,892 1 $576,000 14 $54,868 APPLICATIONS DENIED 24 $88,540 87 $81,940 698 $84,975 92 $19,398 1 $514,000 37 $51,571 APPLICATIONS WITHDRAWN 2 $106,410 38 $90,119 377 $90,741 18 $24,284 0 $0 17 $60,124 FILES CLOSED FOR INCOMPLETENESS 5 $102,716 12 $98,014 90 $95,752 2 $12,040 0 $0 4 $77,530
Aggregated Statistics For Year 2002(Based on 6 full and 4 partial tracts) A) FHA, FSA/RHS & VA B) Conventional C) Refinancings D) Home Improvement Loans E) Loans on Dwellings For 5+ Families F) Non-occupant Loans on Number Average Value Number Average Value Number Average Value Number Average Value Number Average Value Number Average Value
LOANS ORIGINATED 101 $91,292 204 $80,663 620 $79,036 65 $14,063 1 $331,380 83 $65,512 APPLICATIONS APPROVED, NOT ACCEPTED 7 $100,394 50 $73,749 223 $78,226 20 $15,220 1 $584,000 18 $61,648 APPLICATIONS DENIED 27 $92,039 84 $69,556 670 $80,052 115 $14,078 1 $311,600 38 $49,822 APPLICATIONS WITHDRAWN 8 $114,351 29 $82,607 386 $93,405 13 $36,448 0 $0 8 $57,425 FILES CLOSED FOR INCOMPLETENESS 0 $0 23 $81,633 81 $95,550 2 $44,000 0 $0 4 $60,650
Aggregated Statistics For Year 2001(Based on 6 full and 4 partial tracts) A) FHA, FSA/RHS & VA B) Conventional C) Refinancings D) Home Improvement Loans E) Loans on Dwellings For 5+ Families F) Non-occupant Loans on Number Average Value Number Average Value Number Average Value Number Average Value Number Average Value Number Average Value
LOANS ORIGINATED 143 $92,003 167 $79,814 660 $78,045 111 $15,367 0 $0 78 $64,141 APPLICATIONS APPROVED, NOT ACCEPTED 10 $86,568 36 $69,375 248 $72,296 35 $14,980 0 $0 21 $57,593 APPLICATIONS DENIED 14 $80,101 98 $71,805 712 $77,866 165 $14,086 1 $600,000 50 $51,495 APPLICATIONS WITHDRAWN 10 $100,707 44 $86,844 372 $82,807 20 $25,170 0 $0 12 $55,052 FILES CLOSED FOR INCOMPLETENESS 4 $80,540 10 $73,400 78 $83,274 1 $11,990 0 $0 9 $52,347
Aggregated Statistics For Year 2000(Based on 6 full and 4 partial tracts) A) FHA, FSA/RHS & VA B) Conventional C) Refinancings D) Home Improvement Loans F) Non-occupant Loans on Number Average Value Number Average Value Number Average Value Number Average Value Number Average Value
LOANS ORIGINATED 112 $86,913 268 $71,172 414 $70,656 147 $13,570 55 $56,678 APPLICATIONS APPROVED, NOT ACCEPTED 11 $81,080 47 $80,334 201 $73,102 74 $15,467 15 $38,869 APPLICATIONS DENIED 18 $81,476 143 $65,323 600 $71,001 232 $13,737 41 $55,854 APPLICATIONS WITHDRAWN 13 $74,375 48 $82,904 243 $66,611 14 $28,502 5 $51,966 FILES CLOSED FOR INCOMPLETENESS 4 $67,305 15 $55,133 71 $77,032 2 $41,080 7 $47,100
Aggregated Statistics For Year 1999(Based on 6 full and 4 partial tracts) A) FHA, FSA/RHS & VA B) Conventional C) Refinancings D) Home Improvement Loans E) Loans on Dwellings For 5+ Families F) Non-occupant Loans on Number Average Value Number Average Value Number Average Value Number Average Value Number Average Value Number Average Value
LOANS ORIGINATED 102 $84,549 228 $125,084 587 $65,058 166 $12,289 0 $0 65 $55,213 APPLICATIONS APPROVED, NOT ACCEPTED 4 $81,975 54 $66,678 322 $66,183 57 $12,083 1 $6,340 14 $54,188 APPLICATIONS DENIED 14 $80,163 93 $60,868 606 $67,312 237 $11,270 0 $0 32 $46,586 APPLICATIONS WITHDRAWN 8 $75,756 45 $71,119 348 $67,889 17 $24,144 1 $66,450 19 $50,475 FILES CLOSED FOR INCOMPLETENESS 3 $74,843 11 $96,301 95 $66,054 1 $1,500 0 $0 8 $49,829
Detailed mortgage data for all 10 tracts in Trotwood, OH
Private Mortgage Insurance Companies Aggregated Statistics For Year 2009(Based on 5 full and 2 partial tracts) A) Conventional B) Refinancings C) Non-occupant Loans on Number Average Value Number Average Value Number Average Value
LOANS ORIGINATED 2 $76,330 5 $77,950 0 $0 APPLICATIONS APPROVED, NOT ACCEPTED 2 $39,775 1 $60,320 1 $33,600 APPLICATIONS DENIED 1 $67,000 0 $0 0 $0 APPLICATIONS WITHDRAWN 0 $0 1 $144,000 0 $0 FILES CLOSED FOR INCOMPLETENESS 0 $0 0 $0 0 $0
Aggregated Statistics For Year 2008(Based on 6 full and 4 partial tracts) A) Conventional B) Refinancings C) Non-occupant Loans on Number Average Value Number Average Value Number Average Value
LOANS ORIGINATED 26 $74,105 20 $110,584 8 $56,782 APPLICATIONS APPROVED, NOT ACCEPTED 19 $80,042 10 $165,212 8 $50,396 APPLICATIONS DENIED 2 $63,545 3 $56,880 2 $45,595 APPLICATIONS WITHDRAWN 3 $88,163 2 $154,325 2 $75,570 FILES CLOSED FOR INCOMPLETENESS 4 $104,295 1 $102,880 3 $108,947
Aggregated Statistics For Year 2007(Based on 6 full and 4 partial tracts) A) Conventional B) Refinancings C) Non-occupant Loans on Number Average Value Number Average Value Number Average Value
LOANS ORIGINATED 105 $90,653 33 $108,557 15 $57,092 APPLICATIONS APPROVED, NOT ACCEPTED 22 $99,265 8 $105,494 3 $63,927 APPLICATIONS DENIED 3 $92,920 2 $63,995 2 $96,200 APPLICATIONS WITHDRAWN 2 $101,930 2 $124,825 0 $0 FILES CLOSED FOR INCOMPLETENESS 0 $0 0 $0 0 $0
Aggregated Statistics For Year 2006(Based on 6 full and 4 partial tracts) A) Conventional B) Refinancings C) Non-occupant Loans on Number Average Value Number Average Value Number Average Value
LOANS ORIGINATED 64 $82,802 24 $93,064 14 $51,319 APPLICATIONS APPROVED, NOT ACCEPTED 10 $75,510 15 $129,376 4 $57,900 APPLICATIONS DENIED 0 $0 3 $55,723 0 $0 APPLICATIONS WITHDRAWN 6 $99,287 2 $47,895 1 $43,070 FILES CLOSED FOR INCOMPLETENESS 0 $0 1 $139,000 0 $0
Aggregated Statistics For Year 2005(Based on 6 full and 4 partial tracts) A) Conventional B) Refinancings C) Non-occupant Loans on Number Average Value Number Average Value Number Average Value
LOANS ORIGINATED 67 $101,418 42 $109,634 17 $57,242 APPLICATIONS APPROVED, NOT ACCEPTED 10 $116,691 16 $111,015 5 $34,890 APPLICATIONS DENIED 0 $0 0 $0 0 $0 APPLICATIONS WITHDRAWN 2 $117,460 5 $79,570 0 $0 FILES CLOSED FOR INCOMPLETENESS 1 $117,740 2 $93,445 1 $91,890
Aggregated Statistics For Year 2004(Based on 6 full and 4 partial tracts) A) Conventional B) Refinancings C) Non-occupant Loans on Number Average Value Number Average Value Number Average Value
LOANS ORIGINATED 58 $97,074 37 $88,802 15 $62,662 APPLICATIONS APPROVED, NOT ACCEPTED 11 $78,127 42 $97,604 6 $66,098 APPLICATIONS DENIED 0 $0 1 $125,420 0 $0 APPLICATIONS WITHDRAWN 4 $94,072 11 $79,622 2 $64,090 FILES CLOSED FOR INCOMPLETENESS 0 $0 0 $0 0 $0
Aggregated Statistics For Year 2003(Based on 6 full and 4 partial tracts) A) Conventional B) Refinancings C) Non-occupant Loans on Number Average Value Number Average Value Number Average Value
LOANS ORIGINATED 60 $108,640 118 $99,069 15 $74,648 APPLICATIONS APPROVED, NOT ACCEPTED 14 $124,470 43 $99,130 2 $44,430 APPLICATIONS DENIED 1 $99,470 5 $101,652 1 $88,000 APPLICATIONS WITHDRAWN 1 $82,600 11 $109,316 4 $86,575 FILES CLOSED FOR INCOMPLETENESS 0 $0 1 $104,000 0 $0
Aggregated Statistics For Year 2002(Based on 6 full and 4 partial tracts) A) Conventional B) Refinancings C) Non-occupant Loans on Number Average Value Number Average Value Number Average Value
LOANS ORIGINATED 59 $96,020 85 $99,169 18 $67,109 APPLICATIONS APPROVED, NOT ACCEPTED 19 $98,004 33 $111,748 4 $81,580 APPLICATIONS DENIED 3 $109,190 3 $108,190 1 $63,570 APPLICATIONS WITHDRAWN 7 $133,833 12 $101,630 4 $123,750 FILES CLOSED FOR INCOMPLETENESS 1 $233,560 1 $151,510 0 $0
Aggregated Statistics For Year 2001(Based on 6 full and 4 partial tracts) A) Conventional B) Refinancings C) Non-occupant Loans on Number Average Value Number Average Value Number Average Value
LOANS ORIGINATED 47 $96,439 83 $98,559 19 $70,587 APPLICATIONS APPROVED, NOT ACCEPTED 11 $128,657 39 $98,698 6 $59,582 APPLICATIONS DENIED 4 $49,652 3 $105,047 4 $49,652 APPLICATIONS WITHDRAWN 3 $96,633 6 $82,655 2 $123,695 FILES CLOSED FOR INCOMPLETENESS 0 $0 1 $83,000 0 $0
Aggregated Statistics For Year 2000(Based on 6 full and 4 partial tracts) A) Conventional B) Refinancings C) Non-occupant Loans on Number Average Value Number Average Value Number Average Value
LOANS ORIGINATED 50 $86,546 38 $84,589 10 $66,396 APPLICATIONS APPROVED, NOT ACCEPTED 10 $104,536 13 $83,291 2 $66,110 APPLICATIONS DENIED 4 $136,458 3 $119,860 0 $0 APPLICATIONS WITHDRAWN 2 $29,695 2 $85,000 0 $0 FILES CLOSED FOR INCOMPLETENESS 1 $189,530 0 $0 0 $0
Aggregated Statistics For Year 1999(Based on 6 full and 4 partial tracts) A) Conventional B) Refinancings C) Non-occupant Loans on Number Average Value Number Average Value Number Average Value
LOANS ORIGINATED 39 $92,866 50 $79,623 9 $65,183 APPLICATIONS APPROVED, NOT ACCEPTED 7 $104,580 12 $74,267 0 $0 APPLICATIONS DENIED 3 $65,963 4 $56,832 2 $57,265 APPLICATIONS WITHDRAWN 0 $0 2 $76,960 0 $0 FILES CLOSED FOR INCOMPLETENESS 0 $0 1 $107,740 0 $0
Trotwood compared to Ohio state average:
Median house value below state average. Unemployed percentage below state average. Black race population percentage significantly above state average. Hispanic race population percentage below state average. Foreign-born population percentage below state average. Length of stay since moving in significantly above state average.
#2 on the list of "Top 101 cities with the smallest racial income disparities between White and Black householders (with at least 2,000 householders)"
#16 on the list of "Top 101 cities with the smallest racial income disparities between White and Black householders (with at least 200 householders)"
#72 on the list of "Top 100 cities with the largest percentage of females (pop. 5,000+)"
#77 on the list of "Top 101 cities with largest percentage of males in occupations: healthcare support occupations (population 5,000+)"
#20 on the list of "Top 101 counties with the largest increase in the number of infant deaths per 1000 residents 2000-2006 to 2007-2013 (pop. 50,000+)"
#25 on the list of "Top 101 counties with the highest ground withdrawal of fresh water for public supply"
#37 on the list of "Top 101 counties with the highest number of infant deaths per 1000 residents 2007-2013 (pop. 50,000+)"
#40 on the list of "Top 101 counties with the lowest percentage of residents that drank alcohol in the past 30 days"
#47 on the list of "Top 101 counties with the most Black Protestant adherents"
Top Patent Applicants
John J. Saettel (4)
Gary F. Summons (2)
Walter Lee Brewer (1)
Thomas John Ewry (1)
Demond Hill (1)
Justin Lamar Johnson (1)
Herbert S. Summers (1)
Total of 11 patent applications in 2008-2024.
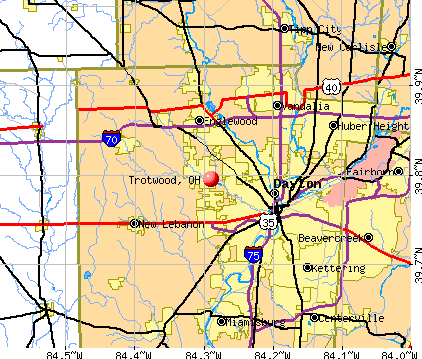


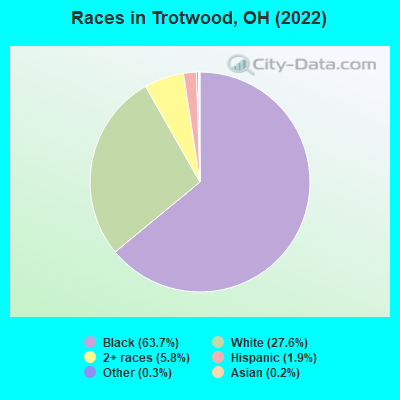
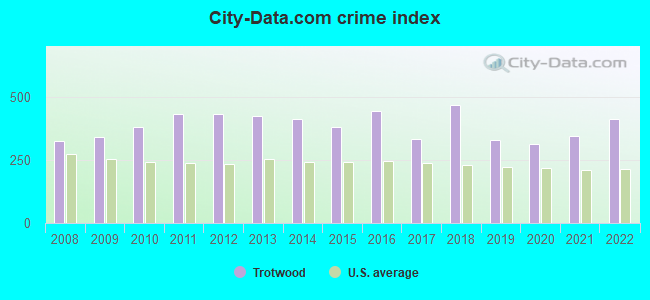
 Recent articles from our blog. Our writers, many of them Ph.D. graduates or candidates, create easy-to-read articles on a wide variety of topics.

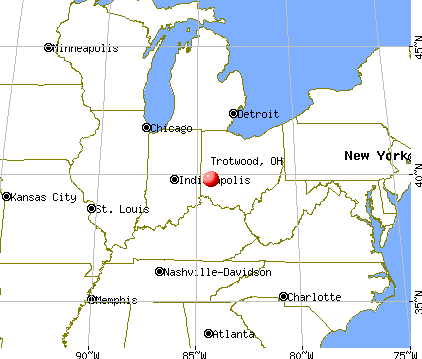
 (5.4 miles
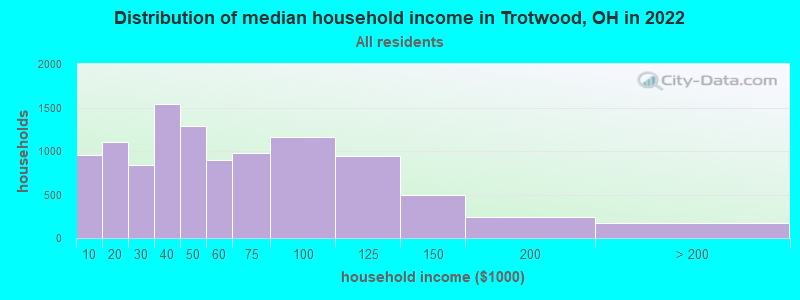
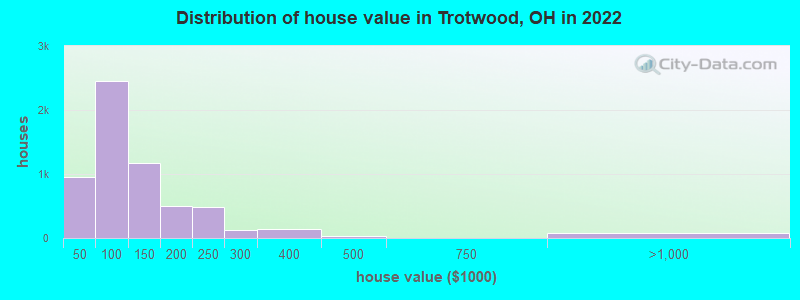
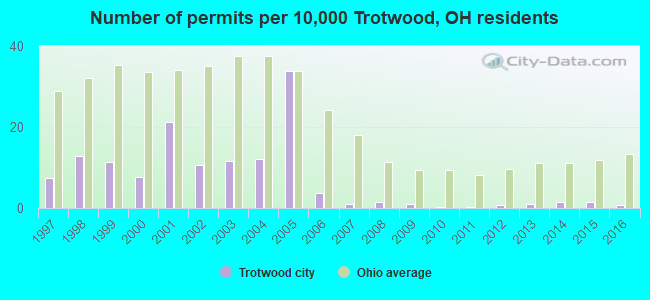
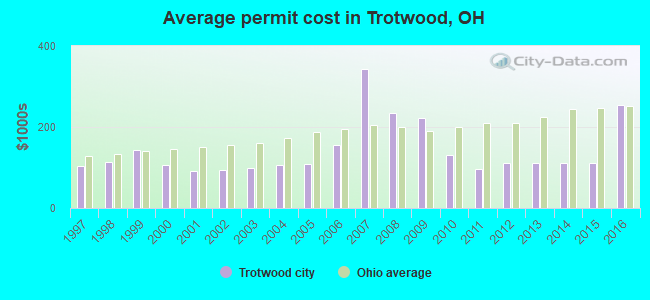
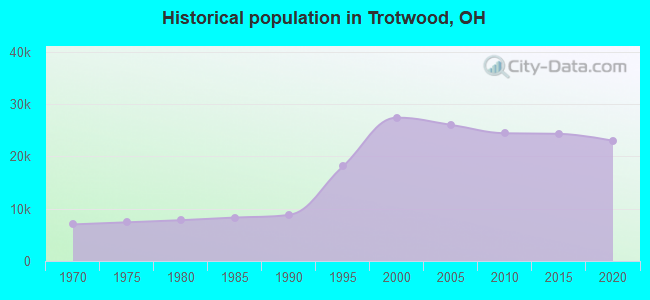
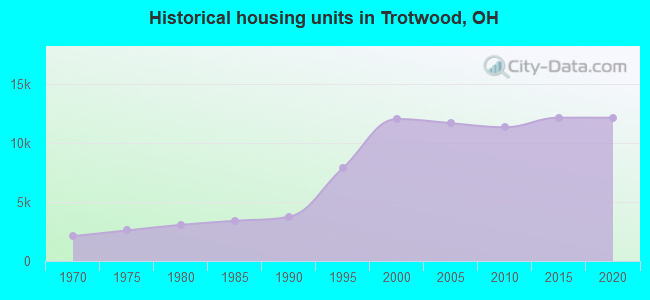
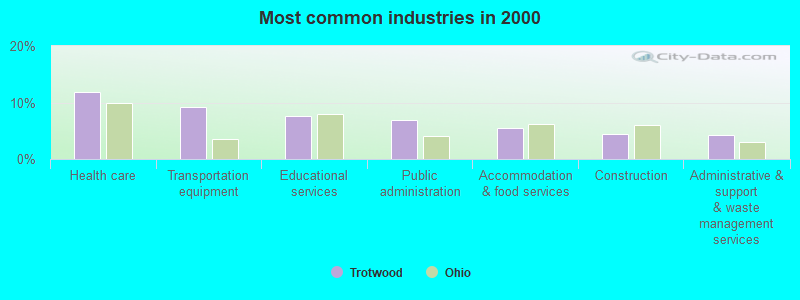
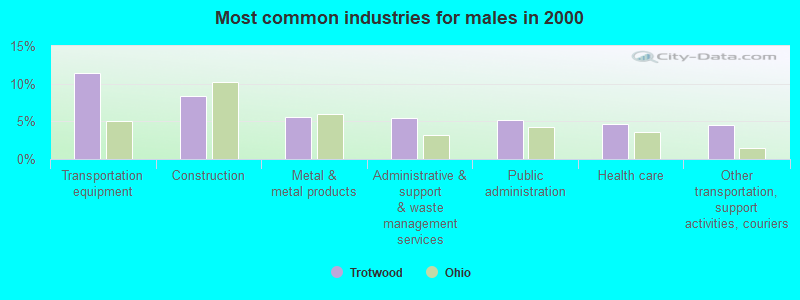
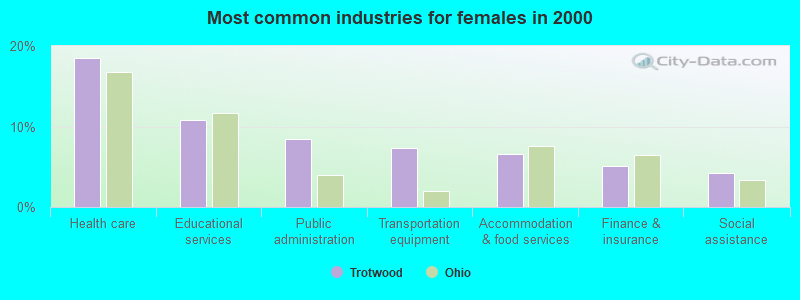
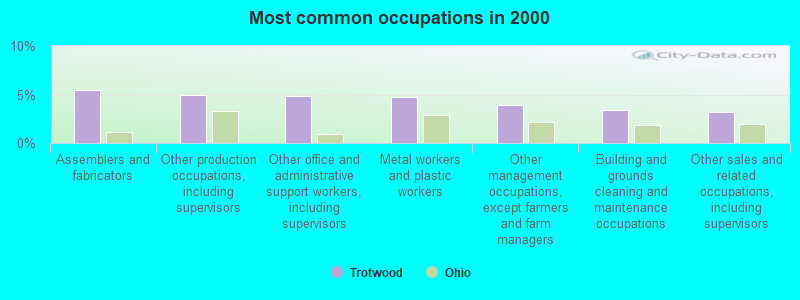
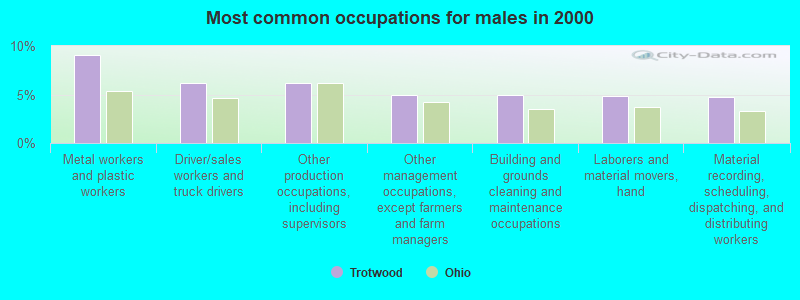
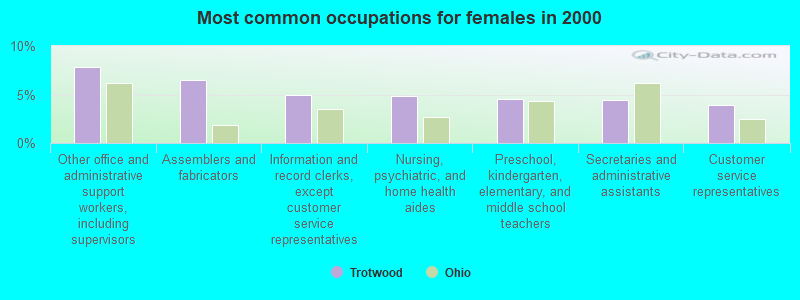


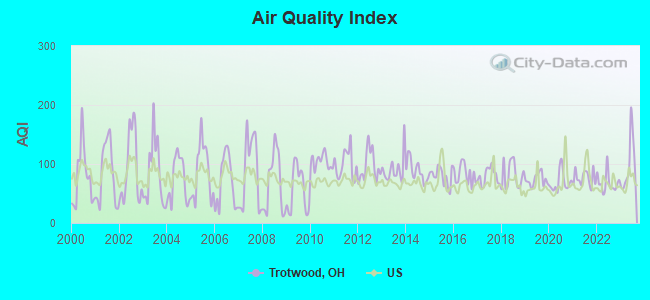
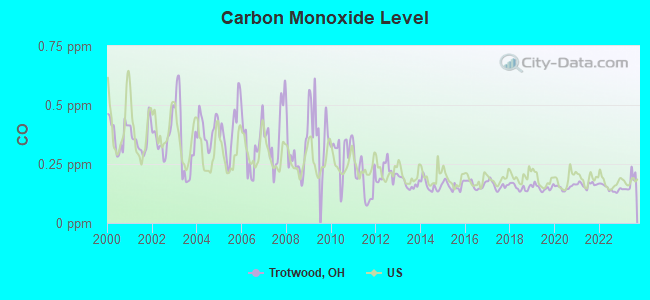
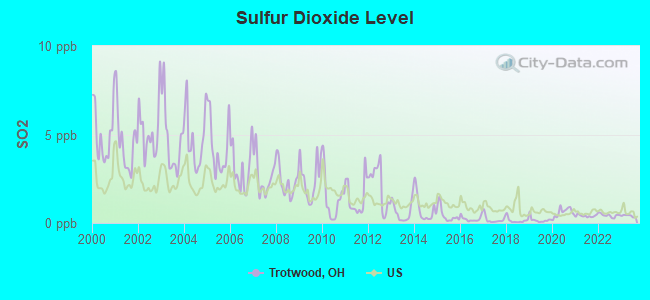
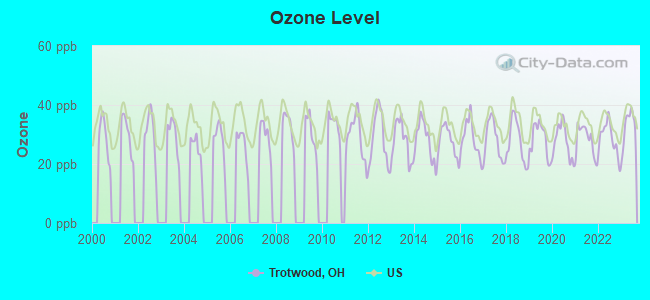
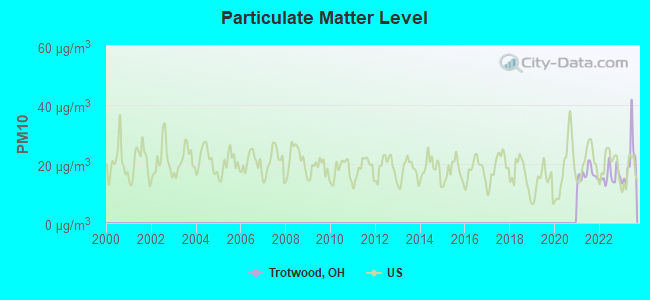
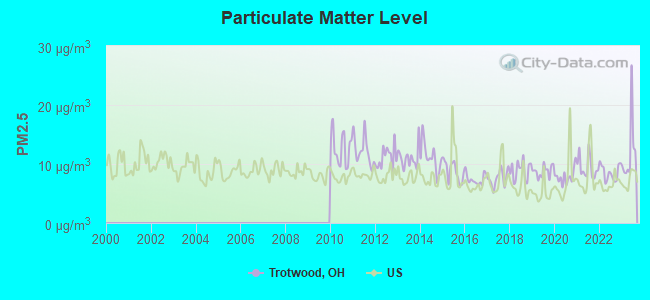

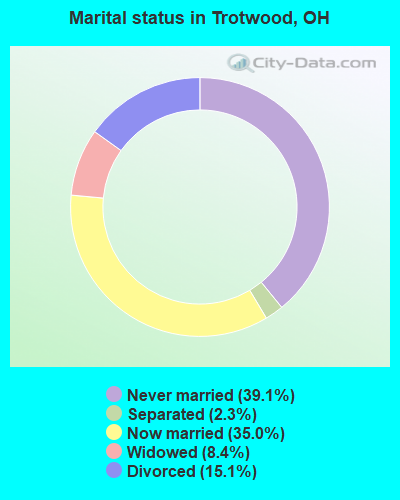
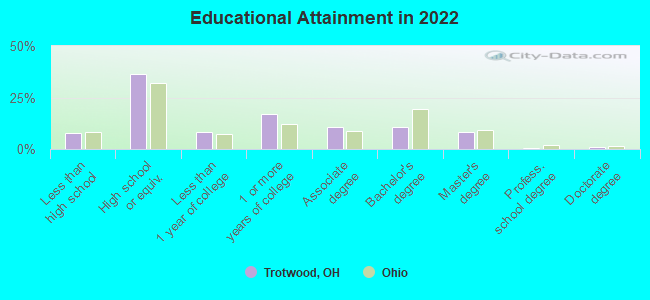
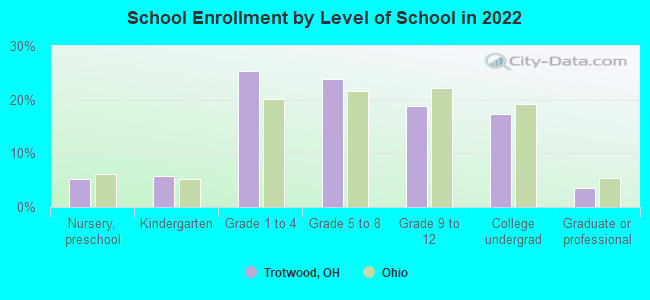
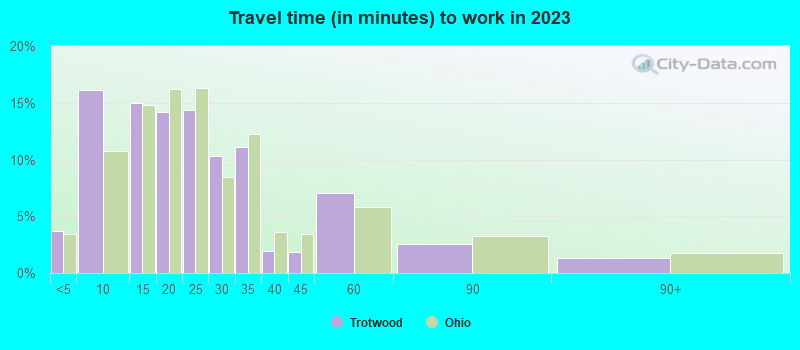
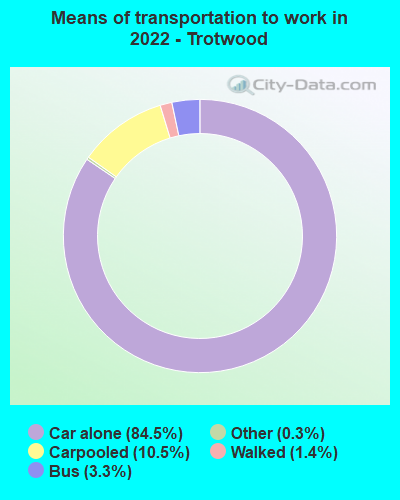
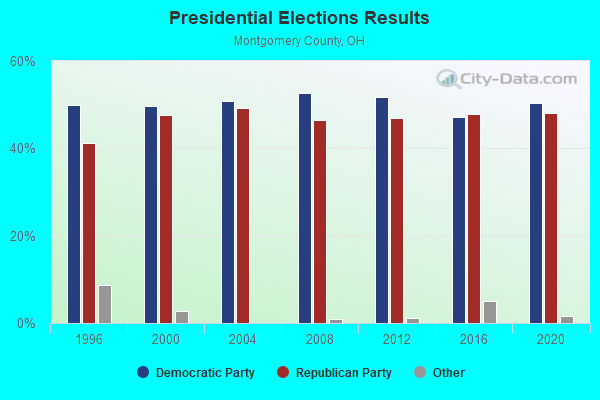
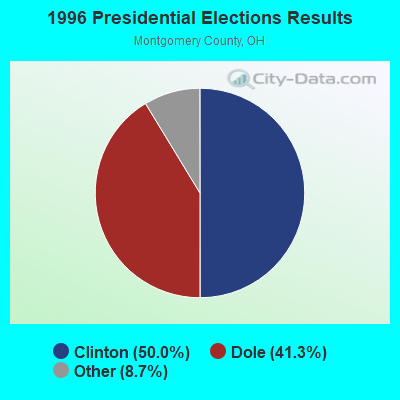
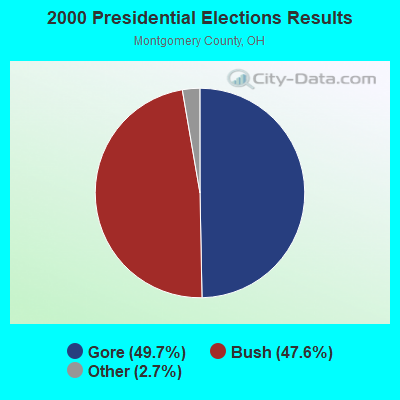
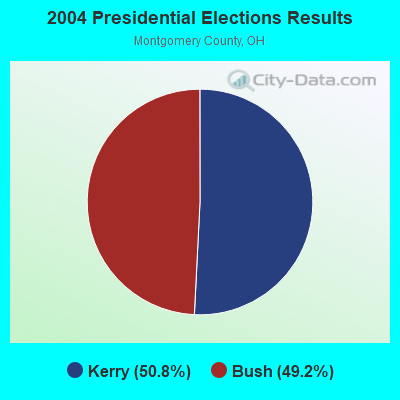
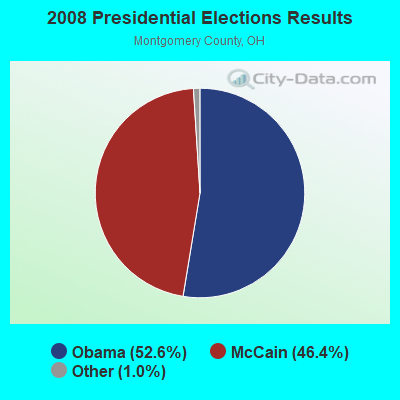

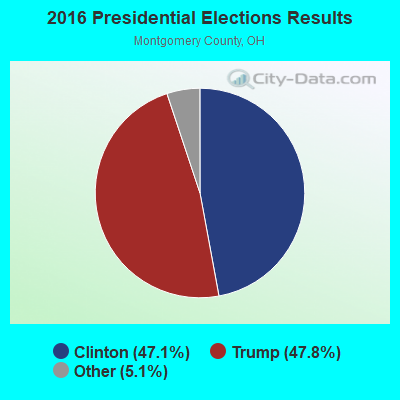
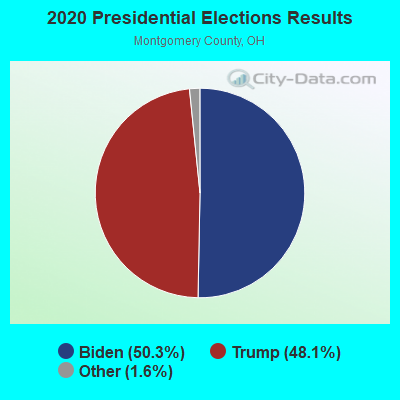
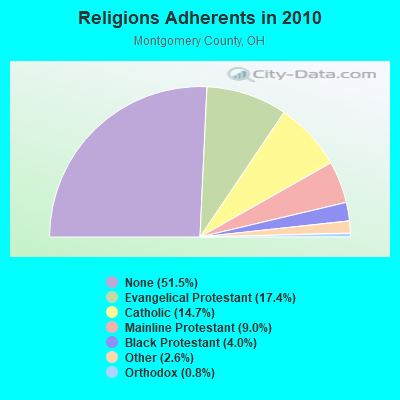
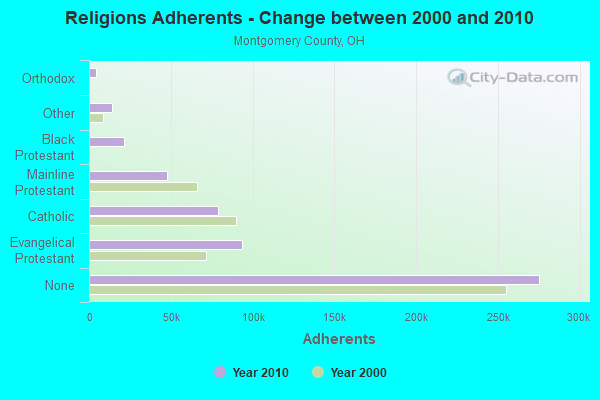
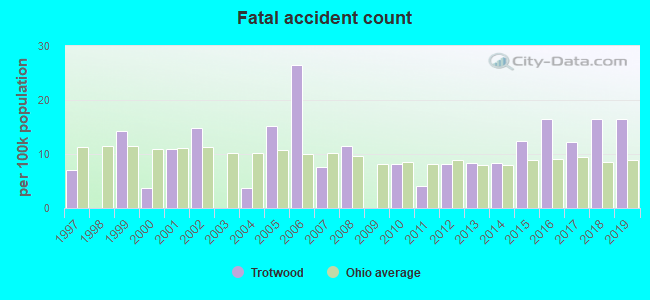
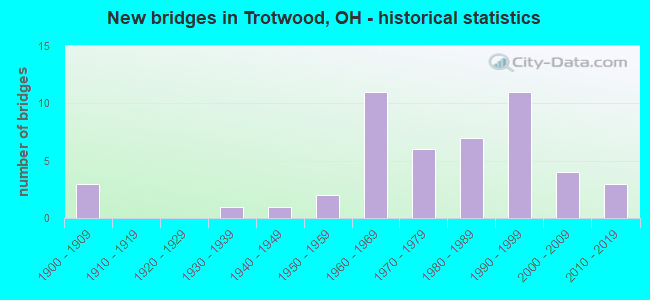
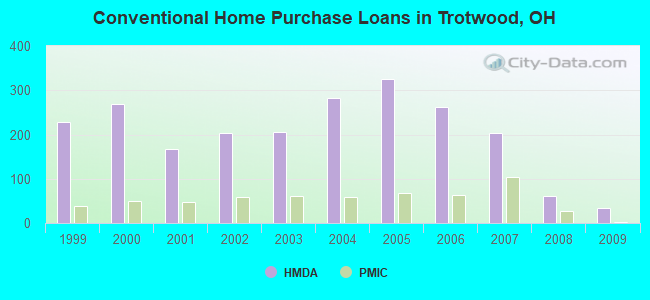
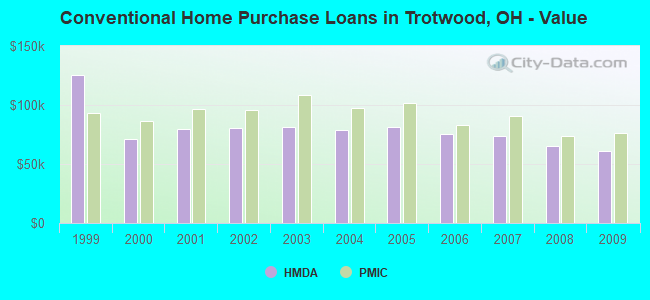
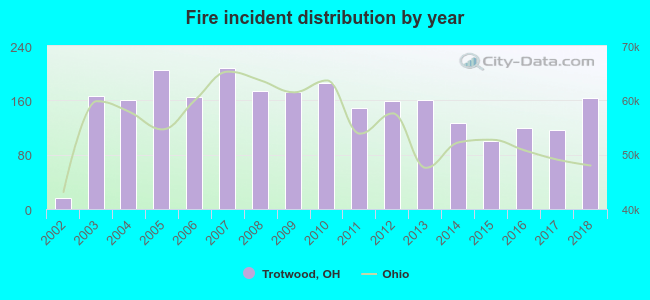 Based on the data from the years 2002 - 2018 the average number of fires per year is 150. The highest number of fire incidents - 207 took place in 2007, and the least - 16 in 2002. The data has a growing trend.
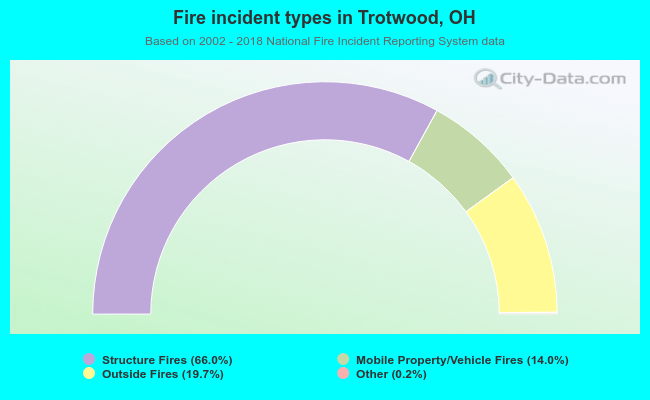 When looking into fire subcategories, the most incidents belonged to: Structure Fires (66.0%), and Outside Fires (19.7%).