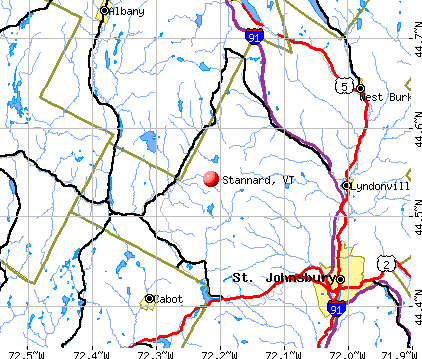
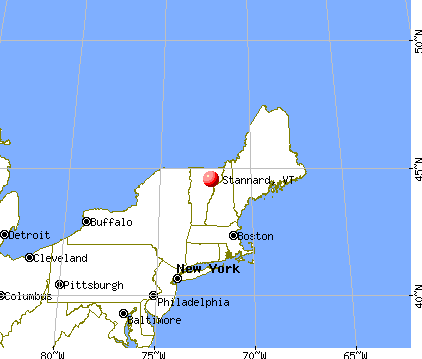
Stannard, Vermont
Submit your own pictures of this town and show them to the world
- OSM Map
- General Map
- Google Map
- MSN Map
Population change since 2000: +16.8%
 |
| Males: 107 | |
| Females: 109 |
| Median resident age: | 41.5 years |
| Vermont median age: | 45.8 years |
Zip code: 05836
| Stannard: | $65,567 |
| VT: | $73,991 |
Estimated per capita income in 2022: $33,215 (it was $15,196 in 2000)
Estimated median house or condo value in 2022: $172,486 (it was $67,000 in 2000)
| Stannard: | $172,486 |
| VT: | $304,700 |
Mean prices in 2022: all housing units: $260,980; detached houses: $279,604; townhouses or other attached units: $224,498; in 2-unit structures: $313,991; in 3-to-4-unit structures: $254,854; in 5-or-more-unit structures: $182,529; mobile homes: $88,292; occupied boats, rvs, vans, etc.: $12,813
Detailed information about poverty and poor residents in Stannard, VT


- 20494.4%White alone
- 52.3%Black alone
- 52.3%Hispanic
- 10.5%Asian alone
- 10.5%Two or more races

According to our research of Vermont and other state lists, there was 1 registered sex offender living in Stannard, Vermont as of May 29, 2024.
The ratio of all residents to sex offenders in Stannard is 216 to 1.
 Recent articles from our blog. Our writers, many of them Ph.D. graduates or candidates, create easy-to-read articles on a wide variety of topics.

Latest news from Stannard, VT collected exclusively by city-data.com from local newspapers, TV, and radio stations
Ancestries: English (33.5%), French (22.2%), French Canadian (19.5%), German (13.5%), Scottish (13.0%), Irish (10.3%).
Current Local Time: EST time zone
Elevation: 1706 feet
Land area: 12.5 square miles.
Population density: 17 people per square mile (very low).
12 residents are foreign born (6.5% North America).
| This town: | 6.5% |
| Vermont: | 3.8% |
| Stannard town: | 2.0% ($1,350) |
| Vermont: | 2.0% ($2,196) |
Nearest city with pop. 50,000+: Portland, ME  (114.4 miles , pop. 64,249).
Nearest city with pop. 200,000+: Boston, MA (163.9 miles , pop. 589,141).
Nearest city with pop. 1,000,000+: Bronx, NY (269.2 miles , pop. 1,332,650).
Nearest cities:
), ), ), ), ), )Latitude: 44.54 N, Longitude: 72.22 W
Area code commonly used in this area: 802


Single-family new house construction building permits:
- 2022: 1 building, cost: $279,200
- 2021: 2 buildings, average cost: $248,200
- 2020: 2 buildings, average cost: $248,200
- 2019: 1 building, cost: $282,200
- 2018: 1 building, cost: $249,800
- 2017: 1 building, cost: $248,100
- 2016: 1 building, cost: $246,000
- 2015: 1 building, cost: $838,400
- 2014: 2 buildings, average cost: $193,300
- 2013: 2 buildings, average cost: $193,300
- 2011: 1 building, cost: $30,000
- 2010: 1 building, cost: $30,000
- 2009: 1 building, cost: $30,000
- 2008: 1 building, cost: $30,000
- 2007: 2 buildings, average cost: $30,000
- 2006: 2 buildings, average cost: $30,000
- 2005: 2 buildings, average cost: $30,000
- 2004: 2 buildings, average cost: $30,000
- 2003: 2 buildings, average cost: $30,000
- 2002: 2 buildings, average cost: $30,000
- 2001: 2 buildings, average cost: $30,000
- 2000: 1 building, cost: $30,000
- 1999: 1 building, cost: $30,000
- 1998: 1 building, cost: $30,000
- 1997: 1 building, cost: $30,000


| Here: | 0.9% |
| Vermont: | 2.0% |


- Construction (13.2%)
- Religious, grantmaking, civic, professional, similar organizations (11.3%)
- Food (8.5%)
- Educational services (8.5%)
- Health care (8.5%)
- Public administration (6.6%)
- U. S. Postal service (4.7%)

- Construction (25.0%)
- Food (10.4%)
- U. S. Postal service (10.4%)
- Public administration (8.3%)
- Repair & maintenance (8.3%)
- Lumber & other construction materials merchant wholesalers (6.2%)
- Truck transportation (6.2%)

- Religious, grantmaking, civic, professional, similar organizations (20.7%)
- Educational services (15.5%)
- Health care (12.1%)
- Food (6.9%)
- Radio, TV, computer stores (5.2%)
- Motor vehicle & parts dealers (5.2%)
- Food & beverage stores (5.2%)

- Carpenters (8.5%)
- Supervisors and other personal care and service workers, except child care workers (7.5%)
- Driver/sales workers and truck drivers (7.5%)
- Other production occupations, including supervisors (6.6%)
- Building and grounds cleaning and maintenance occupations (5.7%)
- Bookkeeping, accounting, and auditing clerks (5.7%)
- Other office and administrative support workers, including supervisors (5.7%)

- Carpenters (18.8%)
- Driver/sales workers and truck drivers (16.7%)
- Other production occupations, including supervisors (10.4%)
- Vehicle and mobile equipment mechanics, installers, and repairers (8.3%)
- Sales representatives, services, wholesale and manufacturing (6.2%)
- Supervisors, construction and extraction workers (6.2%)
- Life, physical, and social science technicians (4.2%)

- Supervisors and other personal care and service workers, except child care workers (13.8%)
- Bookkeeping, accounting, and auditing clerks (10.3%)
- Building and grounds cleaning and maintenance occupations (6.9%)
- Other office and administrative support workers, including supervisors (6.9%)
- Food processing workers (6.9%)
- Advertising, marketing, promotions, public relations, and sales managers (5.2%)
- Accountants and auditors (5.2%)
Average climate in Stannard, Vermont
Based on data reported by over 4,000 weather stations


Earthquake activity:
Stannard-area historical earthquake activity is significantly above Vermont state average. It is 73% smaller than the overall U.S. average.On 4/20/2002 at 10:50:47, a magnitude 5.3 (5.3 ML, Depth: 3.0 mi, Class: Moderate, Intensity: VI - VII) earthquake occurred 72.9 miles away from Stannard center
On 4/20/2002 at 10:50:47, a magnitude 5.2 (5.2 MB, 4.2 MS, 5.2 MW, 5.0 MW) earthquake occurred 74.0 miles away from Stannard center
On 10/7/1983 at 10:18:46, a magnitude 5.3 (5.1 MB, 5.3 LG, 5.1 ML) earthquake occurred 112.8 miles away from the city center
On 1/19/1982 at 00:14:42, a magnitude 4.7 (4.5 MB, 4.7 MD, 4.5 LG, Class: Light, Intensity: IV - V) earthquake occurred 78.6 miles away from the city center
On 10/16/2012 at 23:12:25, a magnitude 4.7 (4.7 ML, Depth: 10.0 mi) earthquake occurred 101.7 miles away from Stannard center
On 6/16/1995 at 12:13:11, a magnitude 3.8 (3.8 LG, Depth: 3.1 mi, Class: Light, Intensity: II - III) earthquake occurred 23.4 miles away from the city center
Magnitude types: regional Lg-wave magnitude (LG), body-wave magnitude (MB), duration magnitude (MD), local magnitude (ML), surface-wave magnitude (MS), moment magnitude (MW)
Natural disasters:
The number of natural disasters in Caledonia County (24) is greater than the US average (15).Major Disasters (Presidential) Declared: 21
Emergencies Declared: 1
Causes of natural disasters: Floods: 19, Storms: 16, Heavy Rains: 2, Tropical Storms: 2, Winds: 2, Hurricane: 1, Landslide: 1, Tornado: 1, Winter Storm: 1, Other: 1 (Note: some incidents may be assigned to more than one category).
Hospitals and medical centers near Stannard:
- UNION HOUSE NURSING HOME (Nursing Home, about 9 miles away; GLOVER, VT)
- PINES REHAB AND HEALTH CTR (Nursing Home, about 12 miles away; LYNDONVILLE, VT)
- CALEDONIA HOME HEALTH CARE (Home Health Center, about 13 miles away; SAINT JOHNSBURY, VT)
- FMC OF ST. JOHNSBURY DIALYSIS (Dialysis Facility, about 13 miles away; SAINT JOHNSBURY, VT)
- ST JOHNSBURY HEALTH AND REHAB (Nursing Home, about 13 miles away; SAINT JOHNSBURY, VT)
- NORTHEASTERN VERMONT REGIONAL HOSPITAL Critical Access Hospitals (about 13 miles away; SAINT JOHNSBURY, VT)
- MAPLE LANE NURSING HOME (Nursing Home, about 13 miles away; BARTON, VT)
Colleges/universities with over 2000 students nearest to Stannard:
- Norwich University (about 36 miles; Northfield, VT; Full-time enrollment: 4,221)
- Saint Michael's College (about 47 miles; Colchester, VT; FT enrollment: 2,336)
- Community College of Vermont (about 48 miles; Winooski, VT; FT enrollment: 3,394)
- University of Vermont (about 49 miles; Burlington, VT; FT enrollment: 11,566)
- Champlain College (about 49 miles; Burlington, VT; FT enrollment: 2,623)
- Dartmouth College (about 59 miles; Hanover, NH; FT enrollment: 6,030)
- Middlebury College (about 61 miles; Middlebury, VT; FT enrollment: 3,077)
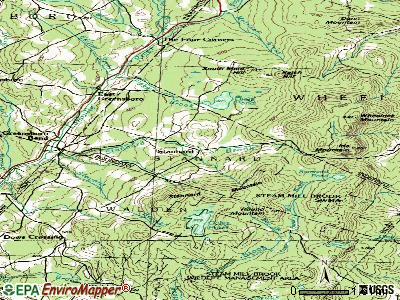
Points of interest:
Cemeteries: Stannard Cemetery (1), Batchelder Cemetery (2). Display/hide their locations on the map
Lake: Stannard Pond (A). Display/hide its location on the map
| This town: | 2.5 people |
| Vermont: | 2.3 people |
| This town: | 68.2% |
| Whole state: | 62.5% |
| This town: | 7.1% |
| Whole state: | 9.2% |
Likely homosexual households (counted as self-reported same-sex unmarried-partner households)
- Lesbian couples: 1.2% of all households
- Gay men: 0.0% of all households
| This town: | 18.8% |
| Whole state: | 9.4% |
| This town: | 8.1% |
| Whole state: | 3.6% |
For population 15 years and over in Stannard:

- Never married: 24.4%
- Now married: 50.6%
- Separated: 2.6%
- Widowed: 1.3%
- Divorced: 21.2%
For population 25 years and over in Stannard:
- High school or higher: 75.9%
- Bachelor's degree or higher: 19.7%
- Graduate or professional degree: 7.3%
- Unemployed: 0.9%
- Mean travel time to work (commute): 38.4 minutes


| Here: | 14.1 |
| Vermont average: | 11.7 |
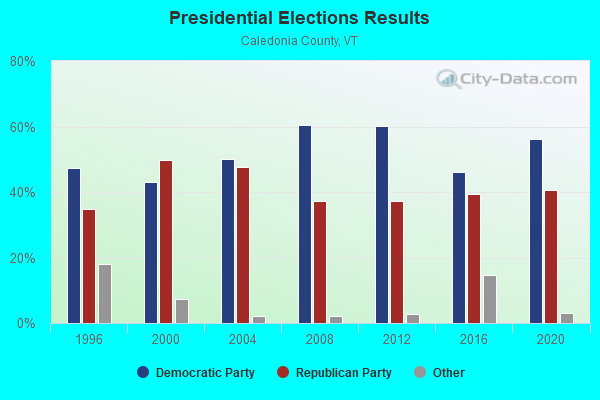

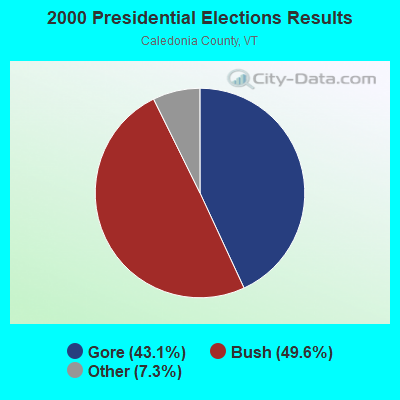
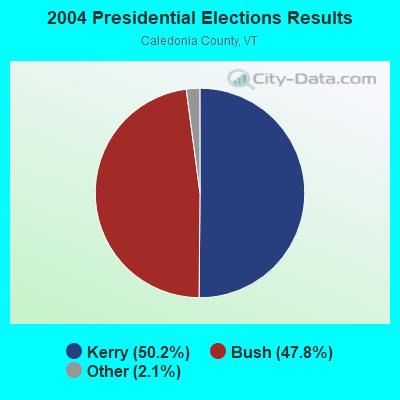
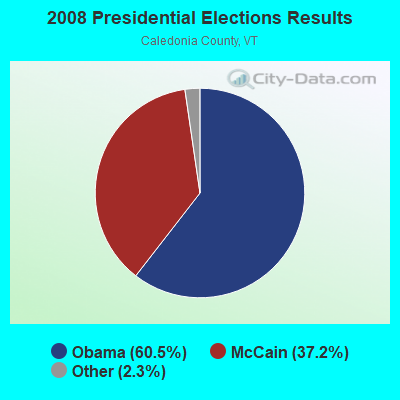
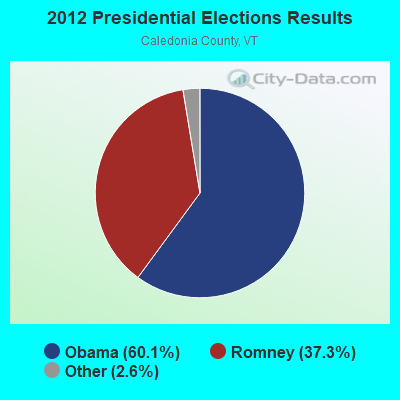
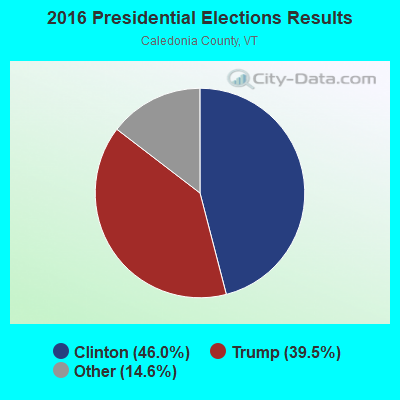
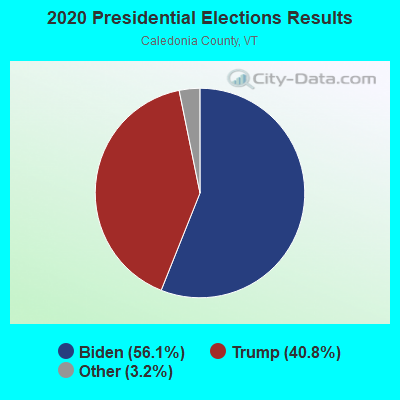
Graphs represent county-level data. Detailed 2008 Election Results
Religion statistics for Stannard, VT (based on Caledonia County data)
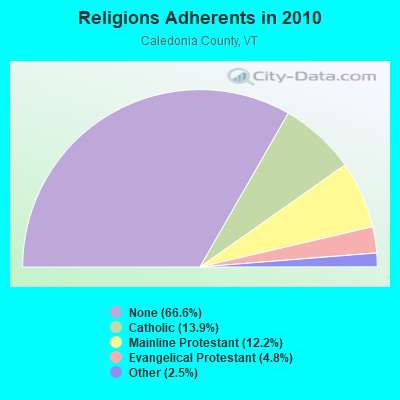
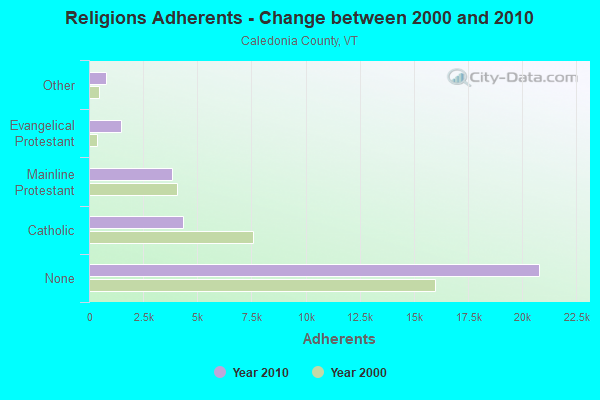
| Religion | Adherents | Congregations |
|---|---|---|
| Catholic | 4,355 | 6 |
| Mainline Protestant | 3,810 | 32 |
| Evangelical Protestant | 1,488 | 15 |
| Other | 780 | 9 |
| None | 20,794 | - |
Food Environment Statistics:
| This county: | 4.91 / 10,000 pop. |
| Vermont: | 3.84 / 10,000 pop. |
| Caledonia County: | 2.29 / 10,000 pop. |
| Vermont: | 1.95 / 10,000 pop. |
| This county: | 7.53 / 10,000 pop. |
| State: | 6.40 / 10,000 pop. |
| Caledonia County: | 10.14 / 10,000 pop. |
| State: | 11.52 / 10,000 pop. |
| Caledonia County: | 7.9% |
| Vermont: | 6.8% |
| Caledonia County: | 24.6% |
| Vermont: | 22.3% |
| This county: | 11.5% |
| Vermont: | 13.3% |
Strongest AM radio stations in Stannard:
- WCHP (760 AM; 35 kW; CHAMPLAIN, NY; Owner: CHAMPLAIN RADIO, INC.)
- WDEV (550 AM; 5 kW; WATERBURY, VT; Owner: RADIO VERMONT, INC.)
- WTWN (1100 AM; daytime; 5 kW; WELLS RIVER, VT; Owner: PUFFER BROADCASTING, INC.)
- WSTJ (1340 AM; 1 kW; ST. JOHNSBURY, VT; Owner: VERMONT BROADCAST ASSOCIATES, INC.)
- WICY (1490 AM; 50 kW; MALONE, NY; Owner: CARTIER COMMUNICATIONS INC.)
- WVMT (620 AM; 5 kW; BURLINGTON, VT; Owner: SISON BROADCASTING, INC.)
- WRKO (680 AM; 50 kW; BOSTON, MA; Owner: ENTERCOM BOSTON LICENSE, LLC)
- WNNZ (640 AM; 50 kW; WESTFIELD, MA; Owner: CLEAR CHANNEL BROADCASTING LICENSES, INC.)
- WGY (810 AM; 50 kW; SCHENECTADY, NY; Owner: CLEAR CHANNEL BROADCASTING LICENSES, INC.)
- WCRN (830 AM; 50 kW; WORCESTER, MA; Owner: CARTER BROADCASTING CORPORATION)
- WEEI (850 AM; 50 kW; BOSTON, MA; Owner: ENTERCOM BOSTON LICENSE, LLC)
- WTME (780 AM; 10 kW; RUMFORD, ME; Owner: MOUNTAIN VALLEY BROADCASTING, INC.)
- WBZ (1030 AM; 50 kW; BOSTON, MA; Owner: INFINITY BROADCASTING OPERATIONS, INC.)
Strongest FM radio stations in Stannard:
- WDOT (95.7 FM; DANVILLE, VT; Owner: MONTPELIER BROADCASTING INC)
- WGMT (97.7 FM; LYNDON, VT; Owner: VERMONT BROADCAST ASSOCIATES, INC.)
- WLKC (103.3 FM; WATERBURY, VT; Owner: RADIO BROADCASTING SERVICES, INC.)
- WVPS (107.9 FM; BURLINGTON, VT; Owner: VERMONT PUBLIC RADIO)
- WEZF (92.9 FM; BURLINGTON, VT; Owner: CAPSTAR TX LIMITED PARTNERSHIP)
- WCVT (101.7 FM; STOWE, VT; Owner: RADIO VERMONT CLASSICS, L.L.C.)
- WPKQ (103.7 FM; NORTH CONWAY, NH; Owner: CITADEL BROADCASTING COMPANY)
- WNCS (104.7 FM; MONTPELIER, VT; Owner: MONTPELIER BROADCASTING, INC.)
- WHOM (94.9 FM; MT. WASHINGTON, NH; Owner: CITADEL BROADCASTING COMPANY)
- WCKJ (90.5 FM; ST. JOHNSBURY, VT; Owner: CHRISTIAN MINISTRIES, INC.)
- WKXH (105.5 FM; ST. JOHNSBURY, VT; Owner: VERMONT BROADCAST ASSOCIATES, INC.)
- WMTK (106.3 FM; LITTLETON, NH; Owner: VERMONT BROADCAST ASSOCIATES, INC.)
- WDEV-FM (96.1 FM; WARREN, VT; Owner: RADIO VERMONT, INC.)
- W243AE (96.5 FM; ORLEANS, VT; Owner: CHRISTIAN MINISTRIES, INC.)
- WXXS (102.3 FM; LANCASTER, NH; Owner: BARRY P. LUNDERVILLE)
- WVFM (105.7 FM; CAMPTON, NH; Owner: DEVON BROADCASTING COMPANY, INC.)
- WEBK (105.3 FM; KILLINGTON, VT; Owner: 6 JOHNSON ROAD LICENSES, INC.)
- WJJR (98.1 FM; RUTLAND, VT; Owner: 6 JOHNSON ROAD LICENSES, INC.)
- WZRT (97.1 FM; RUTLAND, VT; Owner: CAPSTAR TX LIMITED PARTNERSHIP)
- WGLY-FM (91.5 FM; BOLTON, VT; Owner: CHRISTIAN MINISTRIES, INC.)
TV broadcast stations around Stannard:
- WLED-TV (Channel 49; LITTLETON, NH; Owner: UNIVERSITY OF NEW HAMPSHIRE)
- National Bridge Inventory (NBI) Statistics
- 2Number of bridges
- 3ft / 1.4mTotal length
- 450Total average daily traffic
- 8Total average daily truck traffic
- 474Total future (year 2029) average daily traffic

- 49.3%Wood
- 36.6%Fuel oil, kerosene, etc.
- 14.1%Bottled, tank, or LP gas

- 45.5%Wood
- 36.4%Fuel oil, kerosene, etc.
- 18.2%Bottled, tank, or LP gas
Stannard compared to Vermont state average:
- Median house value below state average.
- Unemployed percentage significantly below state average.
- Black race population percentage above state average.
- Median age below state average.
- Renting percentage significantly below state average.
- Length of stay since moving in significantly above state average.
- Number of rooms per house significantly below state average.
- House age significantly below state average.
- Number of college students significantly below state average.
- Percentage of population with a bachelor's degree or higher below state average.