Percentage of residents living in poverty in 2022: 6.2%
(6.9% for White Non-Hispanic residents, 0.6% for Hispanic or Latino residents, 0.4% for two or more races residents)
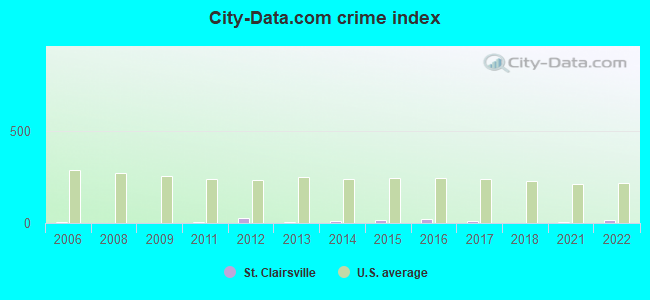
The City-Data.com crime index weighs serious crimes and violent crimes more heavily. Higher means more crime, U.S. average is 246.1. It adjusts for the number of visitors and daily workers commuting into cities.
Latest news from St. Clairsville, OH collected exclusively by city-data.com from local newspapers, TV, and radio stations
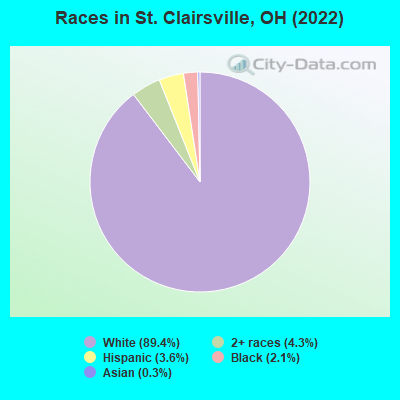
Ancestries: German (17.9%), European (14.6%), English (14.4%), Irish (10.3%), Italian (9.4%), Polish (8.6%).
Current Local Time: EST time zone
Incorporated in 1978
Elevation: 1284 feet
Land area: 2.15 square miles.
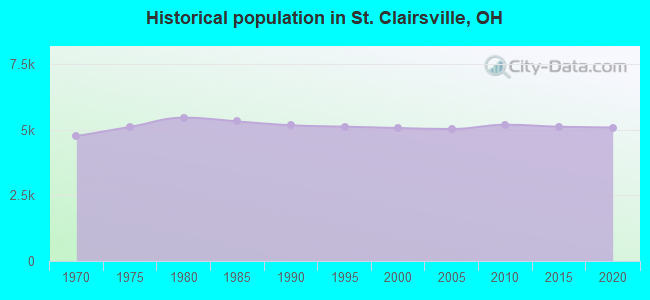
Population density: 2,335 people per square mile (low).
16 residents are foreign born
This city:
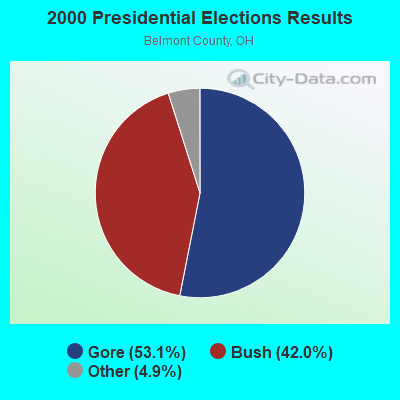
0.3%
Ohio:
4.9%
Median real estate property taxes paid for housing units with mortgages in 2022: $1,894 (0.8%) Median real estate property taxes paid for housing units with no mortgage in 2022: $2,450 (1.2%)
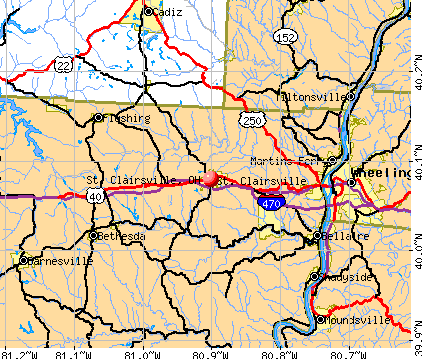
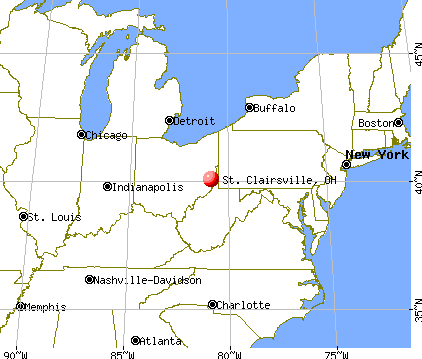
Nearest city with pop. 50,000+: Pittsburgh, PA (54.8 miles , pop. 334,563).
Nearest city with pop. 1,000,000+: Philadelphia, PA (304.8 miles , pop. 1,517,550).
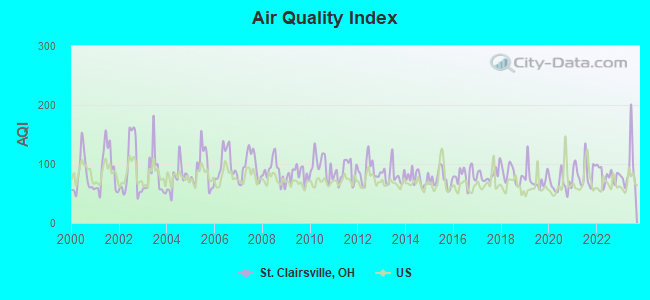
Air Quality Index (AQI) level in 2023 was 92.5. This is worse than average.
City:
92.5
U.S.:
72.6
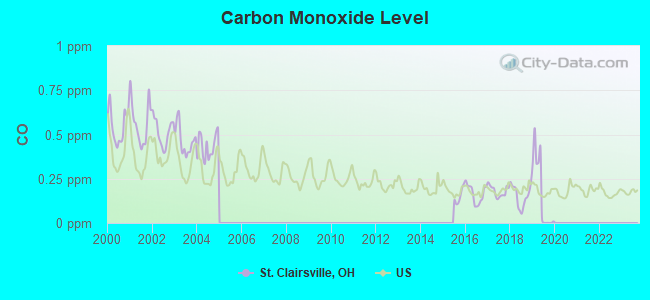
Carbon Monoxide (CO) [ppm] level in 2019 was 0.168. This is significantly better than average.Closest monitor was 9.6 miles away from the city center.
City:
0.168
U.S.:
0.251
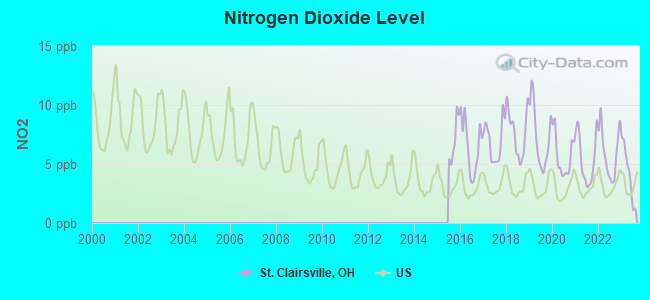
Nitrogen Dioxide (NO2) [ppb] level in 2023 was 4.28. This is about average.Closest monitor was 9.4 miles away from the city center.
City:
4.28
U.S.:
5.11
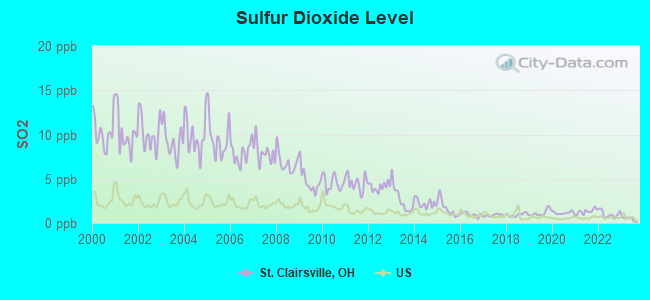
Sulfur Dioxide (SO2) [ppb] level in 2023 was 0.510. This is significantly better than average.Closest monitor was 9.4 miles away from the city center.
City:
0.510
U.S.:
1.515
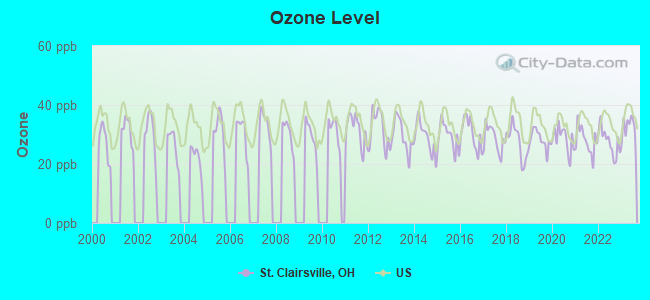
Ozone [ppb] level in 2023 was 32.5. This is about average.Closest monitor was 9.6 miles away from the city center.
City:
32.5
U.S.:
33.3
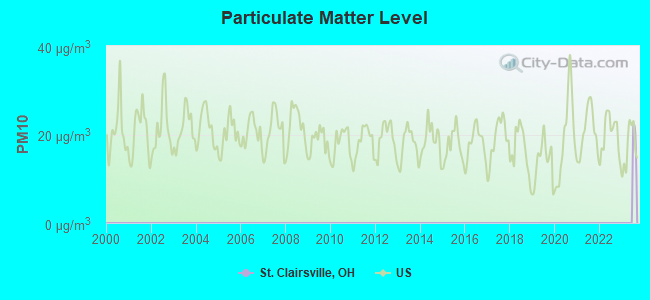
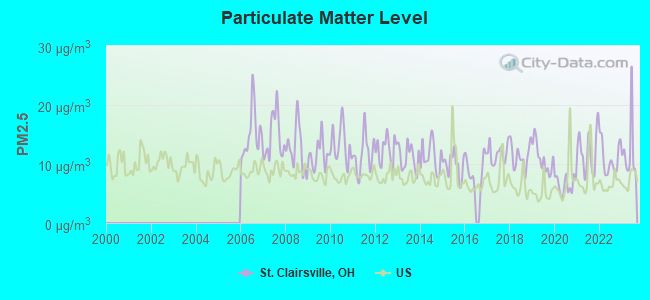
Particulate Matter (PM2.5) [µg/m3] level in 2023 was 12.2. This is significantly worse than average.Closest monitor was 10.9 miles away from the city center.
City:
12.2
U.S.:
8.1
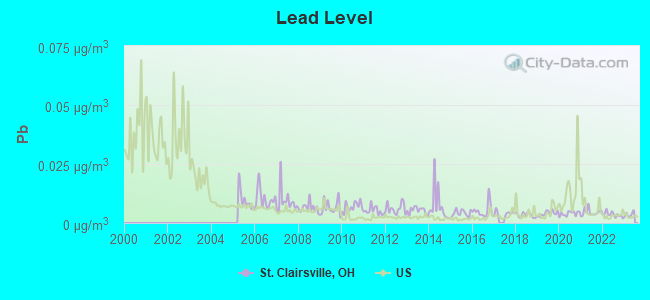
Lead (Pb) [µg/m3] level in 2022 was 0.00359. This is significantly better than average.Closest monitor was 9.6 miles away from the city center.
City:
0.00359
U.S.:
0.00931
Tornado activity:
St. Clairsville-area historical tornado activity is below Ohio state average. It is 33% smaller than the overall U.S. average.
On 5/8/1969, a category F3 (max. wind speeds 158-206 mph) tornado 22.0 miles away from the St. Clairsville city center killed one personand injured 14 peopleand causedbetween $50,000 and $500,000 in damages.
On 4/27/1954, a category F2 (max. wind speeds 113-157 mph) tornado 9.8 miles away from the city center injured one personand causedbetween $50,000 and $500,000 in damages.
Earthquake activity:
St. Clairsville-area historical earthquake activity is significantly above Ohio state average. It is 37% smaller than the overall U.S. average.
On 8/23/2011 at 17:51:04, a magnitude 5.8 (5.8 MW, Depth: 3.7 mi, Class: Moderate, Intensity: VI - VII) earthquake occurred 218.9 miles away from St. Clairsville center On 9/25/1998 at 19:52:52, a magnitude 5.2 (4.8 MB, 4.3 MS, 5.2 LG, 4.5 MW, Depth: 3.1 mi) earthquake occurred 101.2 miles away from St. Clairsville center On 1/31/1986 at 16:46:43, a magnitude 5.0 (5.0 MB) earthquake occurred 106.2 miles away from the city center On 7/27/1980 at 18:52:21, a magnitude 5.2 (5.1 MB, 4.7 MS, 5.0 UK, 5.2 UK) earthquake occurred 208.4 miles away from the city center On 8/9/2020 at 12:07:37, a magnitude 5.1 (5.1 MW, Depth: 4.7 mi) earthquake occurred 249.5 miles away from St. Clairsville center On 12/31/2011 at 20:05:01, a magnitude 4.0 (4.0 ML, Depth: 3.1 mi, Class: Light, Intensity: IV - V) earthquake occurred 73.0 miles away from the city center Magnitude types: regional Lg-wave magnitude (LG), body-wave magnitude (MB), local magnitude (ML), surface-wave magnitude (MS), moment magnitude (MW)
Natural disasters:
The number of natural disasters in Belmont County (19) is greater than the US average (15). Major Disasters (Presidential) Declared: 13 Emergencies Declared: 3
Causes of natural disasters: Floods: 12, Storms: 11, Tornadoes: 4, Landslides: 3, Mudslides: 3, Snowstorms: 2, Winds: 2, Blizzard: 1, Heavy Rain: 1, Hurricane: 1, Tropical Storm: 1, Winter Storm: 1, Other: 1 (Note: some incidents may be assigned to more than one category).
Hospitals and medical centers near St. Clairsville:
MAXIM HEALTHCARE SERVICES, INC (Home Health Center, about 1 miles away; ST CLAIRSVILLE, OH)
FOREST HILL RETIREMENT COMMUNITY (Nursing Home, about 1 miles away; ST CLAIRSVILLE, OH)
PARK HEALTH CENTER (Nursing Home, about 1 miles away; ST CLAIRSVILLE, OH)
ALTERNATIVE HOME HEALTH INC (Home Health Center, about 1 miles away; SAINT CLAIRSVILLE, OH)
AMEDISYS HOME HEALTH (Home Health Center, about 3 miles away; SAINT CLAIRSVILLE, OH)
FOX RUN HOSPITAL (Hospital, about 3 miles away; ST CLAIRSVILLE, OH)
ART INC-AIRPORT ROAD HOME (Hospital, about 5 miles away; SAINT CLAIRSVILLE, OH)
ST. CLAIRSVILLE PUBLIC LIBRARY (Operating income: $536,237; Location: 108 W. MAIN ST.; 50,080 books; 337 e-books; 2,297 audio materials; 3,778 video materials; 9 local licensed databases; 266 state licensed databases; 111 print serial subscriptions; 1 electronic serial subscriptions)
Notable locations in St. Clairsville: Tellesburg Siding (A), Belmont County Fire Station 23 Cumberland Trail Fire and Emergency Medical Services Station 1 (B), Belmont County Courthouse (C), Belmont County Law Library (D). Display/hide their locations on the map
Churches in St. Clairsville include: Calvary United Presbyterian Church (A), First Baptist Church (B), First Christian Church (C), First Presbyterian Church (D), Mount Pisgah African Methodist Episcopal Church (E), Saint Marys Roman Catholic Church (F), Thoburn United Methodist Church (G). Display/hide their locations on the map
Birthplace of: Jeremy Sowers - Major League baseball player, Sylvester Antolak - Army Medal of Honor recipient, Thomas Eckert - Chief, Cydnor B. Tompkins - Politician, Frederick F. Faris - Architect, George W. Thompson - Politician, Jim Bradshaw - Football player.
Belmont County has a predicted average indoor radon screening level greater than 4 pCi/L (pico curies per liter) - Highest Potential
Drinking water stations with addresses in St. Clairsville and their reported violations in the past:
Treatment Technique (SWTR and GWR) - In MAR-2013, Contaminant: GROUNDWATER RULE. Follow-up actions: St Compliance achieved (APR-01-2013), St Public Notif requested (MAY-09-2013), St Formal NOV issued (MAY-09-2013), St Public Notif received (JUN-06-2013)
Past monitoring violations:
Monitoring, Repeat Major (TCR) - Between JAN-2005 and MAR-2005, Contaminant: Coliform (TCR). Follow-up actions: St Public Notif requested (MAY-04-2005), St Formal NOV issued (MAY-04-2005), St Compliance achieved (MAY-05-2005), St Public Notif received (FEB-21-2013)
One routine major monitoring violation
Drinking water stations with addresses in St. Clairsville that have no violations reported:
BELMONT CO. SANITARY DISTRICT 3 PWS (Population served: 24,387,Primary Water Source Type: Groundwater)
BELMONT CO. SEWER DISTRICT 1B PWS (Population served: 1,379,Primary Water Source Type: Purch groundwater)
KAMMER PLANT (Address: 50701 REHM ROAD , Serves WV, Population served: 250,Primary Water Source Type: Groundwater)
Average household size:
This city:
2.1 people
Ohio:
2.4 people
Percentage of family households:
This city:
59.0%
Whole state:
65.0%
Percentage of households with unmarried partners:
This city:
4.7%
Whole state:
6.8%
Likely homosexual households (counted as self-reported same-sex unmarried-partner households)
Lesbian couples: 0.3% of all households
Gay men: 0.3% of all households
People in group quarters in St. Clairsville in 2010:
162 people in nursing facilities/skilled-nursing facilities
6 people in group homes intended for adults
4 people in other noninstitutional facilities
114 people in nursing homes in 2000
9 people in training schools for juvenile delinquents in 2000
Banks with branches in St. Clairsville (2011 data):
The Huntington National Bank: St. Clairsville Main Branch at 154 West Main Street, branch established on 1995/12/11. Info updated 2012/04/02: Bank assets: $54,183.4 mil, Deposits: $44,300.3 mil, headquarters in Columbus, OH, positive income, Commercial Lending Specialization, 878 total offices, Holding Company: Huntington Bancshares Incorporated
PNC Bank, National Association: St. Clairsville Branch at 199 West Main Street, branch established on 1977/09/29. Info updated 2012/03/20: Bank assets: $263,309.6 mil, Deposits: $197,343.0 mil, headquarters in Wilmington, DE, positive income, Commercial Lending Specialization, 3085 total offices, Holding Company: Pnc Financial Services Group, Inc., The
Belmont Savings Bank: 215 West Main Street Branch at 215 West Main Street, branch established on 1886/01/01. Info updated 2006/11/03: Bank assets: $490.2 mil, Deposits: $339.5 mil, headquarters in Bellaire, OH, positive income, Mortgage Lending Specialization, 4 total offices
The Citizens Savings Bank: Saint Clairsville Branch at 104 Plaza West, branch established on 1997/06/16. Info updated 2008/09/30: Bank assets: $414.5 mil, Deposits: $330.2 mil, headquarters in Martins Ferry, OH, positive income, Commercial Lending Specialization, 20 total offices, Holding Company: United Bancorp, Inc.
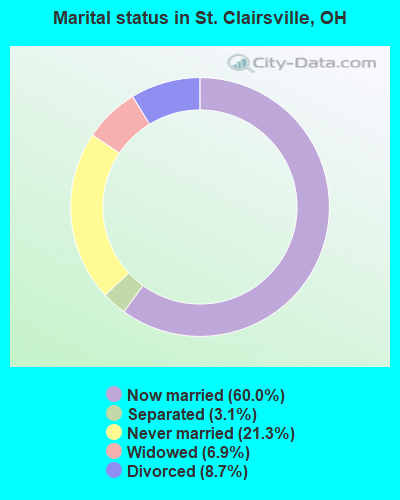
For population 15 years and over in St. Clairsville:
Never married: 21.3%
Now married: 60.0%
Separated: 3.1%
Widowed: 6.9%
Divorced: 8.7%
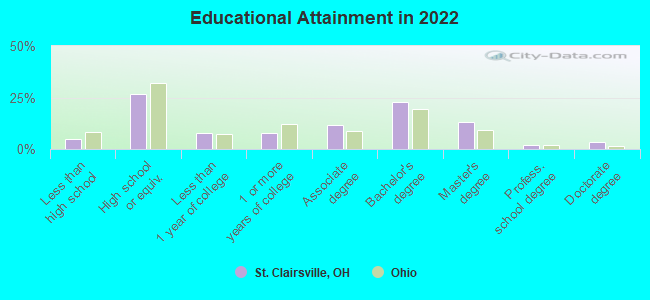
For population 25 years and over in St. Clairsville:
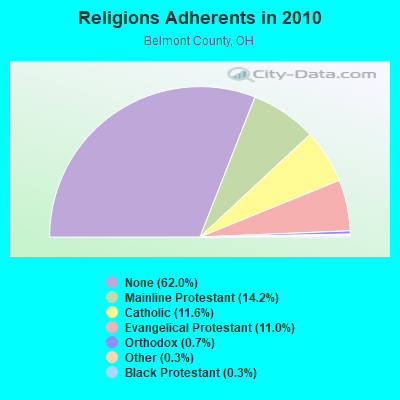
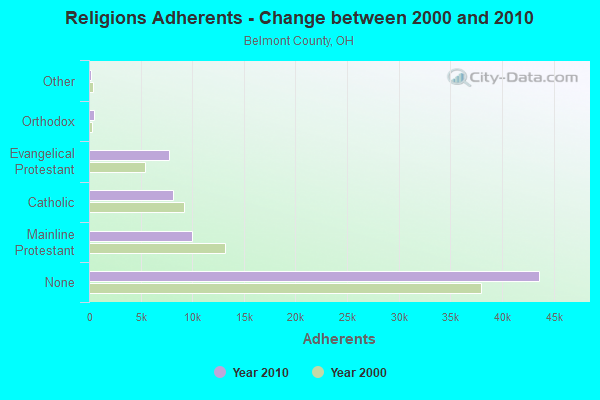
Religion statistics for St. Clairsville, OH (based on Belmont County data)
Religion
Adherents
Congregations
Mainline Protestant
10,012
66
Catholic
8,179
16
Evangelical Protestant
7,732
53
Orthodox
463
3
Other
202
5
Black Protestant
176
1
None
43,636
-
Source: Clifford Grammich, Kirk Hadaway, Richard Houseal, Dale E.Jones, Alexei Krindatch, Richie Stanley and Richard H.Taylor. 2012. 2010 U.S.Religion Census: Religious Congregations & Membership Study. Association of Statisticians of American Religious Bodies. Jones, Dale E., et al. 2002. Congregations and Membership in the United States 2000. Nashville, TN: Glenmary Research Center. Graphs represent county-level data
Call Sign: KB8YBD, Licensee ID: L00770209, Grant Date: 01/07/2015, Expiration Date: 03/01/2025, Certifier: John E Engelhardt Ii, Registrant: John E Engelhardt Ii, 67922 Mills Rd. #2, St. Clairsville, OH 43950
Call Sign: KC8IEH, Licensee ID: L00146474, Grant Date: 04/13/2017, Expiration Date: 07/09/2027, Registrant: John W Jenkins, 208 Orchard Lane, St. Clairsville, OH 43950
Call Sign: N8TOF, Previous Call Sign: KB8NQR, Licensee ID: L00675143, Grant Date: 07/26/2003, Expiration Date: 08/31/2013, Cancellation Date: 09/01/2015, Registrant: Ralph J Hadley Jr, 49080 Randal Dr. Richland Acres, St. Clairsville, OH 43950
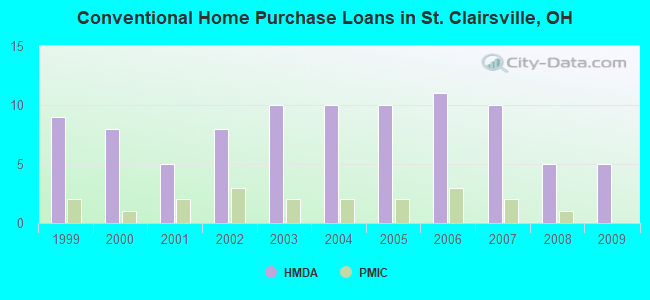
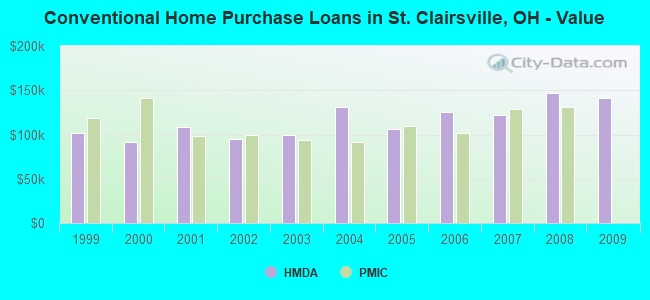
Home Mortgage Disclosure Act Aggregated Statistics For Year 2009 (Based on 2 partial tracts)
A) FHA, FSA/RHS & VA Home Purchase Loans
B) Conventional Home Purchase Loans
C) Refinancings
D) Home Improvement Loans
F) Non-occupant Loans on < 5 Family Dwellings (A B C & D)
Number
Average Value
Number
Average Value
Number
Average Value
Number
Average Value
Number
Average Value
LOANS ORIGINATED
2
$106,900
5
$141,722
11
$146,479
2
$58,510
1
$58,960
APPLICATIONS APPROVED, NOT ACCEPTED
0
$0
0
$0
0
$0
0
$0
0
$0
APPLICATIONS DENIED
0
$0
0
$0
4
$150,215
1
$33,410
0
$0
APPLICATIONS WITHDRAWN
0
$0
0
$0
1
$296,580
0
$0
0
$0
FILES CLOSED FOR INCOMPLETENESS
0
$0
0
$0
0
$0
0
$0
0
$0
Aggregated Statistics For Year 2008 (Based on 2 partial tracts)
A) FHA, FSA/RHS & VA Home Purchase Loans
B) Conventional Home Purchase Loans
C) Refinancings
D) Home Improvement Loans
F) Non-occupant Loans on < 5 Family Dwellings (A B C & D)
G) Loans On Manufactured Home Dwelling (A B C & D)
Number
Average Value
Number
Average Value
Number
Average Value
Number
Average Value
Number
Average Value
Number
Average Value
LOANS ORIGINATED
3
$134,753
5
$147,124
6
$132,377
3
$28,803
1
$77,960
0
$0
APPLICATIONS APPROVED, NOT ACCEPTED
0
$0
1
$108,860
1
$42,370
0
$0
0
$0
0
$0
APPLICATIONS DENIED
0
$0
0
$0
3
$187,647
1
$72,240
0
$0
1
$20,750
APPLICATIONS WITHDRAWN
0
$0
1
$183,200
1
$162,870
0
$0
0
$0
0
$0
FILES CLOSED FOR INCOMPLETENESS
0
$0
0
$0
0
$0
0
$0
0
$0
0
$0
Aggregated Statistics For Year 2007 (Based on 2 partial tracts)
A) FHA, FSA/RHS & VA Home Purchase Loans
B) Conventional Home Purchase Loans
C) Refinancings
D) Home Improvement Loans
F) Non-occupant Loans on < 5 Family Dwellings (A B C & D)
G) Loans On Manufactured Home Dwelling (A B C & D)
Number
Average Value
Number
Average Value
Number
Average Value
Number
Average Value
Number
Average Value
Number
Average Value
LOANS ORIGINATED
1
$133,000
10
$121,806
6
$112,247
3
$32,943
1
$140,980
0
$0
APPLICATIONS APPROVED, NOT ACCEPTED
0
$0
1
$114,170
2
$88,500
0
$0
0
$0
0
$0
APPLICATIONS DENIED
0
$0
2
$121,175
6
$89,575
2
$36,285
0
$0
1
$26,140
APPLICATIONS WITHDRAWN
1
$45,700
1
$97,930
3
$115,447
0
$0
0
$0
0
$0
FILES CLOSED FOR INCOMPLETENESS
0
$0
0
$0
1
$72,520
0
$0
0
$0
0
$0
Aggregated Statistics For Year 2006 (Based on 2 partial tracts)
A) FHA, FSA/RHS & VA Home Purchase Loans
B) Conventional Home Purchase Loans
C) Refinancings
D) Home Improvement Loans
F) Non-occupant Loans on < 5 Family Dwellings (A B C & D)
Number
Average Value
Number
Average Value
Number
Average Value
Number
Average Value
Number
Average Value
LOANS ORIGINATED
2
$111,420
11
$125,799
8
$78,522
3
$31,913
1
$66,870
APPLICATIONS APPROVED, NOT ACCEPTED
0
$0
0
$0
1
$104,710
0
$0
0
$0
APPLICATIONS DENIED
0
$0
1
$124,200
4
$120,245
1
$37,380
0
$0
APPLICATIONS WITHDRAWN
0
$0
0
$0
4
$76,298
1
$43,050
0
$0
FILES CLOSED FOR INCOMPLETENESS
0
$0
0
$0
1
$148,800
0
$0
0
$0
Aggregated Statistics For Year 2005 (Based on 2 partial tracts)
A) FHA, FSA/RHS & VA Home Purchase Loans
B) Conventional Home Purchase Loans
C) Refinancings
D) Home Improvement Loans
F) Non-occupant Loans on < 5 Family Dwellings (A B C & D)
G) Loans On Manufactured Home Dwelling (A B C & D)
Number
Average Value
Number
Average Value
Number
Average Value
Number
Average Value
Number
Average Value
Number
Average Value
LOANS ORIGINATED
1
$102,910
10
$106,196
9
$96,463
3
$29,930
1
$121,450
0
$0
APPLICATIONS APPROVED, NOT ACCEPTED
0
$0
1
$127,240
3
$56,383
0
$0
0
$0
0
$0
APPLICATIONS DENIED
0
$0
1
$96,170
4
$86,428
2
$25,770
1
$67,850
1
$21,620
APPLICATIONS WITHDRAWN
0
$0
1
$158,910
4
$90,058
1
$70,490
0
$0
0
$0
FILES CLOSED FOR INCOMPLETENESS
0
$0
0
$0
1
$107,710
0
$0
0
$0
0
$0
Aggregated Statistics For Year 2004 (Based on 2 partial tracts)
A) FHA, FSA/RHS & VA Home Purchase Loans
B) Conventional Home Purchase Loans
C) Refinancings
D) Home Improvement Loans
F) Non-occupant Loans on < 5 Family Dwellings (A B C & D)
G) Loans On Manufactured Home Dwelling (A B C & D)
Number
Average Value
Number
Average Value
Number
Average Value
Number
Average Value
Number
Average Value
Number
Average Value
LOANS ORIGINATED
1
$65,950
10
$130,730
10
$99,271
1
$53,600
2
$128,850
1
$53,270
APPLICATIONS APPROVED, NOT ACCEPTED
0
$0
2
$76,905
1
$42,710
0
$0
0
$0
0
$0
APPLICATIONS DENIED
0
$0
2
$107,585
7
$116,207
2
$34,175
0
$0
1
$33,420
APPLICATIONS WITHDRAWN
0
$0
2
$121,415
5
$88,826
0
$0
1
$88,720
0
$0
FILES CLOSED FOR INCOMPLETENESS
0
$0
1
$89,590
1
$127,790
0
$0
0
$0
0
$0
Aggregated Statistics For Year 2003 (Based on 2 partial tracts)
A) FHA, FSA/RHS & VA Home Purchase Loans
B) Conventional Home Purchase Loans
C) Refinancings
D) Home Improvement Loans
F) Non-occupant Loans on < 5 Family Dwellings (A B C & D)
Number
Average Value
Number
Average Value
Number
Average Value
Number
Average Value
Number
Average Value
LOANS ORIGINATED
1
$113,970
10
$99,869
22
$91,788
1
$46,990
2
$74,485
APPLICATIONS APPROVED, NOT ACCEPTED
0
$0
0
$0
2
$101,755
0
$0
0
$0
APPLICATIONS DENIED
0
$0
2
$48,745
4
$92,785
1
$11,240
0
$0
APPLICATIONS WITHDRAWN
0
$0
2
$81,950
4
$91,940
0
$0
0
$0
FILES CLOSED FOR INCOMPLETENESS
0
$0
0
$0
1
$76,170
0
$0
0
$0
Aggregated Statistics For Year 2002 (Based on 2 partial tracts)
A) FHA, FSA/RHS & VA Home Purchase Loans
B) Conventional Home Purchase Loans
C) Refinancings
D) Home Improvement Loans
F) Non-occupant Loans on < 5 Family Dwellings (A B C & D)
Number
Average Value
Number
Average Value
Number
Average Value
Number
Average Value
Number
Average Value
LOANS ORIGINATED
1
$71,960
8
$94,429
18
$93,523
2
$34,005
1
$112,800
APPLICATIONS APPROVED, NOT ACCEPTED
0
$0
0
$0
2
$128,895
0
$0
0
$0
APPLICATIONS DENIED
0
$0
1
$57,240
5
$82,770
0
$0
0
$0
APPLICATIONS WITHDRAWN
0
$0
1
$174,100
2
$112,720
0
$0
0
$0
FILES CLOSED FOR INCOMPLETENESS
0
$0
0
$0
1
$99,720
0
$0
0
$0
Aggregated Statistics For Year 2001 (Based on 2 partial tracts)
A) FHA, FSA/RHS & VA Home Purchase Loans
B) Conventional Home Purchase Loans
C) Refinancings
D) Home Improvement Loans
F) Non-occupant Loans on < 5 Family Dwellings (A B C & D)
Number
Average Value
Number
Average Value
Number
Average Value
Number
Average Value
Number
Average Value
LOANS ORIGINATED
1
$53,850
5
$108,242
15
$86,361
2
$18,255
1
$85,360
APPLICATIONS APPROVED, NOT ACCEPTED
0
$0
1
$32,260
1
$65,150
0
$0
0
$0
APPLICATIONS DENIED
0
$0
1
$31,720
6
$68,363
1
$5,260
0
$0
APPLICATIONS WITHDRAWN
0
$0
0
$0
2
$101,720
0
$0
0
$0
FILES CLOSED FOR INCOMPLETENESS
0
$0
0
$0
0
$0
0
$0
0
$0
Aggregated Statistics For Year 2000 (Based on 2 partial tracts)
A) FHA, FSA/RHS & VA Home Purchase Loans
B) Conventional Home Purchase Loans
C) Refinancings
D) Home Improvement Loans
F) Non-occupant Loans on < 5 Family Dwellings (A B C & D)
Number
Average Value
Number
Average Value
Number
Average Value
Number
Average Value
Number
Average Value
LOANS ORIGINATED
1
$61,890
8
$91,301
5
$62,870
2
$12,420
1
$21,740
APPLICATIONS APPROVED, NOT ACCEPTED
0
$0
1
$90,510
1
$71,840
0
$0
0
$0
APPLICATIONS DENIED
0
$0
3
$51,220
4
$41,602
1
$11,970
0
$0
APPLICATIONS WITHDRAWN
0
$0
1
$42,370
1
$73,460
0
$0
0
$0
FILES CLOSED FOR INCOMPLETENESS
0
$0
0
$0
0
$0
0
$0
0
$0
Aggregated Statistics For Year 1999 (Based on 2 partial tracts)
B) Conventional Home Purchase Loans
C) Refinancings
D) Home Improvement Loans
F) Non-occupant Loans on < 5 Family Dwellings (A B C & D)
Detailed PMIC statistics for the following Tracts:0122.00
, 0123.00
2002 - 2011 National Fire Incident Reporting System (NFIRS) incidents
Based on the data from the years 2002 - 2011 the average number of fires per year is 33. The highest number of fire incidents - 54 took place in 2005, and the least - 12 in 2008. The data has a dropping trend.
When looking into fire subcategories, the most incidents belonged to: Structure Fires (46.8%), and Mobile Property/Vehicle Fires (28.3%).
Fire incident types reported to NFIRS in St. Clairsville, OH
#9 on the list of "Top 101 cities with the most users submitting photos to our site per 10,000 residents (population 5,000+)"
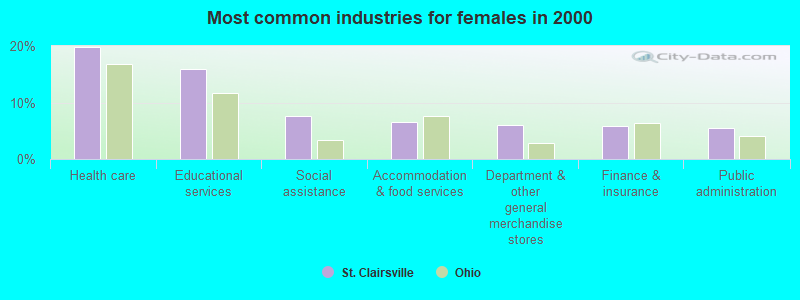
#31 on the list of "Top 101 cities with largest percentage of females in occupations: health diagnosing and treating practitioners and other technical occupations (population 5,000+)"
#19 on the list of "Top 101 counties with the highest number of deaths per 1000 residents 2007-2013 (pop. 50,000+)"
#41 on the list of "Top 101 counties with the highest Sulfur Oxides Annual air pollution readings in 2012 (µg/m3)"
#70 on the list of "Top 101 counties with the lowest percentage of residents relocating to other counties in 2011"
#85 on the list of "Top 101 counties with the lowest percentage of residents relocating from other counties between 2010 and 2011 (pop. 50,000+)"
#96 on the list of "Top 101 counties with the lowest surface withdrawal of fresh water for public supply (pop. 50,000+)"


 Recent articles from our blog. Our writers, many of them Ph.D. graduates or candidates, create easy-to-read articles on a wide variety of topics.

 (54.8 miles


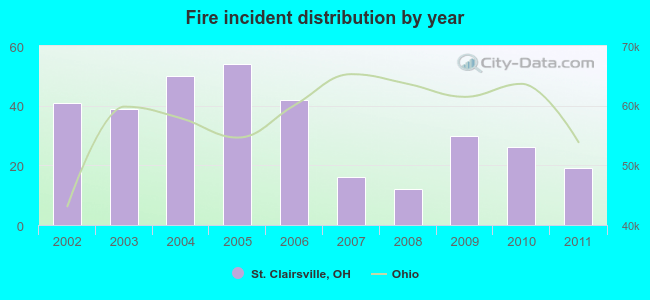 Based on the data from the years 2002 - 2011 the average number of fires per year is 33. The highest number of fire incidents - 54 took place in 2005, and the least - 12 in 2008. The data has a dropping trend.
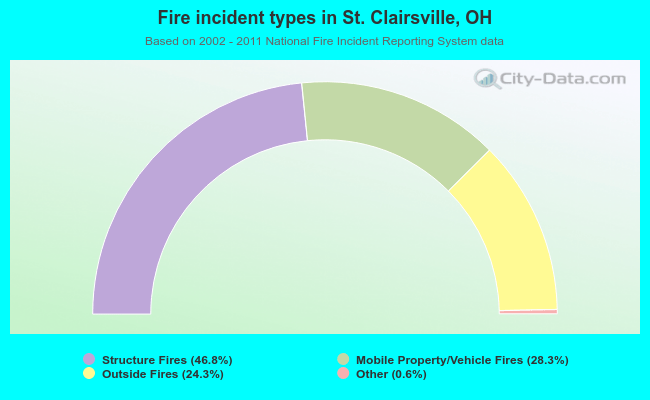 When looking into fire subcategories, the most incidents belonged to: Structure Fires (46.8%), and Mobile Property/Vehicle Fires (28.3%).