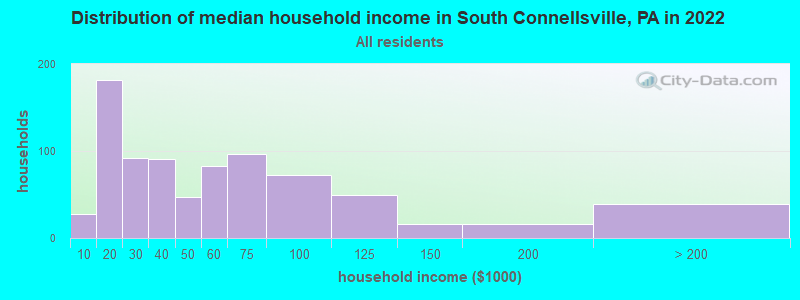
Percentage of residents living in poverty in 2022: 24.0%
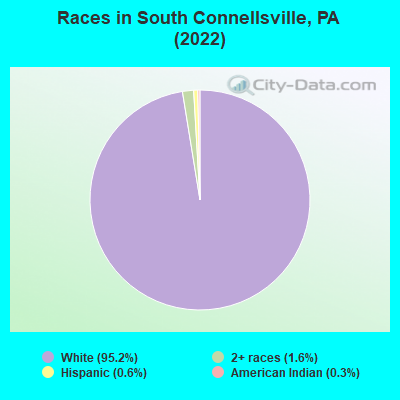
(23.7% for White Non-Hispanic residents, 72.7% for Hispanic or Latino residents, 100.0% for other race residents, 34.0% for two or more races residents)
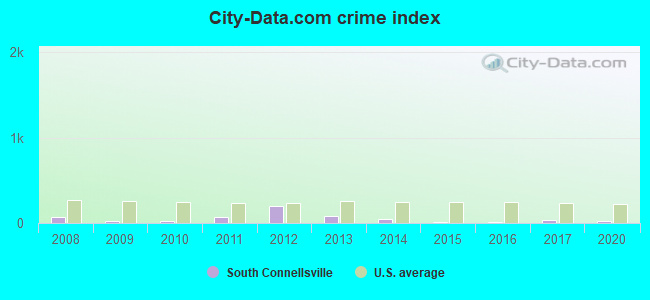
The City-Data.com crime index weighs serious crimes and violent crimes more heavily. Higher means more crime, U.S. average is 246.1. It adjusts for the number of visitors and daily workers commuting into cities.
Latest news from South Connellsville, PA collected exclusively by city-data.com from local newspapers, TV, and radio stations
Ancestries: German (32.2%), Irish (19.9%), American (17.4%), English (6.0%), Slovak (5.3%), Polish (3.8%).
Current Local Time: EST time zone
Incorporated on 11/15/1910
Elevation: 1034 feet
Land area: 1.68 square miles.
Population density: 1,116 people per square mile (low).
5 residents are foreign born
This borough:
0.3%
Pennsylvania:
7.3%
Median real estate property taxes paid for housing units with mortgages in 2022: $1,237 (1.5%) Median real estate property taxes paid for housing units with no mortgage in 2022: $977 (1.2%)
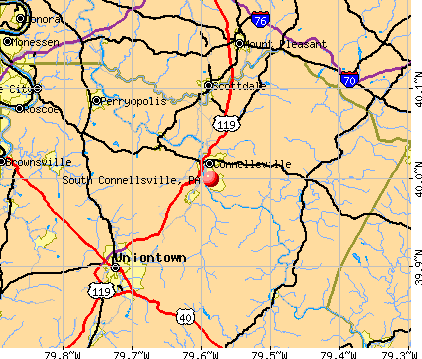
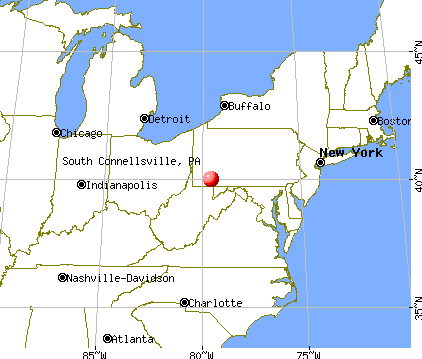
Nearest city with pop. 50,000+: Pittsburgh, PA (37.0 miles , pop. 334,563).
Nearest city with pop. 1,000,000+: Philadelphia, PA (235.3 miles , pop. 1,517,550).
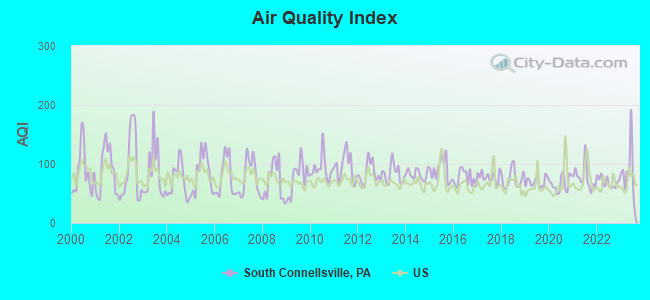
Air Quality Index (AQI) level in 2023 was 84.0. This is about average.
City:
84.0
U.S.:
72.6
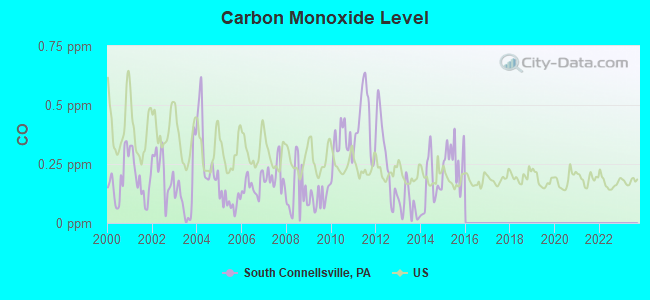
Carbon Monoxide (CO) [ppm] level in 2015 was 0.273. This is about average.Closest monitor was 19.6 miles away from the city center.
City:
0.273
U.S.:
0.251
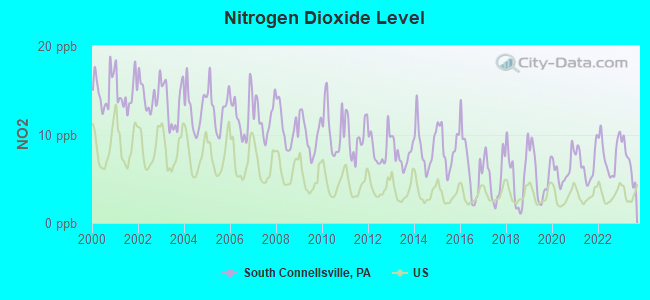
Nitrogen Dioxide (NO2) [ppb] level in 2023 was 7.00. This is worse than average.Closest monitor was 19.6 miles away from the city center.
City:
7.00
U.S.:
5.11
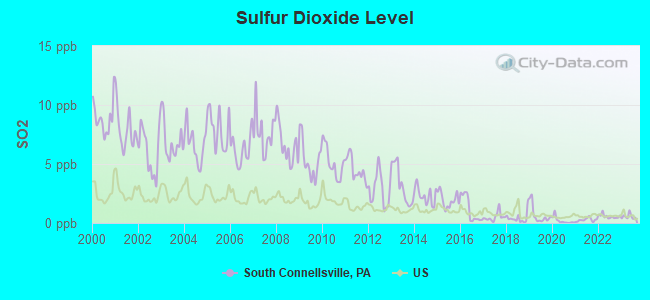
Sulfur Dioxide (SO2) [ppb] level in 2023 was 0.550. This is significantly better than average.Closest monitor was 18.6 miles away from the city center.
City:
0.550
U.S.:
1.515
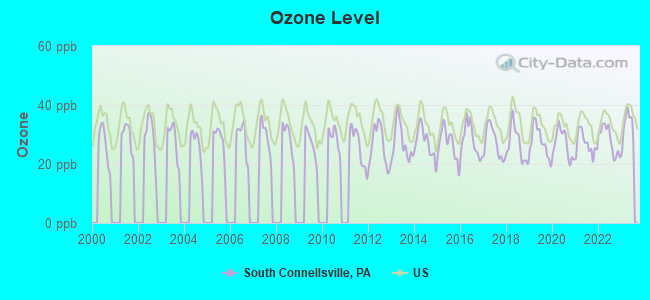
Ozone [ppb] level in 2023 was 32.9. This is about average.Closest monitor was 12.9 miles away from the city center.
City:
32.9
U.S.:
33.3
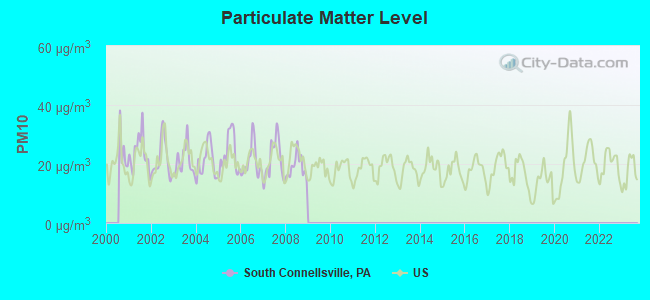
Particulate Matter (PM10) [µg/m3] level in 2008 was 18.9. This is about average.Closest monitor was 19.2 miles away from the city center.
City:
18.9
U.S.:
19.2
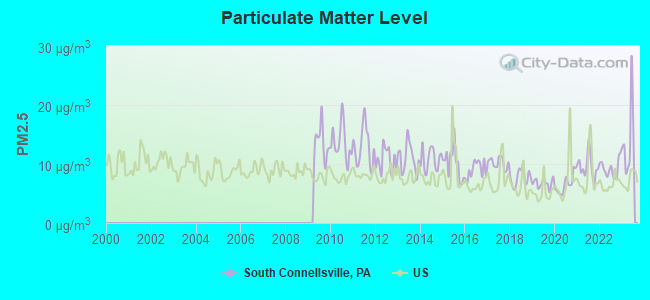
Particulate Matter (PM2.5) [µg/m3] level in 2023 was 13.9. This is significantly worse than average.Closest monitor was 19.6 miles away from the city center.
City:
13.9
U.S.:
8.1
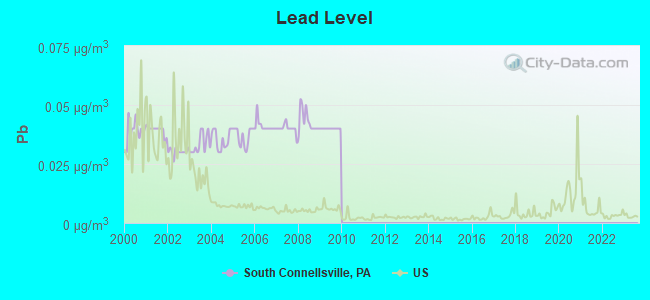
Lead (Pb) [µg/m3] level in 2009 was 0.0400. This is significantly worse than average.Closest monitor was 16.2 miles away from the city center.
City:
0.0400
U.S.:
0.0093
Tornado activity:
South Connellsville-area historical tornado activity is slightly below Pennsylvania state average. It is 39% smaller than the overall U.S. average.
On 6/2/1998, a category F4 (max. wind speeds 207-260 mph) tornado 19.7 miles away from the South Connellsville borough center injured 5 peopleand caused $6 million in damages.
On 6/3/1980, a category F4 tornado 40.5 miles away from the borough center injured 140 peopleand causedbetween $50,000,000 and $500,000,000 in damages.
Earthquake activity:
South Connellsville-area historical earthquake activity is significantly above Pennsylvania state average. It is 48% smaller than the overall U.S. average.
On 8/23/2011 at 17:51:04, a magnitude 5.8 (5.8 MW, Depth: 3.7 mi, Class: Moderate, Intensity: VI - VII) earthquake occurred 169.5 miles away from South Connellsville center On 9/25/1998 at 19:52:52, a magnitude 5.2 (4.8 MB, 4.3 MS, 5.2 LG, 4.5 MW, Depth: 3.1 mi) earthquake occurred 111.6 miles away from South Connellsville center On 1/31/1986 at 16:46:43, a magnitude 5.0 (5.0 MB) earthquake occurred 138.2 miles away from the city center On 7/27/1980 at 18:52:21, a magnitude 5.2 (5.1 MB, 4.7 MS, 5.0 UK, 5.2 UK) earthquake occurred 264.7 miles away from South Connellsville center On 8/9/2020 at 12:07:37, a magnitude 5.1 (5.1 MW, Depth: 4.7 mi) earthquake occurred 257.0 miles away from South Connellsville center On 8/25/2011 at 05:07:52, a magnitude 4.5 (4.5 ML, Depth: 4.2 mi, Class: Light, Intensity: IV - V) earthquake occurred 166.4 miles away from South Connellsville center Magnitude types: regional Lg-wave magnitude (LG), body-wave magnitude (MB), local magnitude (ML), surface-wave magnitude (MS), moment magnitude (MW)
Natural disasters:
The number of natural disasters in Fayette County (15) is near the US average (15). Major Disasters (Presidential) Declared: 10 Emergencies Declared: 5
Causes of natural disasters: Floods: 4, Snowstorms: 4, Winter Storms: 4, Storms: 3, Hurricanes: 2, Blizzard: 1, Snowfall: 1, Tornado: 1, Tropical Storm: 1, Other: 1 (Note: some incidents may be assigned to more than one category).
Hospitals and medical centers near South Connellsville:
HIGHLANDS HOSPITAL Acute Care Hospitals (about 2 miles away; CONNELLSVILLE, PA)
INTERIM HEALTHCARE OF UNIONTOWN (Home Health Center, about 8 miles away; LEMONT FURNACE, PA)
ABBY HEALTH CARE INC (Home Health Center, about 8 miles away; UNIONTOWN, PA)
SCOTTDALE MANOR REHABILITATION (Nursing Home, about 9 miles away; SCOTTDALE, PA)
WESTVIEW NURSING HOME (Nursing Home, about 9 miles away; SCOTTDALE, PA)
LAUREL RIDGE CENTER (Nursing Home, about 10 miles away; UNIONTOWN, PA)
ALBERT GALLATIN SERVICES CORPORATION (Home Health Center, about 11 miles away; UNIONTOWN, PA)
Amtrak station near South Connellsville:
2 miles: CONNELLSVILLE (FRONT & WATER STS.) . Services: enclosed waiting area, public payphones, free short-term parking, call for taxi service, public transit connection.
Colleges/universities with over 2000 students nearest to South Connellsville:
Westmoreland County Community College (about 17 miles; Youngwood, PA; Full-time enrollment: 4,669)
California University of Pennsylvania (about 17 miles; California, PA; FT enrollment: 7,773)
Seton Hill University (about 22 miles; Greensburg, PA; FT enrollment: 2,167)
West Virginia University (about 32 miles; Morgantown, WV; FT enrollment: 27,429)
Waynesburg University (about 33 miles; Waynesburg, PA; FT enrollment: 2,080)
Carnegie Mellon University (about 37 miles; Pittsburgh, PA; FT enrollment: 14,186)
Wyo Tech-Blairsville (about 37 miles; Blairsville, PA; FT enrollment: 2,602)
Fayette County has a predicted average indoor radon screening level between 2 and 4 pCi/L (pico curies per liter) - Moderate Potential
Average household size:
This borough:
2.4 people
Pennsylvania:
2.5 people
Percentage of family households:
This borough:
67.7%
Whole state:
65.0%
Percentage of households with unmarried partners:
This borough:
9.9%
Whole state:
6.6%
Likely homosexual households (counted as self-reported same-sex unmarried-partner households)
Lesbian couples: 0.1% of all households
Gay men: 0.2% of all households
24 people in nursing facilities/skilled-nursing facilities in 2010
23 people in other noninstitutional group quarters in 2000
7 people in short-term care, detention or diagnostic centers for delinquent children in 2000
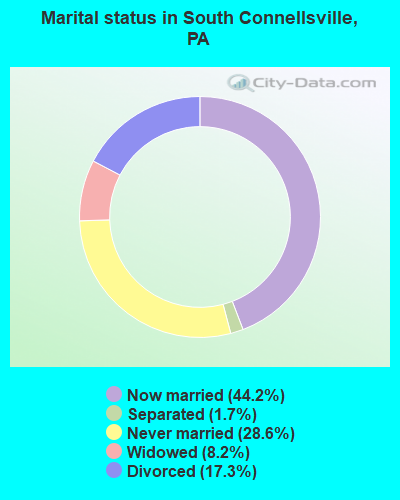
For population 15 years and over in South Connellsville:
Never married: 28.6%
Now married: 44.2%
Separated: 1.7%
Widowed: 8.2%
Divorced: 17.3%
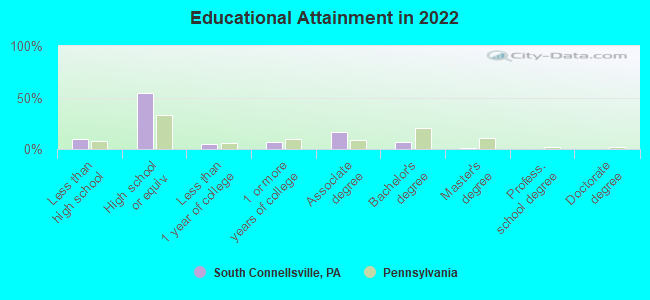
For population 25 years and over in South Connellsville:
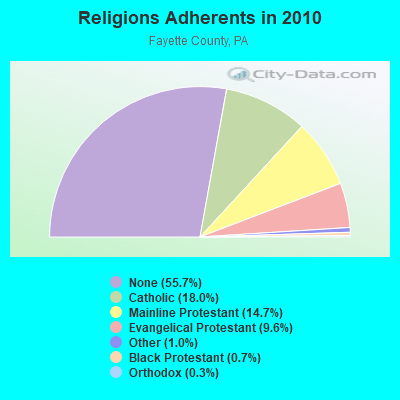
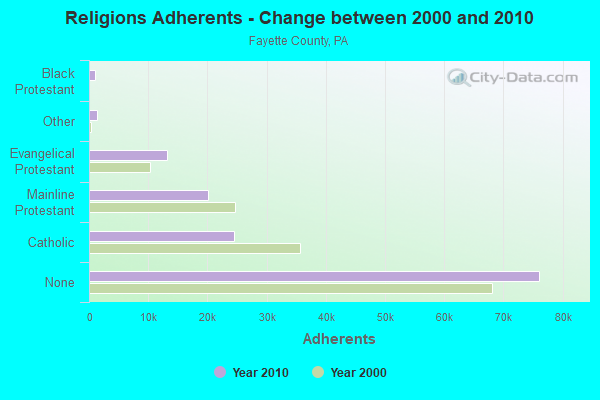
Religion statistics for South Connellsville, PA (based on Fayette County data)
Religion
Adherents
Congregations
Catholic
24,544
29
Mainline Protestant
20,117
103
Evangelical Protestant
13,148
109
Other
1,434
9
Black Protestant
931
8
Orthodox
344
6
None
76,088
-
Source: Clifford Grammich, Kirk Hadaway, Richard Houseal, Dale E.Jones, Alexei Krindatch, Richie Stanley and Richard H.Taylor. 2012. 2010 U.S.Religion Census: Religious Congregations & Membership Study. Association of Statisticians of American Religious Bodies. Jones, Dale E., et al. 2002. Congregations and Membership in the United States 2000. Nashville, TN: Glenmary Research Center. Graphs represent county-level data
Call Sign: K3NGY, Grant Date: 06/13/1997, Expiration Date: 06/13/2007, Cancellation Date: 06/16/2009, Registrant: Charles B Dynes, 1505 Chestnut St, South Connellsville, PA 15425
Call Sign: K3UUB, Licensee ID: L00984801, Grant Date: 05/08/2015, Expiration Date: 05/15/2025, Certifier: Pauline A Dynes, Registrant: Pauline A Dynes, 1505 Chestnut St, South Connellsville, PA 15425
Call Sign: KA3YGL, Licensee ID: L00310651, Grant Date: 05/19/2021, Expiration Date: 08/06/2031, Certifier: Bruce M Bigam, Registrant: Bruce M Bigam, 409 Reidmore Rd, South Connellsville, PA 15425
Home Mortgage Disclosure Act Aggregated Statistics For Year 2009 (Based on 1 partial tract)
A) FHA, FSA/RHS & VA Home Purchase Loans
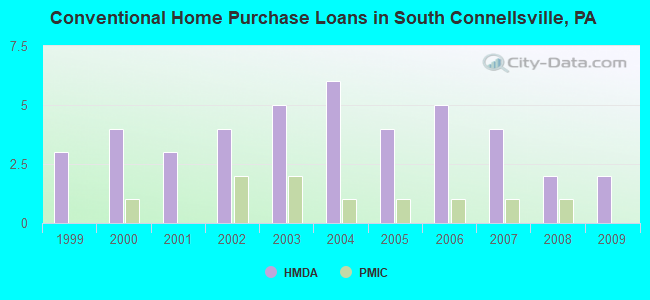
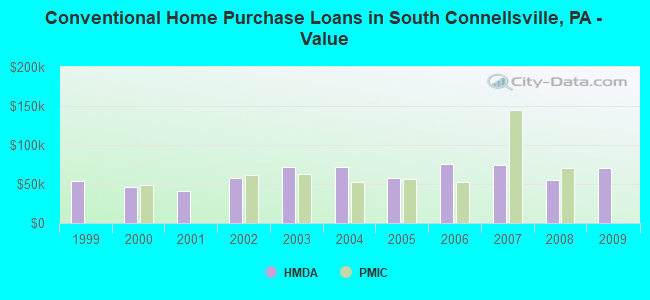
B) Conventional Home Purchase Loans
C) Refinancings
D) Home Improvement Loans
F) Non-occupant Loans on < 5 Family Dwellings (A B C & D)
Number
Average Value
Number
Average Value
Number
Average Value
Number
Average Value
Number
Average Value
LOANS ORIGINATED
1
$110,910
2
$70,605
3
$104,927
2
$25,160
1
$23,030
APPLICATIONS APPROVED, NOT ACCEPTED
0
$0
0
$0
1
$83,080
0
$0
0
$0
APPLICATIONS DENIED
0
$0
0
$0
4
$81,060
2
$19,605
0
$0
APPLICATIONS WITHDRAWN
0
$0
0
$0
3
$106,297
0
$0
0
$0
FILES CLOSED FOR INCOMPLETENESS
0
$0
0
$0
0
$0
0
$0
0
$0
Aggregated Statistics For Year 2008 (Based on 1 partial tract)
A) FHA, FSA/RHS & VA Home Purchase Loans
B) Conventional Home Purchase Loans
C) Refinancings
D) Home Improvement Loans
F) Non-occupant Loans on < 5 Family Dwellings (A B C & D)
Number
Average Value
Number
Average Value
Number
Average Value
Number
Average Value
Number
Average Value
LOANS ORIGINATED
1
$116,540
2
$55,730
4
$87,298
2
$25,160
1
$70,610
APPLICATIONS APPROVED, NOT ACCEPTED
0
$0
1
$31,120
1
$26,600
0
$0
0
$0
APPLICATIONS DENIED
0
$0
1
$32,900
6
$74,765
2
$52,305
0
$0
APPLICATIONS WITHDRAWN
0
$0
0
$0
2
$136,415
0
$0
0
$0
FILES CLOSED FOR INCOMPLETENESS
0
$0
0
$0
0
$0
0
$0
0
$0
Aggregated Statistics For Year 2007 (Based on 1 partial tract)
A) FHA, FSA/RHS & VA Home Purchase Loans
B) Conventional Home Purchase Loans
C) Refinancings
D) Home Improvement Loans
F) Non-occupant Loans on < 5 Family Dwellings (A B C & D)
G) Loans On Manufactured Home Dwelling (A B C & D)
Number
Average Value
Number
Average Value
Number
Average Value
Number
Average Value
Number
Average Value
Number
Average Value
LOANS ORIGINATED
1
$83,360
4
$74,138
5
$79,956
4
$30,642
2
$24,745
1
$40,440
APPLICATIONS APPROVED, NOT ACCEPTED
0
$0
0
$0
2
$95,765
1
$13,850
0
$0
0
$0
APPLICATIONS DENIED
0
$0
2
$71,430
11
$79,942
4
$21,285
1
$33,730
1
$57,440
APPLICATIONS WITHDRAWN
0
$0
0
$0
3
$90,167
0
$0
0
$0
0
$0
FILES CLOSED FOR INCOMPLETENESS
0
$0
0
$0
1
$137,370
0
$0
0
$0
0
$0
Aggregated Statistics For Year 2006 (Based on 1 partial tract)
A) FHA, FSA/RHS & VA Home Purchase Loans
B) Conventional Home Purchase Loans
C) Refinancings
D) Home Improvement Loans
G) Loans On Manufactured Home Dwelling (A B C & D)
Number
Average Value
Number
Average Value
Number
Average Value
Number
Average Value
Number
Average Value
LOANS ORIGINATED
1
$54,570
5
$76,064
6
$71,223
5
$23,472
0
$0
APPLICATIONS APPROVED, NOT ACCEPTED
0
$0
1
$59,640
1
$30,300
1
$11,930
0
$0
APPLICATIONS DENIED
0
$0
2
$70,265
11
$67,653
2
$34,755
1
$81,850
APPLICATIONS WITHDRAWN
0
$0
0
$0
5
$66,328
0
$0
0
$0
FILES CLOSED FOR INCOMPLETENESS
0
$0
1
$26,870
1
$46,610
0
$0
0
$0
Aggregated Statistics For Year 2005 (Based on 1 partial tract)
A) FHA, FSA/RHS & VA Home Purchase Loans
B) Conventional Home Purchase Loans
C) Refinancings
D) Home Improvement Loans
F) Non-occupant Loans on < 5 Family Dwellings (A B C & D)
G) Loans On Manufactured Home Dwelling (A B C & D)
Number
Average Value
Number
Average Value
Number
Average Value
Number
Average Value
Number
Average Value
Number
Average Value
LOANS ORIGINATED
2
$71,980
4
$57,685
8
$59,108
3
$27,787
1
$35,650
1
$35,230
APPLICATIONS APPROVED, NOT ACCEPTED
0
$0
1
$54,840
3
$65,763
1
$20,020
0
$0
0
$0
APPLICATIONS DENIED
0
$0
2
$53,675
12
$78,478
3
$24,540
1
$29,750
0
$0
APPLICATIONS WITHDRAWN
0
$0
0
$0
6
$83,152
1
$130,520
0
$0
0
$0
FILES CLOSED FOR INCOMPLETENESS
0
$0
0
$0
1
$117,630
0
$0
0
$0
0
$0
Aggregated Statistics For Year 2004 (Based on 1 partial tract)
A) FHA, FSA/RHS & VA Home Purchase Loans
B) Conventional Home Purchase Loans
C) Refinancings
D) Home Improvement Loans
F) Non-occupant Loans on < 5 Family Dwellings (A B C & D)
G) Loans On Manufactured Home Dwelling (A B C & D)
Number
Average Value
Number
Average Value
Number
Average Value
Number
Average Value
Number
Average Value
Number
Average Value
LOANS ORIGINATED
1
$92,820
6
$71,360
10
$70,634
4
$26,185
1
$29,070
1
$55,800
APPLICATIONS APPROVED, NOT ACCEPTED
0
$0
1
$49,900
3
$57,810
1
$20,840
0
$0
1
$18,100
APPLICATIONS DENIED
0
$0
2
$67,865
16
$72,432
3
$35,417
0
$0
1
$78,150
APPLICATIONS WITHDRAWN
0
$0
1
$46,340
6
$73,257
1
$32,080
0
$0
0
$0
FILES CLOSED FOR INCOMPLETENESS
0
$0
0
$0
3
$96,473
0
$0
0
$0
0
$0
Aggregated Statistics For Year 2003 (Based on 1 partial tract)
A) FHA, FSA/RHS & VA Home Purchase Loans
B) Conventional Home Purchase Loans
C) Refinancings
D) Home Improvement Loans
F) Non-occupant Loans on < 5 Family Dwellings (A B C & D)
Number
Average Value
Number
Average Value
Number
Average Value
Number
Average Value
Number
Average Value
LOANS ORIGINATED
1
$56,070
5
$71,402
15
$70,743
2
$31,600
1
$37,700
APPLICATIONS APPROVED, NOT ACCEPTED
0
$0
1
$42,780
6
$61,855
2
$30,915
0
$0
APPLICATIONS DENIED
0
$0
3
$44,053
14
$68,246
4
$24,508
1
$37,980
APPLICATIONS WITHDRAWN
0
$0
1
$71,700
8
$70,075
1
$17,550
0
$0
FILES CLOSED FOR INCOMPLETENESS
0
$0
0
$0
1
$52,370
0
$0
0
$0
Aggregated Statistics For Year 2002 (Based on 1 partial tract)
A) FHA, FSA/RHS & VA Home Purchase Loans
B) Conventional Home Purchase Loans
C) Refinancings
D) Home Improvement Loans
Number
Average Value
Number
Average Value
Number
Average Value
Number
Average Value
LOANS ORIGINATED
1
$39,760
4
$57,272
12
$63,020
3
$24,357
APPLICATIONS APPROVED, NOT ACCEPTED
0
$0
1
$25,090
4
$64,438
0
$0
APPLICATIONS DENIED
0
$0
3
$42,090
13
$62,106
3
$15,813
APPLICATIONS WITHDRAWN
0
$0
0
$0
4
$79,552
1
$6,720
FILES CLOSED FOR INCOMPLETENESS
0
$0
0
$0
1
$72,940
0
$0
Aggregated Statistics For Year 2001 (Based on 1 partial tract)
A) FHA, FSA/RHS & VA Home Purchase Loans
B) Conventional Home Purchase Loans
C) Refinancings
D) Home Improvement Loans
F) Non-occupant Loans on < 5 Family Dwellings (A B C & D)
Number
Average Value
Number
Average Value
Number
Average Value
Number
Average Value
Number
Average Value
LOANS ORIGINATED
1
$82,260
3
$41,267
12
$56,873
5
$19,934
1
$29,890
APPLICATIONS APPROVED, NOT ACCEPTED
0
$0
0
$0
5
$52,152
2
$27,830
0
$0
APPLICATIONS DENIED
0
$0
3
$39,027
12
$53,058
5
$17,248
0
$0
APPLICATIONS WITHDRAWN
0
$0
0
$0
4
$58,610
1
$33,320
0
$0
FILES CLOSED FOR INCOMPLETENESS
0
$0
0
$0
1
$80,200
0
$0
0
$0
Aggregated Statistics For Year 2000 (Based on 1 partial tract)
A) FHA, FSA/RHS & VA Home Purchase Loans
B) Conventional Home Purchase Loans
C) Refinancings
D) Home Improvement Loans
F) Non-occupant Loans on < 5 Family Dwellings (A B C & D)
Number
Average Value
Number
Average Value
Number
Average Value
Number
Average Value
Number
Average Value
LOANS ORIGINATED
2
$48,260
4
$46,545
8
$51,155
4
$18,920
1
$21,660
APPLICATIONS APPROVED, NOT ACCEPTED
0
$0
1
$49,490
4
$61,250
2
$23,305
0
$0
APPLICATIONS DENIED
0
$0
2
$53,330
9
$66,204
3
$16,270
0
$0
APPLICATIONS WITHDRAWN
0
$0
1
$22,900
2
$49,355
1
$7,130
0
$0
FILES CLOSED FOR INCOMPLETENESS
0
$0
0
$0
1
$77,600
0
$0
0
$0
Aggregated Statistics For Year 1999 (Based on 1 partial tract)
A) FHA, FSA/RHS & VA Home Purchase Loans
B) Conventional Home Purchase Loans
C) Refinancings
D) Home Improvement Loans
F) Non-occupant Loans on < 5 Family Dwellings (A B C & D)
#79 on the list of "Top 101 cities with the largest percentage of people in short-term care, detention or diagnostic centers for delinquent children (population 1,000+)"
#8 on the list of "Top 101 counties with the lowest percentage of residents relocating to other counties in 2011"
#11 on the list of "Top 101 counties with the lowest percentage of residents that visited a dentist within the past year"
#11 on the list of "Top 101 counties with the lowest percentage of residents that exercised in the past month"
#13 on the list of "Top 101 counties with the lowest percentage of residents relocating from other counties between 2010 and 2011"
#14 on the list of "Top 101 counties with the highest number of deaths per 1000 residents 2007-2013 (pop. 50,000+)"


 Recent articles from our blog. Our writers, many of them Ph.D. graduates or candidates, create easy-to-read articles on a wide variety of topics.

 (37.0 miles