Estimated median house or condo value in 2022: $321,580 (it was $135,200 in 2000)
South Bound Brook:
$321,580
NJ:
$428,900
Mean prices in 2022:all housing units: $579,424; detached houses: $672,183; townhouses or other attached units: $368,771; in 2-unit structures: $336,165; in 3-to-4-unit structures: $240,497; in 5-or-more-unit structures: $259,391; mobile homes: $90,000
Median gross rent in 2022: $1,617.
March 2022 cost of living index in South Bound Brook: 119.3 (more than average, U.S. average is 100)
Percentage of residents living in poverty in 2022: 7.9%
(13.6% for White Non-Hispanic residents, 0.1% for Black residents, 5.9% for Hispanic or Latino residents, 9.4% for other race residents, 1.3% for two or more races residents)
According to our research of New Jersey and other state lists, there was 1 registered sex offender living in South Bound Brook, New Jersey as of May 31, 2024. The ratio of all residents to sex offenders in South Bound Brook is 4,641 to 1. The ratio of registered sex offenders to all residents in this city is much lower than the state average.
Crime rates in South Bound Brook by year
Type
2009
2010
2011
2012
2013
2014
2015
2016
2017
2018
2019
2020
2021
2022
Murders (per 100,000)
0 (0.0)
0 (0.0)
0 (0.0)
0 (0.0)
0 (0.0)
0 (0.0)
0 (0.0)
0 (0.0)
0 (0.0)
0 (0.0)
0 (0.0)
0 (0.0)
0 (0.0)
0 (0.0)
Rapes (per 100,000)
0 (0.0)
0 (0.0)
0 (0.0)
0 (0.0)
0 (0.0)
0 (0.0)
0 (0.0)
0 (0.0)
1 (21.5)
2 (43.3)
0 (0.0)
0 (0.0)
1 (21.2)
0 (0.0)
Robberies (per 100,000)
0 (0.0)
0 (0.0)
0 (0.0)
2 (43.4)
0 (0.0)
1 (21.7)
0 (0.0)
4 (86.5)
0 (0.0)
1 (21.6)
1 (21.9)
1 (22.1)
0 (0.0)
0 (0.0)
Assaults (per 100,000)
1 (19.3)
2 (43.8)
2 (43.7)
0 (0.0)
1 (20.5)
0 (0.0)
0 (0.0)
2 (43.3)
2 (43.0)
1 (21.6)
0 (0.0)
1 (22.1)
0 (0.0)
1 (20.9)
Burglaries (per 100,000)
12 (231.2)
4 (87.7)
28 (611.6)
15 (325.7)
9 (184.1)
8 (173.8)
8 (174.3)
5 (108.1)
4 (86.0)
5 (108.2)
6 (131.3)
2 (44.2)
20 (423.5)
4 (83.6)
Thefts (per 100,000)
22 (423.8)
12 (263.0)
21 (458.7)
21 (455.9)
19 (388.6)
27 (586.7)
31 (675.4)
31 (670.4)
23 (494.4)
21 (454.4)
36 (787.7)
27 (596.6)
24 (508.3)
32 (668.9)
Auto thefts (per 100,000)
1 (19.3)
0 (0.0)
2 (43.7)
4 (86.8)
3 (61.4)
0 (0.0)
3 (65.4)
2 (43.3)
2 (43.0)
2 (43.3)
1 (21.9)
1 (22.1)
1 (21.2)
7 (146.3)
Arson (per 100,000)
0 (0.0)
0 (0.0)
0 (0.0)
0 (0.0)
0 (0.0)
0 (0.0)
0 (0.0)
0 (0.0)
0 (0.0)
0 (0.0)
0 (0.0)
0 (0.0)
0 (0.0)
0 (0.0)
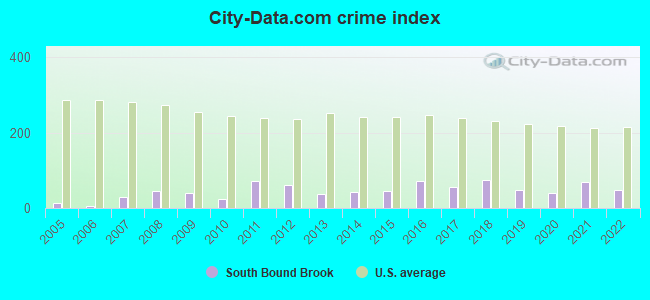
City-Data.com crime index
38.5
25.4
73.4
61.0
37.4
42.2
44.4
72.4
55.0
74.7
49.0
39.8
68.6
48.5
The City-Data.com crime index weighs serious crimes and violent crimes more heavily. Higher means more crime, U.S. average is 246.1. It adjusts for the number of visitors and daily workers commuting into cities.
Latest news from South Bound Brook, NJ collected exclusively by city-data.com from local newspapers, TV, and radio stations
Ancestries: Irish (4.0%), Italian (3.5%), Polish (3.5%), American (3.4%), German (2.3%), Guyanese (2.2%).
Current Local Time: EST time zone
Elevation: 45 feet
Land area: 0.78 square miles.
Population density: 6,203 people per square mile (high).
1,131 residents are foreign born (17.6% Latin America, 2.7% Asia).
This borough:
23.2%
New Jersey:
23.2%
Median real estate property taxes paid for housing units with mortgages in 2022: $8,610 (2.7%) Median real estate property taxes paid for housing units with no mortgage in 2022: $8,591 (2.6%)
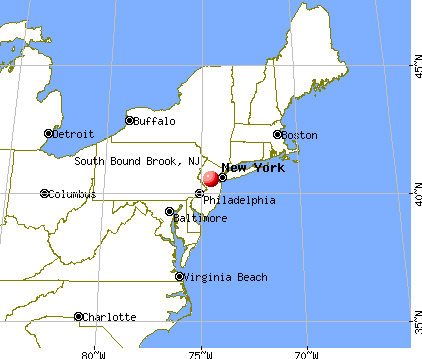
Nearest city with pop. 50,000+: Edison, NJ (8.0 miles , pop. 97,687).
Nearest city with pop. 200,000+: Staten Island, NY (20.5 miles , pop. 443,728).
Nearest city with pop. 1,000,000+: Brooklyn, NY (31.0 miles , pop. 2,465,326).
Air Quality Index (AQI) level in 2023 was 107. This is significantly worse than average.
City:
107
U.S.:
73
Carbon Monoxide (CO) [ppm] level in 2022 was 0.380. This is significantly worse than average.Closest monitor was 4.5 miles away from the city center.
City:
0.380
U.S.:
0.251
Nitrogen Dioxide (NO2) [ppb] level in 2022 was 9.83. This is significantly worse than average.Closest monitor was 5.0 miles away from the city center.
City:
9.83
U.S.:
5.11
Sulfur Dioxide (SO2) [ppb] level in 2022 was 0.545. This is significantly better than average.Closest monitor was 4.5 miles away from the city center.
City:
0.545
U.S.:
1.515
Ozone [ppb] level in 2023 was 31.3. This is about average.Closest monitor was 4.5 miles away from the city center.
City:
31.3
U.S.:
33.3
Particulate Matter (PM2.5) [µg/m3] level in 2023 was 9.15. This is about average.Closest monitor was 8.0 miles away from the city center.
City:
9.15
U.S.:
8.11
Lead (Pb) [µg/m3] level in 2003 was 0.00543. This is significantly better than average.Closest monitor was 6.9 miles away from the city center.
City:
0.00543
U.S.:
0.00931
Tornado activity:
South Bound Brook-area historical tornado activity is near New Jersey state average. It is 25% smaller than the overall U.S. average.
On 10/18/1990, a category F3 (max. wind speeds 158-206 mph) tornado 13.6 miles away from the South Bound Brook borough center injured 8 peopleand causedbetween $500,000 and $5,000,000 in damages.
On 5/28/1973, a category F3 tornado 17.1 miles away from the borough center causedbetween $50,000 and $500,000 in damages.
Earthquake activity:
South Bound Brook-area historical earthquake activity is significantly above New Jersey state average. It is 68% smaller than the overall U.S. average.
On 8/23/2011 at 17:51:04, a magnitude 5.8 (5.8 MW, Depth: 3.7 mi, Class: Moderate, Intensity: VI - VII) earthquake occurred 258.3 miles away from the city center On 1/16/1994 at 01:49:16, a magnitude 4.6 (4.6 MB, 4.6 LG, Depth: 3.1 mi, Class: Light, Intensity: IV - V) earthquake occurred 80.8 miles away from the city center On 10/7/1983 at 10:18:46, a magnitude 5.3 (5.1 MB, 5.3 LG, 5.1 ML) earthquake occurred 235.3 miles away from the city center On 4/20/2002 at 10:50:47, a magnitude 5.3 (5.3 ML, Depth: 3.0 mi) earthquake occurred 277.1 miles away from the city center On 4/20/2002 at 10:50:47, a magnitude 5.2 (5.2 MB, 4.2 MS, 5.2 MW, 5.0 MW) earthquake occurred 275.2 miles away from South Bound Brook center On 1/16/1994 at 00:42:43, a magnitude 4.2 (4.2 MB, 4.0 LG, Depth: 3.1 mi) earthquake occurred 79.3 miles away from the city center Magnitude types: regional Lg-wave magnitude (LG), body-wave magnitude (MB), local magnitude (ML), surface-wave magnitude (MS), moment magnitude (MW)
Natural disasters:
The number of natural disasters in Somerset County (27) is a lot greater than the US average (15). Major Disasters (Presidential) Declared: 17 Emergencies Declared: 9
Causes of natural disasters: Floods: 7, Hurricanes: 7, Storms: 6, Heavy Rains: 4, Snowstorms: 4, Winter Storms: 3, Blizzards: 2, Water Shortages: 2, Tornado: 1, Wind: 1, Other: 3 (Note: some incidents may be assigned to more than one category).
Hospitals and medical centers near South Bound Brook:
N J EASTERN STAR HOME (Nursing Home, about 3 miles away; BRIDGEWATER, NJ)
KING JAMES NH OF FRANKLIN (Nursing Home, about 3 miles away; SOMERSET, NJ)
WILLOW CREEK REHAB AND CARE CE (Nursing Home, about 3 miles away; SOMERSET, NJ)
MARGARET MCLAUGHLIN MCCARRICK (Nursing Home, about 3 miles away; SOMERSET, NJ)
ODYSSEY HEALTHCARE OF NEW JERSEY (Hospital, about 4 miles away; PISCATAWAY, NJ)
UNIVERSITY BEHAVIORAL HEALTHCARE (Hospital, about 4 miles away; PISCATAWAY, NJ)
FRIENDS RETIREMENT CONCEPTS (Nursing Home, about 4 miles away; BRIDGEWATER, NJ)
Amtrak stations near South Bound Brook:
6 miles: NEW BRUNSWICK (FRENCH & ALBANY STS.) . Services: ticket office, fully wheelchair accessible, enclosed waiting area, public restrooms, public payphones, snack bar, ATM, free short-term parking, free long-term parking, call for car rental service, taxi stand, public transit connection.
11 miles: METROPARK (ISELIN, 100 MIDDLESEX-ESSEX TPK.) . Services: ticket office, fully wheelchair accessible, enclosed waiting area, public restrooms, public payphones, paid short-term parking, call for car rental service, taxi stand, public transit connection.
18 miles: PRINCETON JUNCTION (WALLACE RD.) . Services: ticket office, fully wheelchair accessible, enclosed waiting area, public restrooms, snack bar, paid short-term parking, paid long-term parking, call for car rental service, taxi stand, public transit connection.
Colleges/universities with over 2000 students nearest to South Bound Brook:
Notable locations in South Bound Brook: Somerset County Fire Department Station 55 / South Bound Brook Volunteer Fire Department (A), South Bound Brook Borough Hall (B). Display/hide their locations on the map
Churches in South Bound Brook include: Our Lady of Mercy Roman Catholic Church (A), Reformed Church of Bound Brook (B). Display/hide their locations on the map
Birthplace of: Heidi Bohay - Actor.
Somerset County has a predicted average indoor radon screening level greater than 4 pCi/L (pico curies per liter) - Highest Potential
Average household size:
This borough:
2.6 people
New Jersey:
2.7 people
Percentage of family households:
This borough:
64.6%
Whole state:
69.3%
Percentage of households with unmarried partners:
This borough:
8.0%
Whole state:
5.9%
Likely homosexual households (counted as self-reported same-sex unmarried-partner households)
Lesbian couples: 0.3% of all households
Gay men: 0.5% of all households
10 people in group homes intended for adults in 2010
2 people in other noninstitutional facilities in 2010
For population 15 years and over in South Bound Brook:
Never married: 33.1%
Now married: 50.4%
Separated: 1.6%
Widowed: 4.4%
Divorced: 10.4%
For population 25 years and over in South Bound Brook:
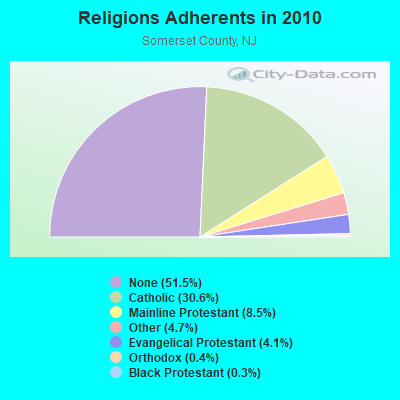
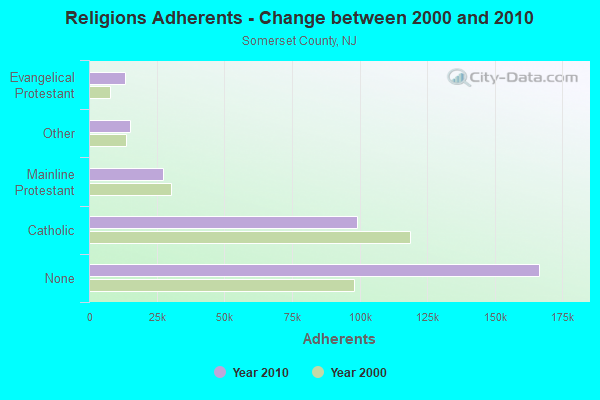
Religion statistics for South Bound Brook, NJ (based on Somerset County data)
Religion
Adherents
Congregations
Catholic
98,951
29
Mainline Protestant
27,472
68
Other
15,078
33
Evangelical Protestant
13,158
53
Orthodox
1,200
6
Black Protestant
1,076
7
None
166,509
-
Source: Clifford Grammich, Kirk Hadaway, Richard Houseal, Dale E.Jones, Alexei Krindatch, Richie Stanley and Richard H.Taylor. 2012. 2010 U.S.Religion Census: Religious Congregations & Membership Study. Association of Statisticians of American Religious Bodies. Jones, Dale E., et al. 2002. Congregations and Membership in the United States 2000. Nashville, TN: Glenmary Research Center. Graphs represent county-level data
Call Sign: KB2FCE, Grant Date: 02/09/1988, Expiration Date: 02/09/1998, Cancellation Date: 02/10/2000, Registrant: Vincent M Bonaduce, Apt 1 18 Washington St, South Bound Brook, NJ 08880
Call Sign: KB2WYS, Licensee ID: L01107102, Grant Date: 03/31/2016, Expiration Date: 02/09/2026, Certifier: Michael J Scarpellino, Registrant: Michael J Scarpellino, 78 Remsen St, South Bound Brook, NJ 08880-1318
Call Sign: KB2YZB, Licensee ID: L00354537, Grant Date: 03/03/2006, Expiration Date: 05/15/2016, Cancellation Date: 05/16/2018, Certifier: Joseph J Mikucki Jr, Registrant: Joseph J Mikucki Jr, 125 Warren Street, South Bound Brook, NJ 08880-1329
Call Sign: WB2ZAK, Licensee ID: L00261825, Grant Date: 03/07/2017, Expiration Date: 04/10/2027, Certifier: Gary R D Amico, Registrant: Gary R D Amico, 84 Nobel St, South Bound Brook, NJ 08880
Call Sign: KC2SHG, Licensee ID: L00589932, Grant Date: 10/02/2007, Expiration Date: 10/02/2017, Cancellation Date: 12/24/2016, Certifier: Michael D Allenovitch, Registrant: Michael D Allenovitch, 124 W Warren St, South Bound Brook, NJ 08880
Call Sign: KD2LNN, Licensee ID: L02038993, Grant Date: 07/21/2016, Expiration Date: 07/21/2026, Cancellation Date: 08/09/2016, Certifier: Albert C Zeller Iii, Registrant: Albert C Zeller Iii, 200 High St Apt 3, South Bound Brook, NJ 08880
Call Sign: W2ACZ, Previous Call Sign: KD2LNN, Licensee ID: L02038993, Grant Date: 08/09/2016, Expiration Date: 08/09/2026, Certifier: Albert C Zeller Iii, Registrant: Albert C Zeller Iii, 200 High St Apt 3, South Bound Brook, NJ 08880
FAA Registered Aircraft:
2
Aircraft: PIPER J3L-65 (Category: Land, Seats: 2, Weight: Up to 12,499 Pounds, Speed: 67 mph), Engine: CONT MOTOR 0-200 SERIES (100 HP) (Reciprocating) N-Number: 37937, N37937, N-37937, Serial Number: 6726, Year manufactured: 1941, Airworthiness Date: 09/14/2000, Certificate Issue Date: 06/04/2010 Registrant (Co-Owned): Norman W Schenck, 26 Madison St, South Bound Brook, NJ 08880, Other Owners: Denice J Schenck
Aircraft: CESSNA 150K (Category: Land, Seats: 2, Weight: Up to 12,499 Pounds, Speed: 90 mph), Engine: CONT MOTOR 0-200 SERIES (100 HP) (Reciprocating) N-Number: 6364G, N6364G, N-6364G, Serial Number: 15071864, Year manufactured: 1970, Airworthiness Date: 06/02/1970, Certificate Issue Date: 02/21/2004 Registrant (Individual): William A Carlstadt, 41 Cherry St, South Bound Brook, NJ 08880
Home Mortgage Disclosure Act Aggregated Statistics For Year 2009 (Based on 1 full tract)
A) FHA, FSA/RHS & VA Home Purchase Loans
B) Conventional Home Purchase Loans
C) Refinancings
D) Home Improvement Loans
F) Non-occupant Loans on < 5 Family Dwellings (A B C & D)
G) Loans On Manufactured Home Dwelling (A B C & D)
Number
Average Value
Number
Average Value
Number
Average Value
Number
Average Value
Number
Average Value
Number
Average Value
LOANS ORIGINATED
14
$231,214
12
$204,500
77
$234,506
3
$44,667
6
$228,833
0
$0
APPLICATIONS APPROVED, NOT ACCEPTED
1
$197,000
1
$231,000
14
$260,571
2
$7,000
0
$0
0
$0
APPLICATIONS DENIED
5
$249,000
0
$0
48
$243,500
4
$22,500
3
$171,667
1
$142,000
APPLICATIONS WITHDRAWN
1
$206,000
2
$194,000
20
$262,000
0
$0
3
$206,667
0
$0
FILES CLOSED FOR INCOMPLETENESS
2
$188,500
0
$0
13
$260,231
0
$0
1
$245,000
0
$0
Aggregated Statistics For Year 2008 (Based on 1 full tract)
A) FHA, FSA/RHS & VA Home Purchase Loans
B) Conventional Home Purchase Loans
C) Refinancings
D) Home Improvement Loans
E) Loans on Dwellings For 5+ Families
F) Non-occupant Loans on < 5 Family Dwellings (A B C & D)
G) Loans On Manufactured Home Dwelling (A B C & D)
Number
Average Value
Number
Average Value
Number
Average Value
Number
Average Value
Number
Average Value
Number
Average Value
Number
Average Value
LOANS ORIGINATED
15
$275,200
17
$244,235
68
$218,382
9
$56,444
1
$5,700,000
4
$174,500
0
$0
APPLICATIONS APPROVED, NOT ACCEPTED
2
$221,500
4
$227,000
28
$185,679
6
$31,000
0
$0
4
$188,000
0
$0
APPLICATIONS DENIED
4
$262,250
6
$273,500
69
$221,014
14
$26,214
0
$0
6
$247,833
3
$65,000
APPLICATIONS WITHDRAWN
3
$246,000
4
$275,250
28
$233,857
1
$5,000
0
$0
0
$0
0
$0
FILES CLOSED FOR INCOMPLETENESS
1
$275,000
1
$346,000
9
$279,000
2
$214,500
0
$0
0
$0
0
$0
Aggregated Statistics For Year 2007 (Based on 1 full tract)
A) FHA, FSA/RHS & VA Home Purchase Loans
B) Conventional Home Purchase Loans
C) Refinancings
D) Home Improvement Loans
F) Non-occupant Loans on < 5 Family Dwellings (A B C & D)
Number
Average Value
Number
Average Value
Number
Average Value
Number
Average Value
Number
Average Value
LOANS ORIGINATED
3
$260,333
81
$241,617
99
$203,152
20
$64,900
16
$169,812
APPLICATIONS APPROVED, NOT ACCEPTED
1
$260,000
7
$211,429
23
$200,739
3
$18,333
0
$0
APPLICATIONS DENIED
1
$308,000
21
$241,000
97
$214,443
24
$58,208
4
$161,500
APPLICATIONS WITHDRAWN
1
$332,000
18
$193,500
38
$235,158
1
$8,000
4
$241,250
FILES CLOSED FOR INCOMPLETENESS
0
$0
5
$244,000
15
$283,733
0
$0
1
$152,000
Aggregated Statistics For Year 2006 (Based on 1 full tract)
A) FHA, FSA/RHS & VA Home Purchase Loans
B) Conventional Home Purchase Loans
C) Refinancings
D) Home Improvement Loans
F) Non-occupant Loans on < 5 Family Dwellings (A B C & D)
Number
Average Value
Number
Average Value
Number
Average Value
Number
Average Value
Number
Average Value
LOANS ORIGINATED
3
$268,000
200
$228,020
124
$198,968
27
$100,593
26
$211,000
APPLICATIONS APPROVED, NOT ACCEPTED
1
$268,000
13
$267,231
30
$212,000
6
$78,000
1
$284,000
APPLICATIONS DENIED
0
$0
28
$232,643
47
$214,319
26
$89,423
5
$118,200
APPLICATIONS WITHDRAWN
1
$258,000
32
$248,281
46
$207,696
2
$88,500
2
$253,000
FILES CLOSED FOR INCOMPLETENESS
0
$0
3
$271,000
16
$220,688
1
$62,000
0
$0
Aggregated Statistics For Year 2005 (Based on 1 full tract)
A) FHA, FSA/RHS & VA Home Purchase Loans
B) Conventional Home Purchase Loans
C) Refinancings
D) Home Improvement Loans
E) Loans on Dwellings For 5+ Families
F) Non-occupant Loans on < 5 Family Dwellings (A B C & D)
G) Loans On Manufactured Home Dwelling (A B C & D)
Number
Average Value
Number
Average Value
Number
Average Value
Number
Average Value
Number
Average Value
Number
Average Value
Number
Average Value
LOANS ORIGINATED
4
$271,750
73
$197,863
149
$188,846
33
$78,000
2
$2,899,000
20
$235,300
1
$37,000
APPLICATIONS APPROVED, NOT ACCEPTED
0
$0
11
$168,909
19
$177,000
3
$19,333
0
$0
4
$210,000
1
$31,000
APPLICATIONS DENIED
3
$263,667
28
$209,607
74
$191,473
25
$44,040
0
$0
6
$144,833
0
$0
APPLICATIONS WITHDRAWN
1
$286,000
21
$175,381
58
$211,690
5
$124,000
0
$0
9
$239,111
0
$0
FILES CLOSED FOR INCOMPLETENESS
0
$0
3
$205,333
29
$194,483
3
$45,333
0
$0
0
$0
0
$0
Aggregated Statistics For Year 2004 (Based on 1 full tract)
A) FHA, FSA/RHS & VA Home Purchase Loans
B) Conventional Home Purchase Loans
C) Refinancings
D) Home Improvement Loans
F) Non-occupant Loans on < 5 Family Dwellings (A B C & D)
Number
Average Value
Number
Average Value
Number
Average Value
Number
Average Value
Number
Average Value
LOANS ORIGINATED
5
$220,400
57
$188,386
124
$165,395
32
$64,531
13
$178,538
APPLICATIONS APPROVED, NOT ACCEPTED
1
$217,000
7
$184,143
21
$159,952
7
$90,143
1
$144,000
APPLICATIONS DENIED
2
$239,500
12
$218,750
54
$164,056
16
$43,000
4
$230,750
APPLICATIONS WITHDRAWN
0
$0
7
$203,000
56
$163,054
4
$34,500
8
$206,000
FILES CLOSED FOR INCOMPLETENESS
0
$0
1
$228,000
6
$170,333
1
$178,000
0
$0
Aggregated Statistics For Year 2003 (Based on 1 full tract)
A) FHA, FSA/RHS & VA Home Purchase Loans
B) Conventional Home Purchase Loans
C) Refinancings
D) Home Improvement Loans
F) Non-occupant Loans on < 5 Family Dwellings (A B C & D)
Number
Average Value
Number
Average Value
Number
Average Value
Number
Average Value
Number
Average Value
LOANS ORIGINATED
9
$203,333
63
$162,175
226
$140,044
12
$41,083
16
$180,062
APPLICATIONS APPROVED, NOT ACCEPTED
1
$241,000
7
$185,143
47
$132,553
3
$21,667
1
$182,000
APPLICATIONS DENIED
2
$184,500
15
$166,733
84
$154,893
19
$34,105
8
$143,625
APPLICATIONS WITHDRAWN
2
$187,500
2
$127,500
62
$139,726
1
$8,000
2
$181,500
FILES CLOSED FOR INCOMPLETENESS
1
$218,000
2
$238,000
5
$135,600
1
$50,000
0
$0
Aggregated Statistics For Year 2002 (Based on 1 full tract)
A) FHA, FSA/RHS & VA Home Purchase Loans
B) Conventional Home Purchase Loans
C) Refinancings
D) Home Improvement Loans
E) Loans on Dwellings For 5+ Families
F) Non-occupant Loans on < 5 Family Dwellings (A B C & D)
Number
Average Value
Number
Average Value
Number
Average Value
Number
Average Value
Number
Average Value
Number
Average Value
LOANS ORIGINATED
10
$171,200
47
$152,000
151
$121,974
12
$56,583
0
$0
10
$145,300
APPLICATIONS APPROVED, NOT ACCEPTED
0
$0
5
$142,800
31
$125,903
7
$46,857
0
$0
3
$94,667
APPLICATIONS DENIED
0
$0
4
$83,000
66
$119,015
15
$31,600
2
$155,000
4
$69,500
APPLICATIONS WITHDRAWN
0
$0
3
$130,333
53
$127,245
4
$36,000
0
$0
2
$153,500
FILES CLOSED FOR INCOMPLETENESS
0
$0
0
$0
9
$124,667
1
$25,000
0
$0
0
$0
Aggregated Statistics For Year 2001 (Based on 1 full tract)
A) FHA, FSA/RHS & VA Home Purchase Loans
B) Conventional Home Purchase Loans
C) Refinancings
D) Home Improvement Loans
F) Non-occupant Loans on < 5 Family Dwellings (A B C & D)
Number
Average Value
Number
Average Value
Number
Average Value
Number
Average Value
Number
Average Value
LOANS ORIGINATED
18
$158,889
36
$134,167
96
$113,323
14
$18,357
8
$105,250
APPLICATIONS APPROVED, NOT ACCEPTED
2
$214,000
3
$133,000
18
$77,667
1
$15,000
0
$0
APPLICATIONS DENIED
2
$137,500
2
$134,000
49
$105,224
22
$19,273
2
$142,000
APPLICATIONS WITHDRAWN
2
$178,500
2
$151,000
37
$122,838
7
$25,714
0
$0
FILES CLOSED FOR INCOMPLETENESS
0
$0
0
$0
12
$102,333
1
$15,000
0
$0
Aggregated Statistics For Year 2000 (Based on 1 full tract)
A) FHA, FSA/RHS & VA Home Purchase Loans
B) Conventional Home Purchase Loans
C) Refinancings
D) Home Improvement Loans
E) Loans on Dwellings For 5+ Families
F) Non-occupant Loans on < 5 Family Dwellings (A B C & D)
Number
Average Value
Number
Average Value
Number
Average Value
Number
Average Value
Number
Average Value
Number
Average Value
LOANS ORIGINATED
19
$142,895
25
$108,160
33
$81,697
4
$10,750
1
$138,000
3
$100,667
APPLICATIONS APPROVED, NOT ACCEPTED
3
$135,667
3
$91,333
12
$90,333
2
$41,000
0
$0
1
$135,000
APPLICATIONS DENIED
3
$162,000
2
$115,000
26
$80,000
9
$37,889
0
$0
2
$130,000
APPLICATIONS WITHDRAWN
1
$167,000
1
$90,000
13
$83,462
0
$0
0
$0
0
$0
FILES CLOSED FOR INCOMPLETENESS
0
$0
1
$116,000
8
$125,625
2
$26,000
0
$0
0
$0
Aggregated Statistics For Year 1999 (Based on 1 full tract)
A) FHA, FSA/RHS & VA Home Purchase Loans
B) Conventional Home Purchase Loans
C) Refinancings
D) Home Improvement Loans
F) Non-occupant Loans on < 5 Family Dwellings (A B C & D)
Detailed PMIC statistics for the following Tracts:0530.00
2004 - 2018 National Fire Incident Reporting System (NFIRS) incidents
According to the data from the years 2004 - 2018 the average number of fires per year is 9. The highest number of fires - 17 took place in 2012, and the least - 2 in 2010. The data has a rising trend.
When looking into fire subcategories, the most incidents belonged to: Structure Fires (44.7%), and Outside Fires (36.9%).
Fire incident types reported to NFIRS in South Bound Brook, NJ


 Recent articles from our blog. Our writers, many of them Ph.D. graduates or candidates, create easy-to-read articles on a wide variety of topics.

 (8.0 miles


 According to the data from the years 2004 - 2018 the average number of fires per year is 9. The highest number of fires - 17 took place in 2012, and the least - 2 in 2010. The data has a rising trend.
 When looking into fire subcategories, the most incidents belonged to: Structure Fires (44.7%), and Outside Fires (36.9%).

