Somerset, Pennsylvania
Submit your own pictures of this borough and show them to the world
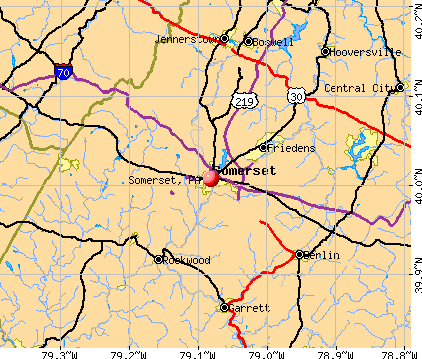
- OSM Map
- General Map
- Google Map
- MSN Map
Population change since 2000: -11.9%
 |
| Males: 2,841 | |
| Females: 3,118 |
| Median resident age: | 44.6 years |
| Pennsylvania median age: | 40.9 years |
Zip codes: 15501.
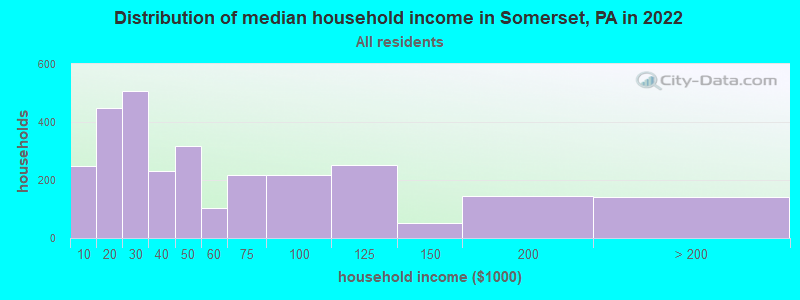
| Somerset: | $37,596 |
| PA: | $71,798 |
Estimated per capita income in 2022: $35,333 (it was $18,310 in 2000)
Somerset borough income, earnings, and wages data
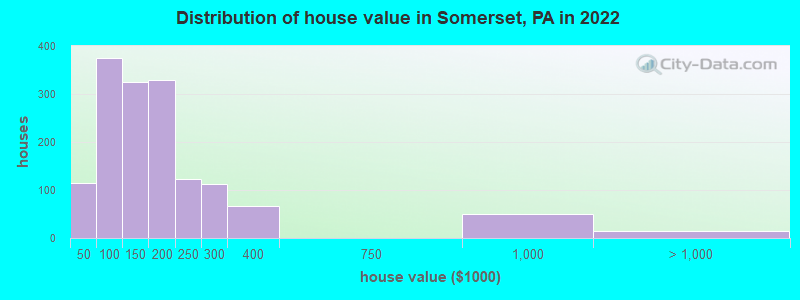
Estimated median house or condo value in 2022: $147,795 (it was $87,200 in 2000)
| Somerset: | $147,795 |
| PA: | $245,500 |
Mean prices in 2022: all housing units: $172,772; detached houses: $183,493; townhouses or other attached units: $219,298; in 2-unit structures: $125,571; mobile homes: $46,465
Median gross rent in 2022: $662.
(16.0% for White Non-Hispanic residents, 33.8% for Hispanic or Latino residents, 100.0% for other race residents, 12.8% for two or more races residents)
Detailed information about poverty and poor residents in Somerset, PA

Compare current foreclosures near Somerset, PA:
| Photo | Address | Area | Beds / Baths | Price | Details |
|---|---|---|---|---|---|

|
#1
Glades Pike
Somerset, PA 15501
|
- sq. feet
|
2 baths 2 beds |
show details | |

|
#2
E Main St
Somerset, PA 15501
|
2,170 sq. feet
|
1 baths 4 beds |
show details | |

|
#3
Samuels Rd
Somerset, PA 15501
|
1,272 sq. feet
|
2 baths 3 beds |
show details | |

|
#4
Ridge Rd
Somerset, PA 15501
|
1,092 sq. feet
|
1 baths 3 beds |
show details | |

|
#5
Husband Rd
Somerset, PA 15501
|
928 sq. feet
|
1 baths 2 beds |
show details | |

|
#6
Excelcior Dr
Somerset, PA 15501
|
1,232 sq. feet
|
2 baths 3 beds |
show details | |

|
#7
W Bakersville Edie Rd
Somerset, PA 15501
|
2,101 sq. feet
|
1 baths 2 beds |
show details | |

|
#8
W Main St
Somerset, PA 15501
|
1,816 sq. feet
|
2 baths 3 beds |
show details | |

|
#9
Duck Pond Rd
Somerset, PA 15501
|
- sq. feet
|
- baths - beds |
show details | |

|
#10
Martha St
Somerset, PA 15501
|
- sq. feet
|
- baths - beds |
show details |
| Photo | Address | Area | Beds / Baths | Price | Details |
|---|---|---|---|---|---|

|
#11
Water Level Rd
Somerset, PA 15501
|
- sq. feet
|
- baths - beds |
show details | |

|
#12
W Fairfield Street
Somerset, PA 15501
|
- sq. feet
|
- baths - beds |
show details | |

|
#13
Highland Park Dr
Somerset, PA 15501
|
- sq. feet
|
- baths - beds |
show details | |

|
#14
N Center Ave
Somerset, PA 15501
|
- sq. feet
|
- baths - beds |
show details | |

|
#15
Blacks Hill Rd
Boswell, PA 15531
|
1,168 sq. feet
|
1 baths 2 beds |
$120,750
|
show details |

|
#16
E 1st St
Somerset, PA 15501
|
- sq. feet
|
- baths - beds |
show details | |

|
#17
Hoover Rd
Somerset, PA 15501
|
- sq. feet
|
- baths - beds |
show details | |

|
#18
Trent Rd
Somerset, PA 15501
|
- sq. feet
|
- baths - beds |
show details | |

|
#19
Bunker Hill Rd
Central City, PA 15926
|
1,769 sq. feet
|
1 baths 3 beds |
$17,900
|
show details |

|
#20
Village Rd
Friedens, PA 15541
|
1,246 sq. feet
|
1 baths 3 beds |
show details |
| Photo | Address | Area | Beds / Baths | Price | Details |
|---|---|---|---|---|---|

|
#21
Water Level Rd
Rockwood, PA 15557
|
1,949 sq. feet
|
1 baths 3 beds |
show details | |

|
#22
Rogers Mill Rd
Normalville, PA 15469
|
2,260 sq. feet
|
1 baths 4 beds |
show details | |

|
#23
Whispering Pines Rd
Cairnbrook, PA 15924
|
1,547 sq. feet
|
1 baths 4 beds |
show details | |

|
#24
Bunker Hill Rd
Central City, PA 15926
|
1,296 sq. feet
|
2 baths 3 beds |
show details | |

|
#25
Lone Star Ln
Rector, PA 15677
|
- sq. feet
|
1 baths 2 beds |
show details | |

|
#26
Dannys Ln
Fairhope, PA 15538
|
1,352 sq. feet
|
1 baths 3 beds |
show details | |

|
#27
Wilbur Rd
Stoystown, PA 15563
|
1,792 sq. feet
|
1 baths 4 beds |
show details | |

|
#28
Big Rock Rd
Berlin, PA 15530
|
1,300 sq. feet
|
1 baths 3 beds |
show details | |

|
#29
Rogers Mill Rd
Normalville, PA 15469
|
1,152 sq. feet
|
1 baths 3 beds |
show details | |

|
#30
Village Rd
Friedens, PA 15541
|
1,246 sq. feet
|
1 baths 3 beds |
show details |
| Photo | Address | Area | Beds / Baths | Price | Details |
|---|---|---|---|---|---|

|
#31
Broadway St
Rockwood, PA 15557
|
1,496 sq. feet
|
1 baths 4 beds |
show details | |

|
#32
Main St
Berlin, PA 15530
|
1,344 sq. feet
|
2 baths 3 beds |
show details | |

|
#33
Front St
Jenners, PA 15546
|
- sq. feet
|
- baths - beds |
show details | |

|
#34
Route 30
Ligonier, PA 15658
|
- sq. feet
|
- baths - beds |
show details | |

|
#35
Slate Hill Rd
Berlin, PA 15530
|
- sq. feet
|
- baths - beds |
show details | |

|
#36
Penn Ave
Hollsopple, PA 15935
|
- sq. feet
|
- baths - beds |
show details | |

|
#37
Lynn St
Central City, PA 15926
|
- sq. feet
|
- baths - beds |
show details | |

|
#38
Lookout Ln
Rockwood, PA 15557
|
- sq. feet
|
- baths - beds |
show details | |

|
#39
/312 Stonycreek St
Boswell, PA 15531
|
- sq. feet
|
- baths - beds |
show details | |

|
#40
Juniata St
New Baltimore, PA 15553
|
- sq. feet
|
- baths - beds |
show details |
| Photo | Address | Area | Beds / Baths | Price | Details |
|---|---|---|---|---|---|

|
#41
Main St
Boswell, PA 15531
|
- sq. feet
|
- baths - beds |
show details | |

|
#42
Mulberry St
Berlin, PA 15530
|
- sq. feet
|
- baths - beds |
show details | |

|
#43
Roaring Run Rd
Champion, PA 15622
|
- sq. feet
|
- baths - beds |
show details | |

|
#44
Jackson St
Garrett, PA 15542
|
- sq. feet
|
- baths - beds |
show details | |

|
#45
Glencoe Rd
Fairhope, PA 15538
|
- sq. feet
|
- baths - beds |
show details | |

|
#46
Quemahoning St
Boswell, PA 15531
|
- sq. feet
|
- baths - beds |
show details | |

|
#47
Linn Run Rd
Rector, PA 15677
|
- sq. feet
|
- baths - beds |
show details | |

|
Check over 1 million property listings on Foreclosure.com!
|
browse all offers | |||


- 5,62893.5%White alone
- 1742.9%Two or more races
- 1532.5%Hispanic
- 80.1%Black alone
- 10.02%Other race alone
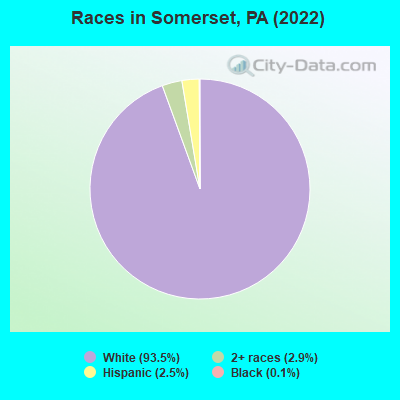
Races in Somerset detailed stats: ancestries, foreign born residents, place of birth
According to our research of Pennsylvania and other state lists, there were 238 registered sex offenders living in Somerset, Pennsylvania as of May 16, 2024.
The ratio of all residents to sex offenders in Somerset is 26 to 1.
Type |
2009 |
2010 |
2011 |
2012 |
2013 |
2014 |
2015 |
2016 |
2017 |
2018 |
2019 |
2020 |
2022 |
|---|---|---|---|---|---|---|---|---|---|---|---|---|---|
| Murders (per 100,000) | 0 (0.0) | 0 (0.0) | 0 (0.0) | 0 (0.0) | 0 (0.0) | 0 (0.0) | 0 (0.0) | 0 (0.0) | 1 (16.8) | 0 (0.0) | 0 (0.0) | 0 (0.0) | 0 (0.0) |
| Rapes (per 100,000) | 2 (31.7) | 1 (15.9) | 2 (31.8) | 3 (47.9) | 0 (0.0) | 1 (16.4) | 1 (16.5) | 0 (0.0) | 1 (16.8) | 2 (33.9) | 3 (51.2) | 0 (0.0) | 1 (16.8) |
| Robberies (per 100,000) | 7 (110.8) | 3 (47.8) | 7 (111.2) | 2 (32.0) | 0 (0.0) | 3 (49.1) | 1 (16.5) | 1 (16.7) | 2 (33.6) | 2 (33.9) | 0 (0.0) | 0 (0.0) | 0 (0.0) |
| Assaults (per 100,000) | 8 (126.7) | 10 (159.3) | 16 (254.1) | 15 (239.7) | 7 (113.7) | 11 (179.9) | 11 (181.8) | 4 (66.8) | 5 (84.1) | 12 (203.4) | 11 (187.8) | 12 (206.5) | 2 (33.6) |
| Burglaries (per 100,000) | 29 (459.2) | 36 (573.5) | 35 (555.8) | 32 (511.3) | 29 (471.2) | 32 (523.5) | 34 (562.1) | 14 (233.9) | 7 (117.7) | 15 (254.3) | 4 (68.3) | 7 (120.5) | 1 (16.8) |
| Thefts (per 100,000) | 142 (2,248) | 158 (2,517) | 136 (2,160) | 137 (2,189) | 139 (2,259) | 129 (2,110) | 87 (1,438) | 94 (1,571) | 70 (1,177) | 80 (1,356) | 53 (905.1) | 51 (877.8) | 14 (235.0) |
| Auto thefts (per 100,000) | 13 (205.8) | 7 (111.5) | 8 (127.0) | 1 (16.0) | 3 (48.7) | 11 (179.9) | 5 (82.7) | 3 (50.1) | 3 (50.5) | 4 (67.8) | 1 (17.1) | 4 (68.8) | 1 (16.8) |
| Arson (per 100,000) | 3 (47.5) | 0 (0.0) | 2 (31.8) | 0 (0.0) | 0 (0.0) | 4 (65.4) | 0 (0.0) | 2 (33.4) | 1 (16.8) | 13 (220.4) | 2 (34.2) | 1 (17.2) | 0 (0.0) |
| City-Data.com crime index | 222.5 | 208.7 | 245.0 | 220.5 | 150.0 | 199.2 | 158.0 | 101.6 | 133.4 | 155.5 | 120.9 | 90.4 | 32.1 |
The City-Data.com crime index weighs serious crimes and violent crimes more heavily. Higher means more crime, U.S. average is 246.1. It adjusts for the number of visitors and daily workers commuting into cities.
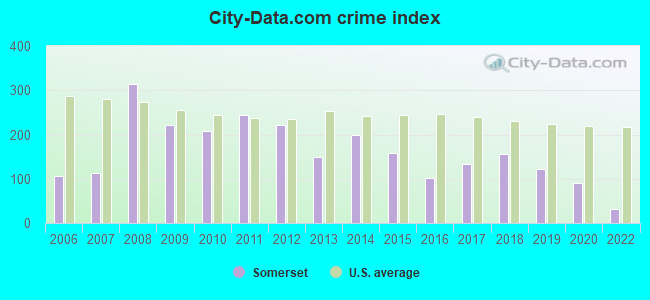
Crime rate in Somerset detailed stats: murders, rapes, robberies, assaults, burglaries, thefts, arson
Full-time law enforcement employees in 2020, including police officers: 8 (7 officers - 5 male; 2 female).
| Officers per 1,000 residents here: | 1.20 |
| Pennsylvania average: | 2.70 |
 Recent articles from our blog. Our writers, many of them Ph.D. graduates or candidates, create easy-to-read articles on a wide variety of topics.

 | Somerset and Surrounding (15 replies) |
| Best Ice Cream in Philadelphia? (30 replies) |
| Help me understand the appeal of Frick at Somerset (32 replies) |
| Need Recommendation for Divorce/Child Custody Lawyer in Somerset County, PA (3 replies) |
| Official Greater Philadelphia Area Crime Thread (5461 replies) |
| Thinking of moving back to Philly and buying property (Riverwards, Northeast) (36 replies) |
Latest news from Somerset, PA collected exclusively by city-data.com from local newspapers, TV, and radio stations
Ancestries: German (35.6%), American (13.8%), English (9.3%), Polish (7.7%), Irish (4.7%), Italian (4.1%).
Current Local Time: EST time zone
Incorporated on 03/05/1804
Elevation: 2190 feet
Land area: 2.74 square miles.
Population density: 2,173 people per square mile (low).
76 residents are foreign born
| This borough: | 1.3% |
| Pennsylvania: | 7.3% |
Median real estate property taxes paid for housing units with mortgages in 2022: $2,440 (1.4%)
Median real estate property taxes paid for housing units with no mortgage in 2022: $2,058 (1.8%)
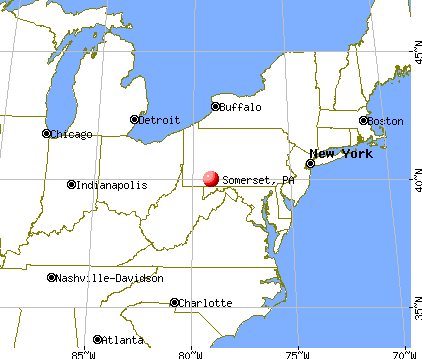
Nearest city with pop. 50,000+: Pittsburgh, PA  (56.1 miles , pop. 334,563).
Nearest city with pop. 1,000,000+: Philadelphia, PA (208.6 miles , pop. 1,517,550).
Nearest cities:
), ), )Latitude: 40.01 N, Longitude: 79.08 W
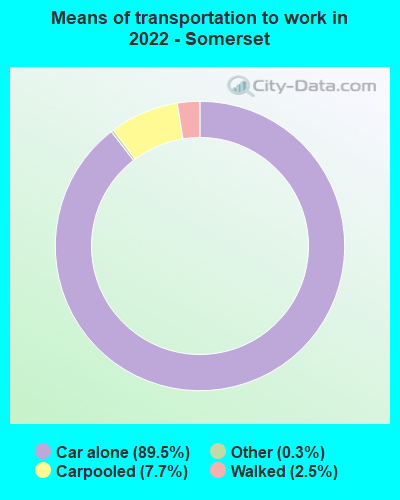
Daytime population change due to commuting: +2,993 (+50.4%)
Workers who live and work in this borough: 915 (35.3%)
Area code: 814
Somerset tourist attractions:
Somerset, Pennsylvania accommodation & food services, waste management - Economy and Business Data
| Here: | 3.8% |
| Pennsylvania: | 2.9% |
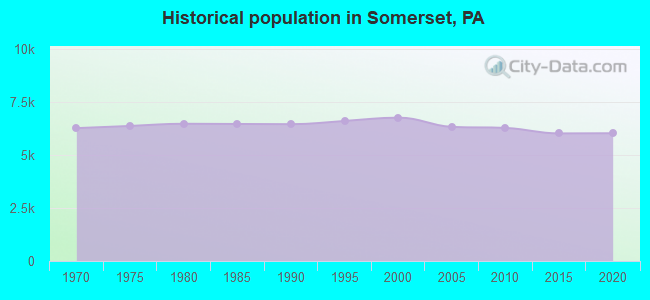
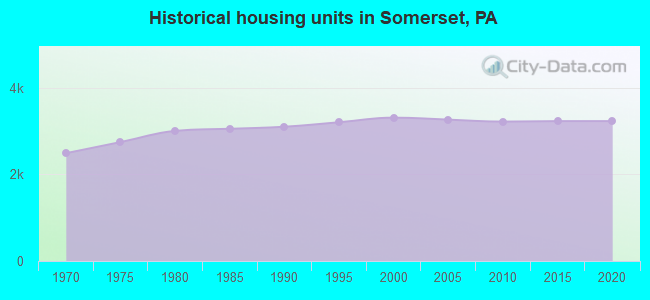
Population change in the 1990s: +262 (+4.0%).
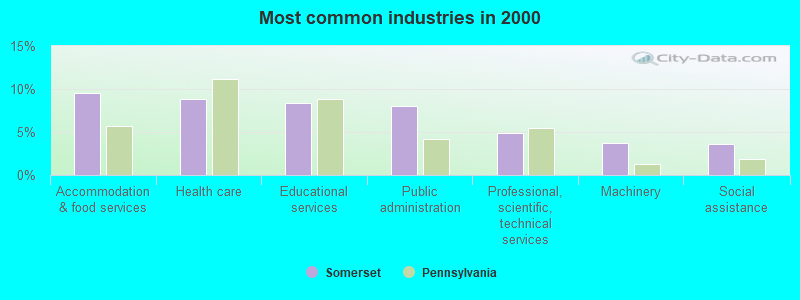
- Accommodation & food services (9.6%)
- Health care (8.8%)
- Educational services (8.3%)
- Public administration (8.0%)
- Professional, scientific, technical services (4.9%)
- Machinery (3.8%)
- Social assistance (3.6%)
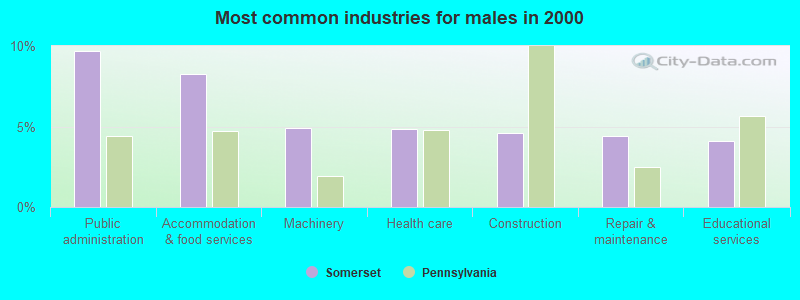
- Public administration (9.7%)
- Accommodation & food services (8.3%)
- Machinery (4.9%)
- Health care (4.8%)
- Construction (4.6%)
- Repair & maintenance (4.4%)
- Educational services (4.1%)
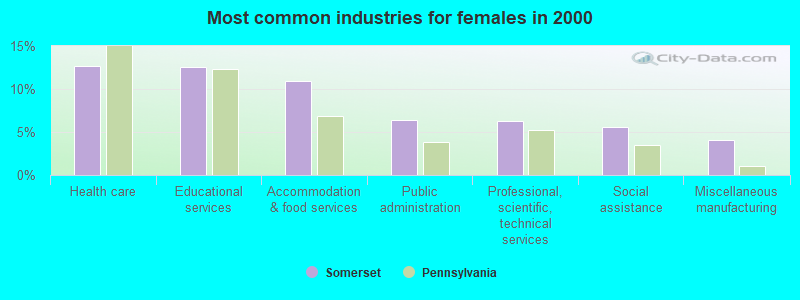
- Health care (12.7%)
- Educational services (12.5%)
- Accommodation & food services (10.9%)
- Public administration (6.4%)
- Professional, scientific, technical services (6.3%)
- Social assistance (5.6%)
- Miscellaneous manufacturing (4.0%)
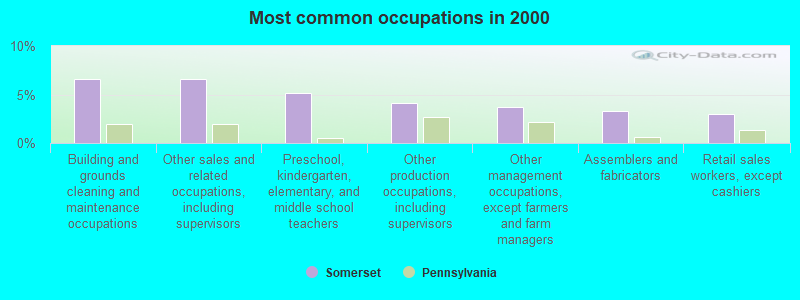
- Building and grounds cleaning and maintenance occupations (6.6%)
- Other sales and related occupations, including supervisors (6.6%)
- Preschool, kindergarten, elementary, and middle school teachers (5.2%)
- Other production occupations, including supervisors (4.2%)
- Other management occupations, except farmers and farm managers (3.7%)
- Assemblers and fabricators (3.3%)
- Retail sales workers, except cashiers (3.0%)
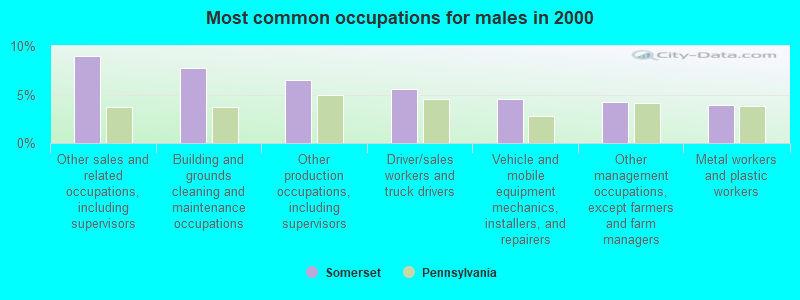
- Other sales and related occupations, including supervisors (9.0%)
- Building and grounds cleaning and maintenance occupations (7.7%)
- Other production occupations, including supervisors (6.5%)
- Driver/sales workers and truck drivers (5.5%)
- Vehicle and mobile equipment mechanics, installers, and repairers (4.6%)
- Other management occupations, except farmers and farm managers (4.2%)
- Metal workers and plastic workers (4.0%)
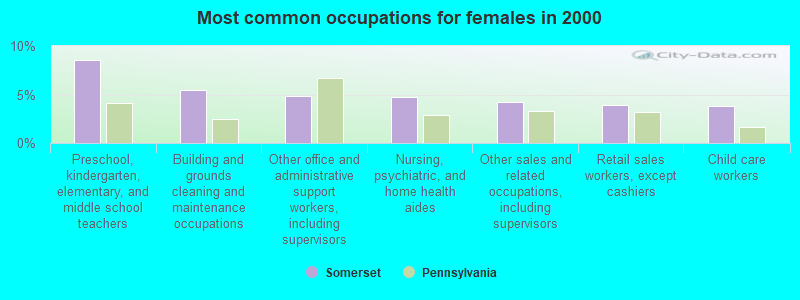
- Preschool, kindergarten, elementary, and middle school teachers (8.6%)
- Building and grounds cleaning and maintenance occupations (5.5%)
- Other office and administrative support workers, including supervisors (4.8%)
- Nursing, psychiatric, and home health aides (4.7%)
- Other sales and related occupations, including supervisors (4.2%)
- Retail sales workers, except cashiers (3.9%)
- Child care workers (3.8%)
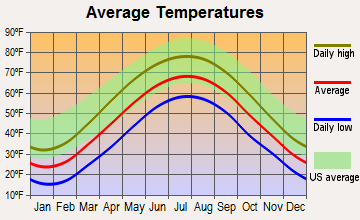
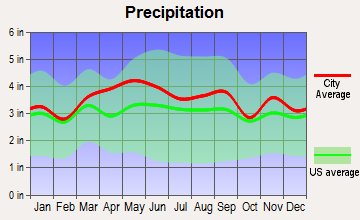
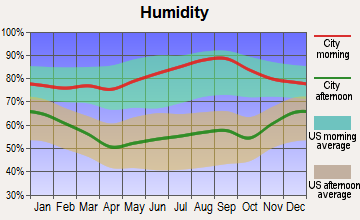
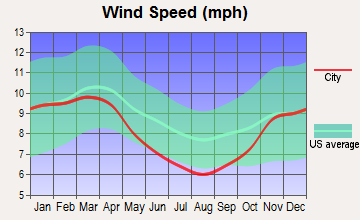
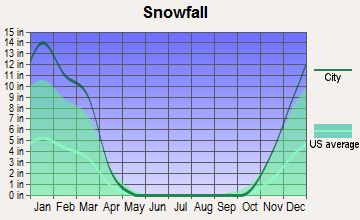
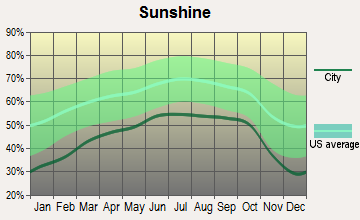
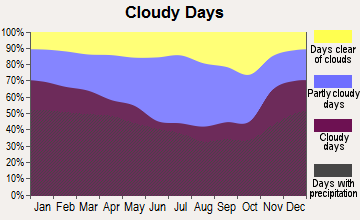
Average climate in Somerset, Pennsylvania
Based on data reported by over 4,000 weather stations
|
|

(lower is better)
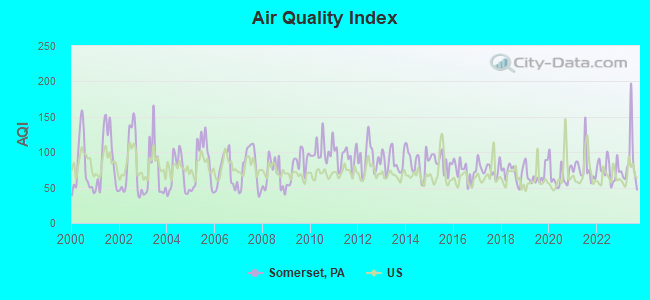
Air Quality Index (AQI) level in 2023 was 84.7. This is about average.
| City: | 84.7 |
| U.S.: | 72.6 |
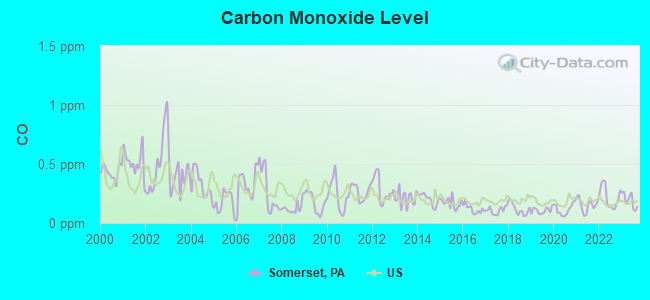
Carbon Monoxide (CO) [ppm] level in 2023 was 0.190. This is better than average. Closest monitor was 21.1 miles away from the city center.
| City: | 0.190 |
| U.S.: | 0.251 |
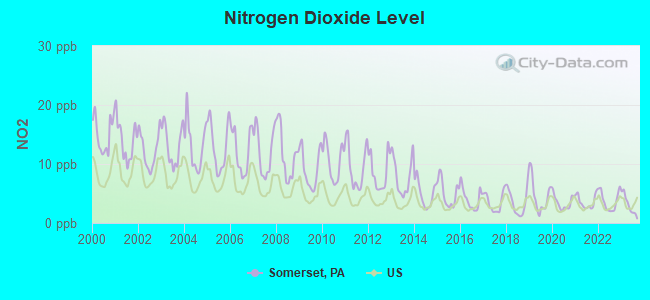
Nitrogen Dioxide (NO2) [ppb] level in 2023 was 3.03. This is significantly better than average. Closest monitor was 21.1 miles away from the city center.
| City: | 3.03 |
| U.S.: | 5.11 |
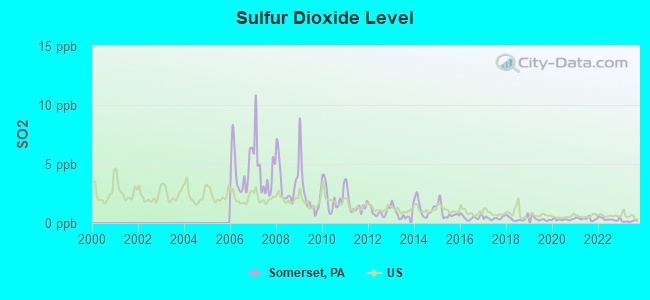
Sulfur Dioxide (SO2) [ppb] level in 2023 was 0.149. This is significantly better than average. Closest monitor was 21.1 miles away from the city center.
| City: | 0.149 |
| U.S.: | 1.515 |
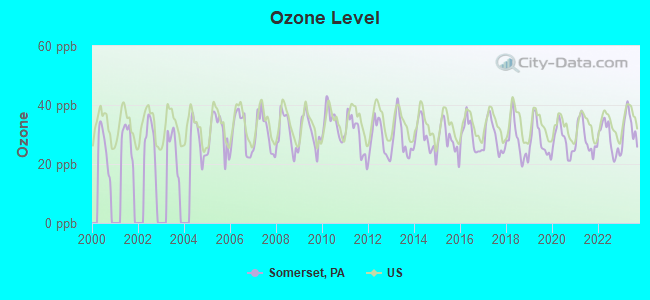
Ozone [ppb] level in 2023 was 32.4. This is about average. Closest monitor was 9.1 miles away from the city center.
| City: | 32.4 |
| U.S.: | 33.3 |
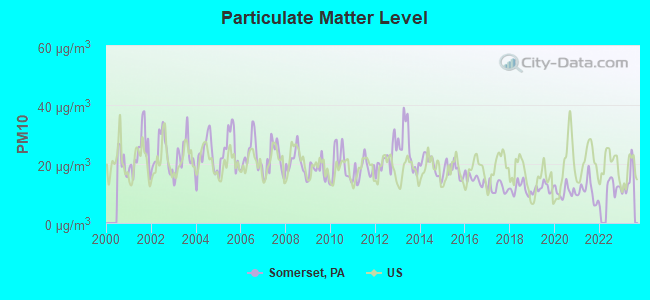
Particulate Matter (PM10) [µg/m3] level in 2023 was 14.7. This is better than average. Closest monitor was 22.7 miles away from the city center.
| City: | 14.7 |
| U.S.: | 19.2 |
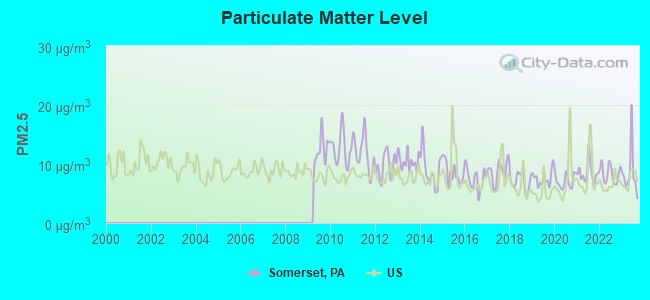
Particulate Matter (PM2.5) [µg/m3] level in 2023 was 8.47. This is about average. Closest monitor was 21.1 miles away from the city center.
| City: | 8.47 |
| U.S.: | 8.11 |
Tornado activity:
Somerset-area historical tornado activity is slightly below Pennsylvania state average. It is 40% smaller than the overall U.S. average.
On 6/2/1998, a category F4 (max. wind speeds 207-260 mph) tornado 7.9 miles away from the Somerset borough center injured 5 people and caused $6 million in damages.
On 5/31/1998, a category F3 (max. wind speeds 158-206 mph) tornado 17.8 miles away from the borough center killed one person and injured 15 people and caused $4 million in damages.
Earthquake activity:
Somerset-area historical earthquake activity is significantly above Pennsylvania state average. It is 51% smaller than the overall U.S. average.On 8/23/2011 at 17:51:04, a magnitude 5.8 (5.8 MW, Depth: 3.7 mi, Class: Moderate, Intensity: VI - VII) earthquake occurred 157.6 miles away from the city center
On 9/25/1998 at 19:52:52, a magnitude 5.2 (4.8 MB, 4.3 MS, 5.2 LG, 4.5 MW, Depth: 3.1 mi) earthquake occurred 123.6 miles away from the city center
On 1/31/1986 at 16:46:43, a magnitude 5.0 (5.0 MB) earthquake occurred 155.0 miles away from Somerset center
On 1/16/1994 at 01:49:16, a magnitude 4.6 (4.6 MB, 4.6 LG, Depth: 3.1 mi, Class: Light, Intensity: IV - V) earthquake occurred 162.4 miles away from Somerset center
On 8/9/2020 at 12:07:37, a magnitude 5.1 (5.1 MW, Depth: 4.7 mi) earthquake occurred 267.6 miles away from Somerset center
On 8/25/2011 at 05:07:52, a magnitude 4.5 (4.5 ML, Depth: 4.2 mi) earthquake occurred 154.6 miles away from Somerset center
Magnitude types: regional Lg-wave magnitude (LG), body-wave magnitude (MB), local magnitude (ML), surface-wave magnitude (MS), moment magnitude (MW)
Natural disasters:
The number of natural disasters in Somerset County (19) is greater than the US average (15).Major Disasters (Presidential) Declared: 14
Emergencies Declared: 5
Causes of natural disasters: Floods: 5, Storms: 5, Snowstorms: 4, Winter Storms: 4, Hurricanes: 3, Tropical Storms: 2, Blizzard: 1, Snowfall: 1, Tornado: 1, Tropical Depression: 1, Other: 1 (Note: some incidents may be assigned to more than one category).
Hospitals in Somerset:
- SOMERSET HOSPITAL (Voluntary non-profit - Private, 225 SOUTH CENTER AVENUE)
- SOMERSET HOSPITAL IN TOUCH HOS (223 SOUTH PLEASANT AVE SUITE 103)
- SOMERSET STATE HOSPIAL (RD 5 PO BOX 631)
- VALLEY COMMUNITY SERVICES (215 WHITE OAK ROAD)
Nursing Homes in Somerset:
- PATRIOT, A CHOICE COMMUNITY THE (495 WEST PATRIOT STREET)
- SIEMONS' LAKEVIEW MANOR NURSING AND REHAB CTR (228 SIEMON DRIVE)
- SOMERSET HOSPITAL CENTER FOR H (225 SOUTH CENTER AVENUE)
Dialysis Facilities in Somerset:
- DAVITA - SOMERSET COUNTY DIALYSIS (229 SOUTH KIMBERLY AVENUE)
- PRODIGY DIALYSIS, LLC - SOMERSET (211 GEORGIAN PLACE)
Home Health Centers in Somerset:
Airports and heliports located in Somerset:
- Somerset County Airport (2G9) (Runways: 2, Air Taxi Ops: 370, Itinerant Ops: 1,100, Local Ops: 10,900, Military Ops: 1,500)
- Medstar - Somerset Base Heliport (86PS)
- Somerset Hospital Heliport (6PA2)
College/University in Somerset:
Colleges/universities with over 2000 students nearest to Somerset:
- University of Pittsburgh-Johnstown (about 23 miles; Johnstown, PA; Full-time enrollment: 2,815)
- Frostburg State University (about 26 miles; Frostburg, MD; FT enrollment: 4,944)
- Westmoreland County Community College (about 31 miles; Youngwood, PA; FT enrollment: 4,669)
- Allegany College of Maryland (about 31 miles; Cumberland, MD; FT enrollment: 2,407)
- Wyo Tech-Blairsville (about 32 miles; Blairsville, PA; FT enrollment: 2,602)
- Seton Hill University (about 33 miles; Greensburg, PA; FT enrollment: 2,167)
- Saint Francis University (about 42 miles; Loretto, PA; FT enrollment: 2,636)
Public high schools in Somerset:
- SOMERSET AREA JR-SR HS (Students: 680, Location: 645 SOUTH COLUMBIA AVE, Grades: 6-12)
- SOMERSET COUNTY TECHNOLOGY CENTER (Students: 437, Location: 281 TECHNOLOGY DRIVE, Grades: 9-12)
Private high school in Somerset:
Public elementary/middle schools in Somerset:
- EAGLE VIEW EL SCH (Students: 535, Location: 191 DISCOVERY LN, Grades: 3-5)
- MAPLE RIDGE EL SCH (Students: 515, Location: 105 NEW CENTERVILLE RD, Grades: PK-2)
Private elementary/middle schools in Somerset:
Libraries in Somerset:
- SOMERSET COUNTY LIBRARY (Operating income: $241,837; Location: 6022 GLADES PIKE, SUITE 120; 103,014 books; 3,053 audio materials; 3,413 video materials; 17 local licensed databases; 41 state licensed databases; 168 print serial subscriptions)
- SOMERSET COUNTY FED LIB SYSTEM (Operating income: $229,805; Location: 6022 GLADES PIKE; 713 books; 3 local licensed databases; 41 state licensed databases; 5 print serial subscriptions)
- MARY S BIESECKER PUB LIBRARY (Operating income: $167,342; Location: 230 S ROSINA AVE; 29,844 books; 1,181 audio materials; 879 video materials; 41 state licensed databases; 46 print serial subscriptions)
Points of interest:
Notable locations in Somerset: Laurel Hill Village (A), Somerset Country Club (B), Somerset Volunteer Fire Department (C). Display/hide their locations on the map
Cemeteries: Union Cemetery (1), Husband Cemetery (2). Display/hide their locations on the map
Tourist attraction: United States Government - National Park Service- Flight 93 National Memo (Recreation Areas; 109 West Main Street).
Hotels: A Budget Inn (736 North Center Avenue), Hampton Inn (324 Laurel Crest Road), Dollar Inn (1146 North Center Avenue), Best Western Executive Inn (165 Water Works Road), Budget Host Inn (799 North Center Avenue), Days Inn Somerset (220 Water Works Road), A-1 Economy Inn (1138 North Center Avenue), Hampton Inn Somerset (324 Laurel Crest Road).
Courts: Somerset County - Court Administrator (East Union Street), Somerset County - Court Reporters (111 East Union Street Suite 30).
Birthplace of: Henry Black (Representative) - Politician, Jacob Miller Campbell - Union Army officer, Keith Malley - Stand-up comedian, Alexander Hamilton Coffroth - Politician, Joe Margoneri - Baseball player, Kenneth Halverson - Politician, Pete Zorn - Musician.
Drinking water stations with addresses in Somerset and their reported violations in the past:
PIONEER CAMPGROUND (Population served: 500, Groundwater):Past monitoring violations:ITALIAN OVEN (Population served: 250, Groundwater):
- One routine major monitoring violation
- 2 minor monitoring violations
Past monitoring violations:OAKHURST TEA ROOM (Population served: 200, Groundwater):
- 3 routine major monitoring violations
Past monitoring violations:OUTBACK PARK AT HIDDEN VALLEY (Population served: 150, Groundwater):
- Monitoring, Source Water (GWR) - Between AUG-12-2011 and SEP-12-2011, Contaminant: E. COLI. Follow-up actions: St Violation/Reminder Notice (FEB-15-2012), St Compliance achieved (FEB-15-2012)
- One minor monitoring violation
- 2 regular monitoring violations
Past health violations:LAUREL MTN INN (Population served: 150, Groundwater):Past monitoring violations:
- MCL, Monthly (TCR) - Between JUL-2013 and SEP-2013, Contaminant: Coliform. Follow-up actions: St Compliance Meeting conducted (OCT-01-2013), St Public Notif received (OCT-01-2013), St Compliance achieved (OCT-01-2013), St Tech Assistance Visit (OCT-01-2013)
- MCL, Acute (TCR) - Between JUL-2013 and SEP-2013, Contaminant: Coliform. Follow-up actions: St Compliance Meeting conducted (OCT-01-2013), St Public Notif received (OCT-01-2013), St Compliance achieved (OCT-01-2013), St Tech Assistance Visit (OCT-01-2013)
- Monitoring, Source Water (GWR) - Between JUL-13-2013 and AUG-13-2013, Contaminant: E. COLI. Follow-up actions: St Tech Assistance Visit (OCT-01-2013), St Compliance achieved (OCT-01-2013)
- 6 routine major monitoring violations
- 4 regular monitoring violations
Past monitoring violations:WOODLAND CAMPSITES (Population served: 135, Groundwater):
- 14 routine major monitoring violations
- 8 regular monitoring violations
Past monitoring violations:PIZZA HUT (Population served: 100, Groundwater):
- 2 routine major monitoring violations
- 5 regular monitoring violations
Past health violations:MOSTOLLER CONVENIENCE STORE (Population served: 100, Groundwater):Past monitoring violations:
- MCL, Monthly (TCR) - In AUG-2009, Contaminant: Coliform. Follow-up actions: St Public Notif received (SEP-29-2009), St Compliance achieved (2 times from SEP-29-2009 to SEP-29-2009), St Public Notif received (SEP-29-2009)
- MCL, Monthly (TCR) - Between JUL-2009 and SEP-2009, Contaminant: Coliform. Follow-up actions: St Public Notif received (AUG-27-2009), St Compliance achieved (AUG-27-2009), St Formal NOV issued (AUG-27-2009)
- Monitoring, Repeat Major (TCR) - Between OCT-2009 and DEC-2009, Contaminant: Coliform (TCR). Follow-up actions: St Formal NOV issued (DEC-08-2009), St Compliance achieved (OCT-21-2010)
- Monitoring, Repeat Major (TCR) - In AUG-2009, Contaminant: Coliform (TCR). Follow-up actions: St Public Notif received (SEP-29-2009), St Compliance achieved (SEP-29-2009)
- One routine major monitoring violation
Past monitoring violations:
- Monitoring, Repeat Major (TCR) - Between JUL-2007 and SEP-2007, Contaminant: Coliform (TCR). Follow-up actions: St Tech Assistance Visit (DEC-10-2007), St Compliance achieved (DEC-10-2007), St Violation/Reminder Notice (DEC-10-2007)
- One routine major monitoring violation
- 6 regular monitoring violations
Drinking water stations with addresses in Somerset that have no violations reported:
- RHOADS MINI MART (Population served: 100, Primary Water Source Type: Groundwater)
- KOOSER STATE PARK (Population served: 25, Primary Water Source Type: Groundwater)
- LAUREL HILL STATE PARK (Population served: 25, Primary Water Source Type: Groundwater)
| This borough: | 2.1 people |
| Pennsylvania: | 2.5 people |
| This borough: | 53.0% |
| Whole state: | 65.0% |
| This borough: | 7.1% |
| Whole state: | 6.6% |
Likely homosexual households (counted as self-reported same-sex unmarried-partner households)
- Lesbian couples: 0.2% of all households
- Gay men: 0.1% of all households
People in group quarters in Somerset in 2010:
- 84 people in nursing facilities/skilled-nursing facilities
- 72 people in local jails and other municipal confinement facilities
- 5 people in group homes intended for adults
People in group quarters in Somerset in 2000:
- 165 people in nursing homes
- 97 people in local jails and other confinement facilities (including police lockups)
- 26 people in other noninstitutional group quarters
- 19 people in homes for the mentally retarded
- 18 people in homes for abused, dependent, and neglected children
- 2 people in other nonhousehold living situations
Banks with branches in Somerset (2011 data):
- Somerset Trust Company: Glades Pike Office, Somerset Plaza Branch, at 151 West Main Street, Somerset Crossing Branch. Info updated 2009/01/14: Bank assets: $715.4 mil, Deposits: $603.6 mil, local headquarters, positive income, Commercial Lending Specialization, 19 total offices, Holding Company: Somerset Trust Holding Company
- First Commonwealth Bank: Somerset Branch at 2040 North Center Avenue, branch established on 1971/10/11. Info updated 2010/11/23: Bank assets: $5,779.0 mil, Deposits: $4,511.6 mil, headquarters in Indiana, PA, positive income, Commercial Lending Specialization, 112 total offices, Holding Company: First Commonwealth Financial Corporation
- First National Bank of Pennsylvania: Somerset East Branch at 509 East Main Street, branch established on 1988/01/02. Info updated 2012/01/10: Bank assets: $9,581.0 mil, Deposits: $7,462.2 mil, headquarters in Greenville, PA, positive income, Commercial Lending Specialization, 291 total offices, Holding Company: F.N.b. Corporation
- PNC Bank, National Association: County Trust Branch at 108 East Main Street, branch established on 1910/01/01. Info updated 2012/03/20: Bank assets: $263,309.6 mil, Deposits: $197,343.0 mil, headquarters in Wilmington, DE, positive income, Commercial Lending Specialization, 3085 total offices, Holding Company: Pnc Financial Services Group, Inc., The
- Ameriserv Financial Bank: Somerset Branch at 108 West Main Street, branch established on 1960/10/17. Info updated 2010/05/21: Bank assets: $952.1 mil, Deposits: $816.6 mil, headquarters in Johnstown, PA, positive income, Commercial Lending Specialization, 18 total offices, Holding Company: Ameriserv Financial, Inc
- 1st Summit Bank: Somerset Branch at 404 North Center Avenue, branch established on 1999/07/28. Info updated 2006/11/03: Bank assets: $730.5 mil, Deposits: $653.3 mil, headquarters in Johnstown, PA, positive income, Mortgage Lending Specialization, 14 total offices, Holding Company: 1st Summit Bancorp Of Johnstown, Inc.
For population 15 years and over in Somerset:
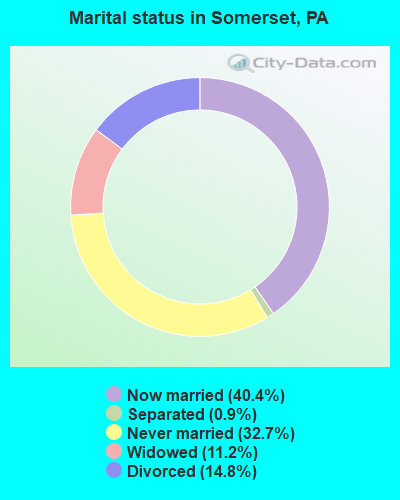
- Never married: 32.7%
- Now married: 40.4%
- Separated: 0.9%
- Widowed: 11.2%
- Divorced: 14.8%
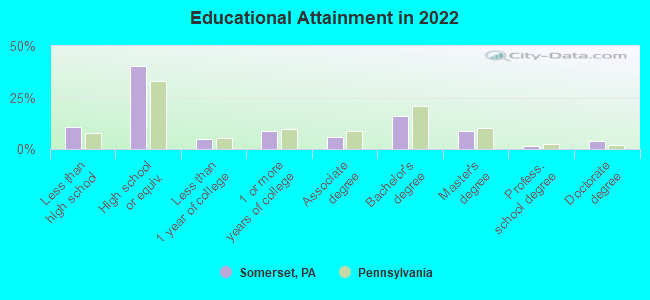
For population 25 years and over in Somerset:
- High school or higher: 88.2%
- Bachelor's degree or higher: 29.1%
- Graduate or professional degree: 13.6%
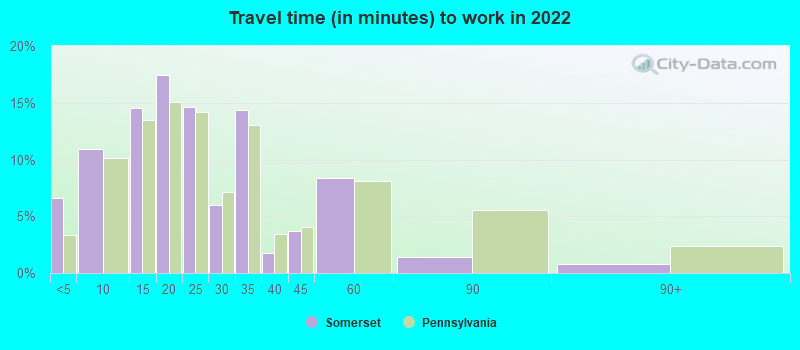
- Unemployed: 4.7%
- Mean travel time to work (commute): 15.2 minutes
| Here: | 13.2 |
| Pennsylvania average: | 11.4 |
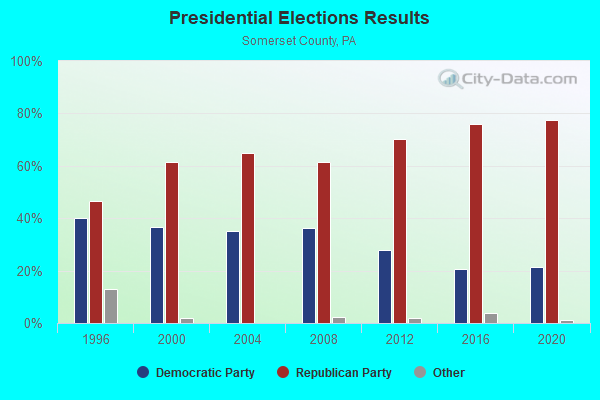
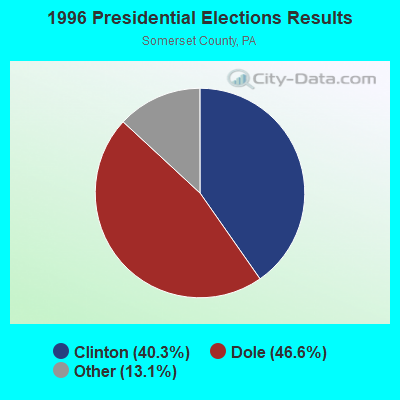
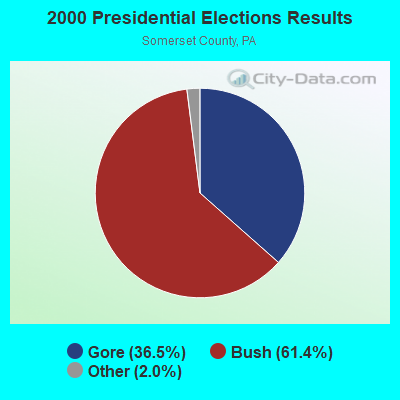
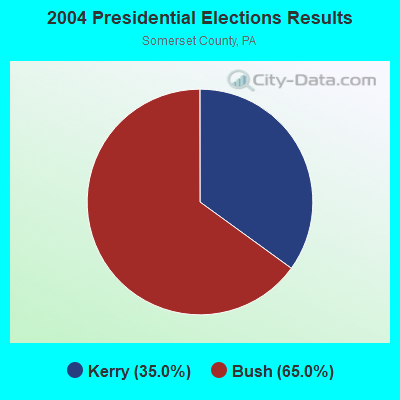

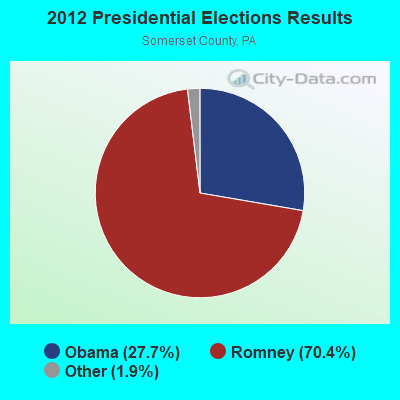
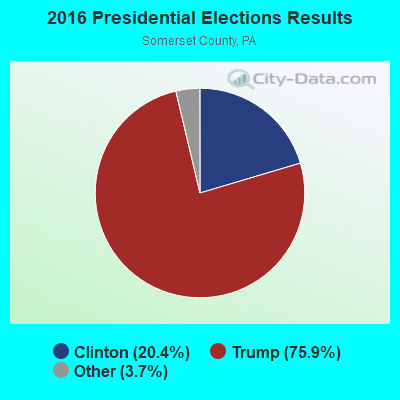
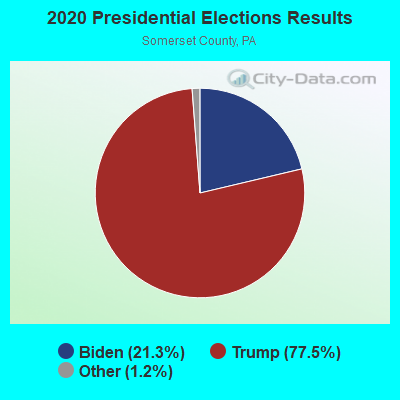
Graphs represent county-level data. Detailed 2008 Election Results
Religion statistics for Somerset, PA (based on Somerset County data)
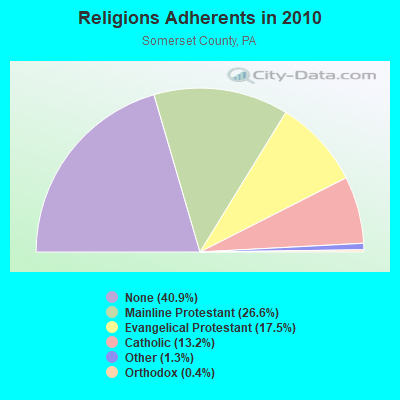
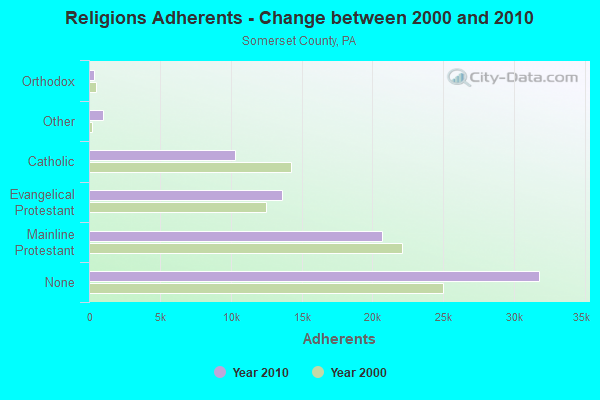
| Religion | Adherents | Congregations |
|---|---|---|
| Mainline Protestant | 20,678 | 91 |
| Evangelical Protestant | 13,611 | 93 |
| Catholic | 10,298 | 15 |
| Other | 1,022 | 5 |
| Orthodox | 343 | 5 |
| None | 31,790 | - |
Food Environment Statistics:
| Somerset County: | 2.31 / 10,000 pop. |
| State: | 2.04 / 10,000 pop. |
| Somerset County: | 0.13 / 10,000 pop. |
| Pennsylvania: | 0.09 / 10,000 pop. |
| Somerset County: | 0.51 / 10,000 pop. |
| State: | 0.88 / 10,000 pop. |
| Somerset County: | 3.60 / 10,000 pop. |
| Pennsylvania: | 2.52 / 10,000 pop. |
| This county: | 5.91 / 10,000 pop. |
| Pennsylvania: | 7.12 / 10,000 pop. |
| Here: | 9.6% |
| Pennsylvania: | 9.1% |
| Somerset County: | 29.1% |
| Pennsylvania: | 27.2% |
| Here: | 10.3% |
| Pennsylvania: | 11.5% |
Health and Nutrition:
| Somerset: | 57.6% |
| Pennsylvania: | 50.2% |
| Somerset: | 58.6% |
| State: | 47.1% |
| Here: | 28.0 |
| State: | 28.7 |
| This city: | 16.6% |
| Pennsylvania: | 20.8% |
| Somerset: | 8.0% |
| Pennsylvania: | 10.9% |
| Here: | 7.0 |
| Pennsylvania: | 6.8 |
| This city: | 34.7% |
| State: | 34.3% |
| This city: | 63.6% |
| State: | 56.2% |
| This city: | 80.4% |
| Pennsylvania: | 78.3% |
More about Health and Nutrition of Somerset, PA Residents
| Local government employment and payroll (March 2022) | |||||
| Function | Full-time employees | Monthly full-time payroll | Average yearly full-time wage | Part-time employees | Monthly part-time payroll |
|---|---|---|---|---|---|
| Streets and Highways | 13 | $61,984 | $57,216 | 4 | $16,661 |
| Police Protection - Officers | 8 | $60,317 | $90,476 | 13 | $93,661 |
| Other Government Administration | 6 | $34,879 | $69,758 | 13 | $30,800 |
| Water Supply | 6 | $38,902 | $77,804 | 0 | $0 |
| Financial Administration | 4 | $19,773 | $59,319 | 1 | $2,688 |
| Sewerage | 4 | $21,095 | $63,285 | 0 | $0 |
| Totals for Government | 41 | $236,950 | $69,351 | 31 | $143,810 |
Somerset government finances - Expenditure in 2017 (per resident):
- Construction - Regular Highways: $131,000 ($21.98)
- Current Operations - Police Protection: $1,467,000 ($246.18)
Regular Highways: $796,000 ($133.58)
General - Other: $386,000 ($64.78)
Central Staff Services: $137,000 ($22.99)
Local Fire Protection: $108,000 ($18.12)
Protective Inspection and Regulation - Other: $108,000 ($18.12)
General Public Buildings: $90,000 ($15.10)
Libraries: $81,000 ($13.59)
Judicial and Legal Services: $76,000 ($12.75)
Parks and Recreation: $30,000 ($5.03)
Financial Administration: $28,000 ($4.70)
Solid Waste Management: $9,000 ($1.51)
Natural Resources - Other: $6,000 ($1.01)
Parking Facilities: $1,000 ($0.17)
- General - Interest on Debt: $5,000 ($0.84)
- Total Salaries and Wages: $2,613,000 ($438.50)
Somerset government finances - Revenue in 2017 (per resident):
- Charges - Other: $76,000 ($12.75)
Parking Facilities: $47,000 ($7.89)
- Federal Intergovernmental - Other: $29,000 ($4.87)
- Local Intergovernmental - Other: $3,000 ($0.50)
- Miscellaneous - Fines and Forfeits: $64,000 ($10.74)
Rents: $25,000 ($4.20)
Interest Earnings: $11,000 ($1.85)
General Revenue - Other: $9,000 ($1.51)
Donations From Private Sources: $3,000 ($0.50)
- Revenue - Water Utilities: $70,000 ($11.75)
- State Intergovernmental - Other: $239,000 ($40.11)
Highways: $196,000 ($32.89)
Housing and Community Development: $7,000 ($1.17)
General Local Government Support: $6,000 ($1.01)
- Tax - Property: $1,821,000 ($305.59)
Individual Income: $524,000 ($87.93)
Occupation and Business License - Other: $362,000 ($60.75)
Public Utility License: $113,000 ($18.96)
Documentary and Stock Transfer: $47,000 ($7.89)
Somerset government finances - Debt in 2017 (per resident):
- Long Term Debt - Beginning Outstanding - Unspecified Public Purpose: $130,000 ($21.82)
Issue, Unspecified Public Purpose: $130,000 ($21.82)
Retired Unspecified Public Purpose: $130,000 ($21.82)
Outstanding Unspecified Public Purpose: $130,000 ($21.82)
Somerset government finances - Cash and Securities in 2017 (per resident):
- Bond Funds - Cash and Securities: $14,000 ($2.35)
- Other Funds - Cash and Securities: $2,399,000 ($402.58)
| Businesses in Somerset, PA | ||||
| Name | Count | Name | Count | |
|---|---|---|---|---|
| AT&T | 1 | Knights Inn | 1 | |
| Ace Hardware | 1 | Kroger | 1 | |
| Advance Auto Parts | 1 | La-Z-Boy | 1 | |
| Arby's | 1 | Lane Furniture | 2 | |
| AutoZone | 1 | Long John Silver's | 1 | |
| Burger King | 1 | Lowe's | 1 | |
| CVS | 1 | MasterBrand Cabinets | 2 | |
| Chevrolet | 1 | McDonald's | 3 | |
| Cinnabon | 2 | Papa John's Pizza | 1 | |
| Comfort Inn | 1 | Pizza Hut | 1 | |
| Curves | 1 | Quality | 1 | |
| Dairy Queen | 1 | Quiznos | 1 | |
| Days Inn | 1 | RadioShack | 1 | |
| Domino's Pizza | 1 | Ruby Tuesday | 1 | |
| Famous Footwear | 1 | Sears | 1 | |
| Fashion Bug | 1 | Starbucks | 3 | |
| FedEx | 4 | Subway | 2 | |
| Ford | 1 | Super 8 | 1 | |
| Goodwill | 2 | T-Mobile | 1 | |
| H&R Block | 2 | U-Haul | 2 | |
| Hilton | 1 | UPS | 2 | |
| Jones New York | 1 | Walmart | 1 | |
| KFC | 1 | Wendy's | 1 | |
Strongest AM radio stations in Somerset:
- WVSC (990 AM; 10 kW; SOMERSET, PA; Owner: FOREVER OF JOHNSTOWN, INC.)
- WYSN (1330 AM; 5 kW; SOMERSET, PA; Owner: DAME BROADCASTING, LLC)
- WLYE (850 AM; 10 kW; JOHNSTOWN, PA; Owner: FOREVER OF JOHNSTOWN, INC.)
- WFRB (560 AM; 5 kW; FROSTBURG, MD; Owner: WTBO-WKGO CORPORATION, L.L.C.)
- KDKA (1020 AM; 50 kW; PITTSBURGH, PA; Owner: INFINITY BROADCASTING OPERATIONS, INC.)
- WZSK (1040 AM; daytime; 10 kW; EVERETT, PA; Owner: NEW MILLENNIUM COMMUNICATIONS GROUP, INC.)
- WKHB (620 AM; 6 kW; IRWIN, PA; Owner: BROADCAST COMMUNICATIONS, INC.)
- WCCS (1160 AM; 10 kW; HOMER CITY, PA; Owner: RENDA RADIO, INC.)
- WCBC (1270 AM; 5 kW; CUMBERLAND, MD; Owner: CUMBERLAND BROADCASTING COMPANY)
- WWVA (1170 AM; 53 kW; WHEELING, WV; Owner: CAPSTAR TX LIMITED PARTNERSHIP)
- WCBM (680 AM; 50 kW; BALTIMORE, MD; Owner: WCBM MARYLAND, INC.)
- WHJB (1600 AM; 5 kW; BEDFORD, PA; Owner: JOHN H. CESSNA)
- WMET (1150 AM; 50 kW; GAITHERSBURG, MD; Owner: BELTWAY ACQUISITION CORPORATION)
Strongest FM radio stations in Somerset:
- WUZY (97.7 FM; SOMERSET, PA; Owner: FOREVER OF JOHNSTOWN,INC.)
- WQZS (93.3 FM; MEYERSDALE, PA; Owner: ROGER WAHL)
- WCCL (101.7 FM; CENTRAL CITY, PA; Owner: DAME BROADCASTING, LLC)
- WQEJ (89.7 FM; JOHNSTOWN, PA; Owner: WQED MULTIMEDIA)
- WROG (102.9 FM; CUMBERLAND, MD; Owner: TSCHUDY RADIO, INC)
- WFWM (91.9 FM; FROSTBURG, MD; Owner: FROSTBURG STATE UNIVERSITY)
- WKGO (106.1 FM; CUMBERLAND, MD; Owner: WTBO-WKGO CORPORATION, L.L.C.)
- WFRB-FM (105.3 FM; FROSTBURG, MD; Owner: WTBO-WKGO CORPORATION, L.L.C.)
- WLIC (97.1 FM; FROSTBURG, MD; Owner: HE'S ALIVE, INC.)
- WFRJ (88.9 FM; JOHNSTOWN, PA; Owner: FAMILY STATIONS, INC.)
- WKYE (95.5 FM; JOHNSTOWN, PA; Owner: FOREVER OF JOHNSTOWN, INC.)
- WQKK (92.1 FM; JOHNSTOWN, PA; Owner: DAME BROADCASTING, LLC)
- WBVE (107.5 FM; BEDFORD, PA; Owner: CESSNA COMMUNICATIONS, INC.)
- WAYC (100.9 FM; BEDFORD, PA; Owner: CESSNA COMMUNICATIONS, INC.)
- WOGG (94.9 FM; OLIVER, PA; Owner: KEYMARKET LICENSES, LLC)
- WLSW (103.9 FM; SCOTTDALE, PA; Owner: L. STANLEY WALL)
- WWPN (101.1 FM; WESTERNPORT, MD; Owner: ERNEST F. SANTMYIRE)
- WVPM (90.9 FM; MORGANTOWN, WV; Owner: WEST VIRGINIA EDUCATIONAL BROADCASTING AUTHORITY)
- WAIJ (90.3 FM; GRANTSVILLE, MD; Owner: HE'S ALIVE, INC.)
- WDZN (100.1 FM; ROMNEY, WV; Owner: CHARTER EQUITIES, INC.)
TV broadcast stations around Somerset:
- W57BM (Channel 57; SOMERSET, PA; Owner: PALM TELEVISION, L.P.)
- WNPA (Channel 19; JEANNETTE, PA; Owner: VIACOM STATIONS GROUP OF PITTSBURGH INC.)
- WWCP-TV (Channel 8; JOHNSTOWN, PA; Owner: PEAK MEDIA OF PA LICENSEE LLC)
- WTAE-TV (Channel 4; PITTSBURGH, PA; Owner: WTAE HEARST-ARGYLE TV, INC. (CA CORP.))
- National Bridge Inventory (NBI) Statistics
- 58Number of bridges
- 354ft / 108mTotal length
- $9,757,000Total costs
- 420,627Total average daily traffic
- 110,398Total average daily truck traffic
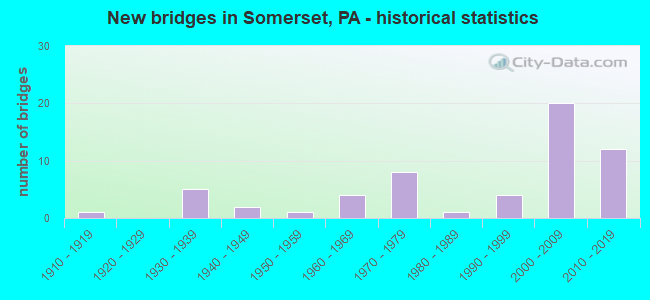
- New bridges - historical statistics
- 11910-1919
- 51930-1939
- 21940-1949
- 11950-1959
- 41960-1969
- 81970-1979
- 11980-1989
- 41990-1999
- 202000-2009
- 122010-2019
FCC Registered Antenna Towers: 181 (See the full list of FCC Registered Antenna Towers)
FCC Registered Private Land Mobile Towers: 1 (See the full list of FCC Registered Private Land Mobile Towers in Somerset, PA)
FCC Registered Broadcast Land Mobile Towers: 26 (See the full list of FCC Registered Broadcast Land Mobile Towers)
FCC Registered Microwave Towers: 28 (See the full list of FCC Registered Microwave Towers in this town)
FCC Registered Paging Towers: 5 (See the full list of FCC Registered Paging Towers)
FCC Registered Maritime Coast & Aviation Ground Towers: 2 (See the full list of FCC Registered Maritime Coast & Aviation Ground Towers)
FCC Registered Amateur Radio Licenses: 78 (See the full list of FCC Registered Amateur Radio Licenses in Somerset)
FAA Registered Aircraft Manufacturers and Dealers: 6 (See the full list of FAA Registered Manufacturers and Dealers in Somerset)
FAA Registered Aircraft: 12 (See the full list of FAA Registered Aircraft)
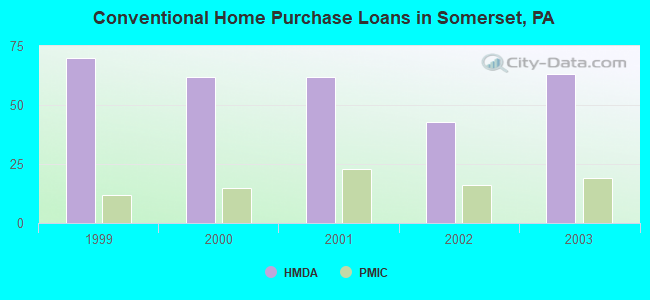
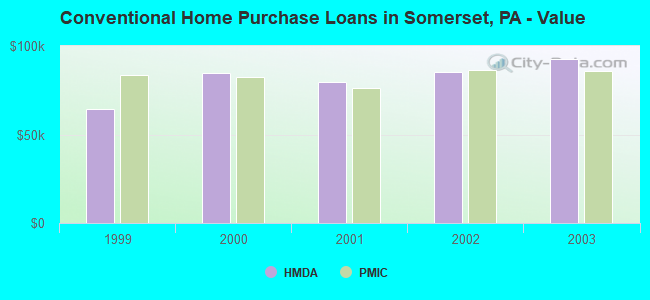
| Home Mortgage Disclosure Act Aggregated Statistics For Year 2003 (Based on 2 full tracts) | ||||||||||||
| A) FHA, FSA/RHS & VA Home Purchase Loans | B) Conventional Home Purchase Loans | C) Refinancings | D) Home Improvement Loans | E) Loans on Dwellings For 5+ Families | F) Non-occupant Loans on < 5 Family Dwellings (A B C & D) | |||||||
|---|---|---|---|---|---|---|---|---|---|---|---|---|
| Number | Average Value | Number | Average Value | Number | Average Value | Number | Average Value | Number | Average Value | Number | Average Value | |
| LOANS ORIGINATED | 10 | $74,800 | 63 | $92,444 | 215 | $76,595 | 34 | $44,118 | 3 | $79,667 | 27 | $96,259 |
| APPLICATIONS APPROVED, NOT ACCEPTED | 0 | $0 | 3 | $97,000 | 29 | $66,276 | 4 | $18,500 | 0 | $0 | 2 | $76,500 |
| APPLICATIONS DENIED | 1 | $87,000 | 19 | $68,368 | 78 | $85,936 | 12 | $11,250 | 0 | $0 | 5 | $153,800 |
| APPLICATIONS WITHDRAWN | 0 | $0 | 11 | $145,818 | 32 | $101,750 | 3 | $52,333 | 0 | $0 | 1 | $35,000 |
| FILES CLOSED FOR INCOMPLETENESS | 0 | $0 | 2 | $112,000 | 7 | $73,000 | 1 | $71,000 | 0 | $0 | 0 | $0 |
Detailed HMDA statistics for the following Tracts: 0210.00 , 0211.00
| Private Mortgage Insurance Companies Aggregated Statistics For Year 2003 (Based on 2 full tracts) | ||||||
| A) Conventional Home Purchase Loans | B) Refinancings | C) Non-occupant Loans on < 5 Family Dwellings (A & B) | ||||
|---|---|---|---|---|---|---|
| Number | Average Value | Number | Average Value | Number | Average Value | |
| LOANS ORIGINATED | 19 | $85,895 | 15 | $113,333 | 1 | $143,000 |
| APPLICATIONS APPROVED, NOT ACCEPTED | 2 | $88,500 | 5 | $97,000 | 1 | $68,000 |
| APPLICATIONS DENIED | 0 | $0 | 1 | $123,000 | 0 | $0 |
| APPLICATIONS WITHDRAWN | 1 | $100,000 | 1 | $120,000 | 0 | $0 |
| FILES CLOSED FOR INCOMPLETENESS | 0 | $0 | 1 | $59,000 | 0 | $0 |
Detailed PMIC statistics for the following Tracts: 0210.00 , 0211.00
2003 - 2018 National Fire Incident Reporting System (NFIRS) incidents
- Fire incident types reported to NFIRS in Somerset, PA
- 64154.4%Structure Fires
- 22719.3%Outside Fires
- 15913.5%Other
- 15112.8%Mobile Property/Vehicle Fires
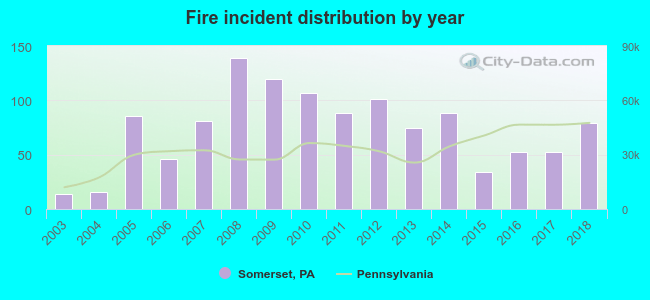 According to the data from the years 2003 - 2018 the average number of fire incidents per year is 74. The highest number of fire incidents - 139 took place in 2008, and the least - 14 in 2003. The data has an increasing trend.
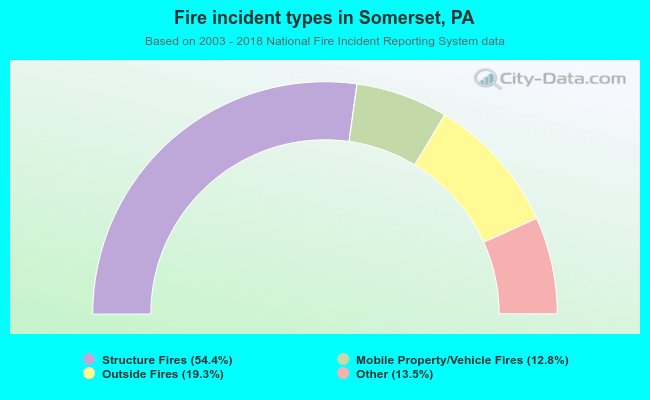 When looking into fire subcategories, the most reports belonged to: Structure Fires (54.4%), and Outside Fires (19.3%).
Fire-safe hotels and motels in Somerset, Pennsylvania:
- Highlander Motel, 799 N CTR Ave, Somerset, Pennsylvania 15501 , Phone: (814) 445-7988
- Comfort Inn, 202 Harmon St, Somerset, Pennsylvania 15501 , Phone: (814) 445-9611, Fax: (814) 445-5815
- SureStay Plus by Best Western, 138 Marsh Rd, Somerset, Pennsylvania 15501 , Phone: (814) 445-3996
- Quality Inn Somerset, 215 Ramada Rd, Somerset, Pennsylvania 15501 , Phone: (814) 443-4646, Fax: (814) 445-7539
- Hampton Inn, 324 Laurel Crest Rd, Somerset, Pennsylvania 15501 , Phone: (814) 445-9161, Fax: (814) 445-9162
- Holiday Inn Express Somerset, 132 Lewis Dr, Somerset, Pennsylvania 15501 , Phone: (814) 701-2762, Fax: (814) 701-2760
- Fairfield Inn and Suites By Marriott, 117 Tollgate Rd, Somerset, Pennsylvania 15501 , Phone: (888) 236-2427, Fax: (814) 701-2890
- Econo Lodge Somerset PA, 125 Lewis Dr, Somerset, Pennsylvania 15501 , Phone: (814) 445-8788, Fax: (814) 445-9245
| Most common first names in Somerset, PA among deceased individuals | ||
| Name | Count | Lived (average) |
|---|---|---|
| Mary | 402 | 80.3 years |
| John | 364 | 74.0 years |
| William | 276 | 74.6 years |
| Charles | 224 | 75.5 years |
| Robert | 224 | 71.0 years |
| James | 212 | 73.5 years |
| Harry | 172 | 76.9 years |
| Ruth | 160 | 80.3 years |
| Margaret | 158 | 83.2 years |
| George | 158 | 76.0 years |
| Most common last names in Somerset, PA among deceased individuals | ||
| Last name | Count | Lived (average) |
|---|---|---|
| Miller | 338 | 78.7 years |
| Walker | 164 | 78.3 years |
| Shaulis | 130 | 78.1 years |
| Shaffer | 126 | 77.0 years |
| Brant | 108 | 79.0 years |
| Baker | 92 | 77.2 years |
| Pyle | 88 | 76.9 years |
| Barron | 88 | 76.1 years |
| Schrock | 82 | 80.3 years |
| Smith | 78 | 71.2 years |
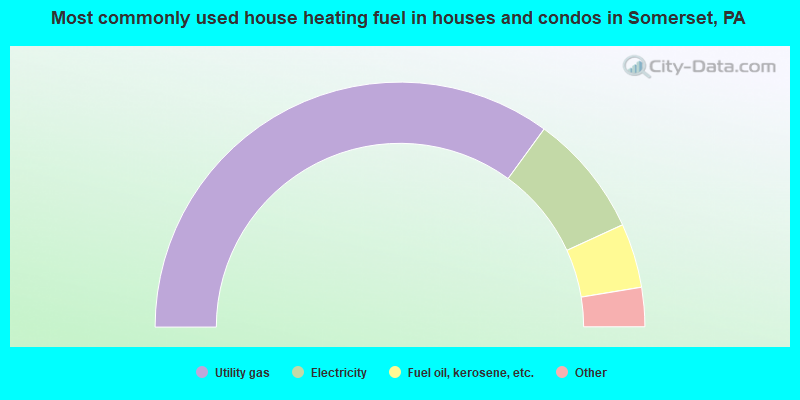
- 70.2%Utility gas
- 16.3%Electricity
- 8.5%Fuel oil, kerosene, etc.
- 2.6%Bottled, tank, or LP gas
- 2.4%Coal or coke
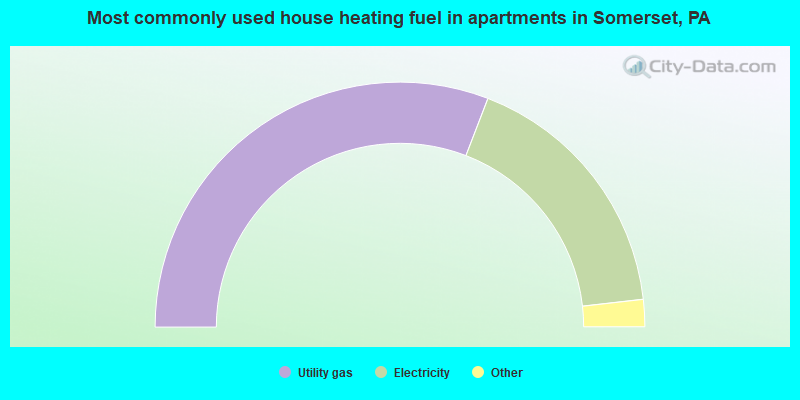
- 61.7%Utility gas
- 34.7%Electricity
- 2.3%Fuel oil, kerosene, etc.
- 1.2%Bottled, tank, or LP gas
Somerset compared to Pennsylvania state average:
- Median household income below state average.
- Median house value below state average.
- Unemployed percentage significantly below state average.
- Black race population percentage significantly below state average.
- Hispanic race population percentage significantly below state average.
- Foreign-born population percentage significantly below state average.
- Renting percentage above state average.
- Length of stay since moving in above state average.
- Number of college students significantly below state average.
Somerset on our top lists:
- #82 on the list of "Top 101 cities with the largest percentage of people in homes for abused, dependent, and neglected children (population 1,000+)"
- #95 on the list of "Top 101 cities with the most people born in the same U.S. state as the city (population 5,000+)"
- #13 on the list of "Top 101 counties with the lowest percentage of residents relocating to other counties in 2011"
- #52 on the list of "Top 101 counties with the highest number of deaths per 1000 residents 2007-2013 (pop. 50,000+)"
- #88 on the list of "Top 101 counties with highest percentage of residents voting for Romney (Republican) in the 2012 Presidential Election (pop. 50,000+)"

|
|
Total of 35 patent applications in 2008-2024.