Shelbyville, Indiana Submit your own pictures of this city and show them to the world
OSM Map
General Map
Google Map
MSN Map
OSM Map
General Map
Google Map
MSN Map
OSM Map
General Map
Google Map
MSN Map
OSM Map
General Map
Google Map
MSN Map
Please wait while loading the map...
Population in 2022: 20,159 (100% urban, 0% rural). Population change since 2000: +12.3%Males: 9,785 Females: 10,374
March 2022 cost of living index in Shelbyville: 86.7 (less than average, U.S. average is 100) Percentage of residents living in poverty in 2022: 18.8%for White Non-Hispanic residents , 58.4% for Black residents , 35.5% for Hispanic or Latino residents , 48.0% for other race residents , 11.9% for two or more races residents )
Profiles of local businesses
Business Search - 14 Million verified businesses
Data:
Median household income ($)
Median household income (% change since 2000)
Household income diversity
Ratio of average income to average house value (%)
Ratio of average income to average rent
Median household income ($) - White
Median household income ($) - Black or African American
Median household income ($) - Asian
Median household income ($) - Hispanic or Latino
Median household income ($) - American Indian and Alaska Native
Median household income ($) - Multirace
Median household income ($) - Other Race
Median household income for houses/condos with a mortgage ($)
Median household income for apartments without a mortgage ($)
Races - White alone (%)
Races - White alone (% change since 2000)
Races - Black alone (%)
Races - Black alone (% change since 2000)
Races - American Indian alone (%)
Races - American Indian alone (% change since 2000)
Races - Asian alone (%)
Races - Asian alone (% change since 2000)
Races - Hispanic (%)
Races - Hispanic (% change since 2000)
Races - Native Hawaiian and Other Pacific Islander alone (%)
Races - Native Hawaiian and Other Pacific Islander alone (% change since 2000)
Races - Two or more races (%)
Races - Two or more races (% change since 2000)
Races - Other race alone (%)
Races - Other race alone (% change since 2000)
Racial diversity
Unemployment (%)
Unemployment (% change since 2000)
Unemployment (%) - White
Unemployment (%) - Black or African American
Unemployment (%) - Asian
Unemployment (%) - Hispanic or Latino
Unemployment (%) - American Indian and Alaska Native
Unemployment (%) - Multirace
Unemployment (%) - Other Race
Population density (people per square mile)
Population - Males (%)
Population - Females (%)
Population - Males (%) - White
Population - Males (%) - Black or African American
Population - Males (%) - Asian
Population - Males (%) - Hispanic or Latino
Population - Males (%) - American Indian and Alaska Native
Population - Males (%) - Multirace
Population - Males (%) - Other Race
Population - Females (%) - White
Population - Females (%) - Black or African American
Population - Females (%) - Asian
Population - Females (%) - Hispanic or Latino
Population - Females (%) - American Indian and Alaska Native
Population - Females (%) - Multirace
Population - Females (%) - Other Race
Coronavirus confirmed cases (May 14, 2024)
Deaths caused by coronavirus (May 14, 2024)
Coronavirus confirmed cases (per 100k population) (May 14, 2024)
Deaths caused by coronavirus (per 100k population) (May 14, 2024)
Daily increase in number of cases (May 14, 2024)
Weekly increase in number of cases (May 14, 2024)
Cases doubled (in days) (May 14, 2024)
Hospitalized patients (Apr 18, 2022)
Negative test results (Apr 18, 2022)
Total test results (Apr 18, 2022)
COVID Vaccine doses distributed (per 100k population) (Sep 19, 2023)
COVID Vaccine doses administered (per 100k population) (Sep 19, 2023)
COVID Vaccine doses distributed (Sep 19, 2023)
COVID Vaccine doses administered (Sep 19, 2023)
Likely homosexual households (%)
Likely homosexual households (% change since 2000)
Likely homosexual households - Lesbian couples (%)
Likely homosexual households - Lesbian couples (% change since 2000)
Likely homosexual households - Gay men (%)
Likely homosexual households - Gay men (% change since 2000)
Cost of living index
Median gross rent ($)
Median contract rent ($)
Median monthly housing costs ($)
Median house or condo value ($)
Median house or condo value ($ change since 2000)
Mean house or condo value by units in structure - 1, detached ($)
Mean house or condo value by units in structure - 1, attached ($)
Mean house or condo value by units in structure - 2 ($)
Mean house or condo value by units in structure by units in structure - 3 or 4 ($)
Mean house or condo value by units in structure - 5 or more ($)
Mean house or condo value by units in structure - Boat, RV, van, etc. ($)
Mean house or condo value by units in structure - Mobile home ($)
Median house or condo value ($) - White
Median house or condo value ($) - Black or African American
Median house or condo value ($) - Asian
Median house or condo value ($) - Hispanic or Latino
Median house or condo value ($) - American Indian and Alaska Native
Median house or condo value ($) - Multirace
Median house or condo value ($) - Other Race
Median resident age
Resident age diversity
Median resident age - Males
Median resident age - Females
Median resident age - White
Median resident age - Black or African American
Median resident age - Asian
Median resident age - Hispanic or Latino
Median resident age - American Indian and Alaska Native
Median resident age - Multirace
Median resident age - Other Race
Median resident age - Males - White
Median resident age - Males - Black or African American
Median resident age - Males - Asian
Median resident age - Males - Hispanic or Latino
Median resident age - Males - American Indian and Alaska Native
Median resident age - Males - Multirace
Median resident age - Males - Other Race
Median resident age - Females - White
Median resident age - Females - Black or African American
Median resident age - Females - Asian
Median resident age - Females - Hispanic or Latino
Median resident age - Females - American Indian and Alaska Native
Median resident age - Females - Multirace
Median resident age - Females - Other Race
Commute - mean travel time to work (minutes)
Travel time to work - Less than 5 minutes (%)
Travel time to work - Less than 5 minutes (% change since 2000)
Travel time to work - 5 to 9 minutes (%)
Travel time to work - 5 to 9 minutes (% change since 2000)
Travel time to work - 10 to 19 minutes (%)
Travel time to work - 10 to 19 minutes (% change since 2000)
Travel time to work - 20 to 29 minutes (%)
Travel time to work - 20 to 29 minutes (% change since 2000)
Travel time to work - 30 to 39 minutes (%)
Travel time to work - 30 to 39 minutes (% change since 2000)
Travel time to work - 40 to 59 minutes (%)
Travel time to work - 40 to 59 minutes (% change since 2000)
Travel time to work - 60 to 89 minutes (%)
Travel time to work - 60 to 89 minutes (% change since 2000)
Travel time to work - 90 or more minutes (%)
Travel time to work - 90 or more minutes (% change since 2000)
Marital status - Never married (%)
Marital status - Now married (%)
Marital status - Separated (%)
Marital status - Widowed (%)
Marital status - Divorced (%)
Median family income ($)
Median family income (% change since 2000)
Median non-family income ($)
Median non-family income (% change since 2000)
Median per capita income ($)
Median per capita income (% change since 2000)
Median family income ($) - White
Median family income ($) - Black or African American
Median family income ($) - Asian
Median family income ($) - Hispanic or Latino
Median family income ($) - American Indian and Alaska Native
Median family income ($) - Multirace
Median family income ($) - Other Race
Median year house/condo built
Median year apartment built
Year house built - Built 2005 or later (%)
Year house built - Built 2000 to 2004 (%)
Year house built - Built 1990 to 1999 (%)
Year house built - Built 1980 to 1989 (%)
Year house built - Built 1970 to 1979 (%)
Year house built - Built 1960 to 1969 (%)
Year house built - Built 1950 to 1959 (%)
Year house built - Built 1940 to 1949 (%)
Year house built - Built 1939 or earlier (%)
Average household size
Household density (households per square mile)
Average household size - White
Average household size - Black or African American
Average household size - Asian
Average household size - Hispanic or Latino
Average household size - American Indian and Alaska Native
Average household size - Multirace
Average household size - Other Race
Occupied housing units (%)
Vacant housing units (%)
Owner occupied housing units (%)
Renter occupied housing units (%)
Vacancy status - For rent (%)
Vacancy status - For sale only (%)
Vacancy status - Rented or sold, not occupied (%)
Vacancy status - For seasonal, recreational, or occasional use (%)
Vacancy status - For migrant workers (%)
Vacancy status - Other vacant (%)
Residents with income below the poverty level (%)
Residents with income below 50% of the poverty level (%)
Children below poverty level (%)
Poor families by family type - Married-couple family (%)
Poor families by family type - Male, no wife present (%)
Poor families by family type - Female, no husband present (%)
Poverty status for native-born residents (%)
Poverty status for foreign-born residents (%)
Poverty among high school graduates not in families (%)
Poverty among people who did not graduate high school not in families (%)
Residents with income below the poverty level (%) - White
Residents with income below the poverty level (%) - Black or African American
Residents with income below the poverty level (%) - Asian
Residents with income below the poverty level (%) - Hispanic or Latino
Residents with income below the poverty level (%) - American Indian and Alaska Native
Residents with income below the poverty level (%) - Multirace
Residents with income below the poverty level (%) - Other Race
Air pollution - Air Quality Index (AQI)
Air pollution - CO
Air pollution - NO2
Air pollution - SO2
Air pollution - Ozone
Air pollution - PM10
Air pollution - PM25
Air pollution - Pb
Crime - Murders per 100,000 population
Crime - Rapes per 100,000 population
Crime - Robberies per 100,000 population
Crime - Assaults per 100,000 population
Crime - Burglaries per 100,000 population
Crime - Thefts per 100,000 population
Crime - Auto thefts per 100,000 population
Crime - Arson per 100,000 population
Crime - City-data.com crime index
Crime - Violent crime index
Crime - Property crime index
Crime - Murders per 100,000 population (5 year average)
Crime - Rapes per 100,000 population (5 year average)
Crime - Robberies per 100,000 population (5 year average)
Crime - Assaults per 100,000 population (5 year average)
Crime - Burglaries per 100,000 population (5 year average)
Crime - Thefts per 100,000 population (5 year average)
Crime - Auto thefts per 100,000 population (5 year average)
Crime - Arson per 100,000 population (5 year average)
Crime - City-data.com crime index (5 year average)
Crime - Violent crime index (5 year average)
Crime - Property crime index (5 year average)
1996 Presidential Elections Results (%) - Democratic Party (Clinton)
1996 Presidential Elections Results (%) - Republican Party (Dole)
1996 Presidential Elections Results (%) - Other
2000 Presidential Elections Results (%) - Democratic Party (Gore)
2000 Presidential Elections Results (%) - Republican Party (Bush)
2000 Presidential Elections Results (%) - Other
2004 Presidential Elections Results (%) - Democratic Party (Kerry)
2004 Presidential Elections Results (%) - Republican Party (Bush)
2004 Presidential Elections Results (%) - Other
2008 Presidential Elections Results (%) - Democratic Party (Obama)
2008 Presidential Elections Results (%) - Republican Party (McCain)
2008 Presidential Elections Results (%) - Other
2012 Presidential Elections Results (%) - Democratic Party (Obama)
2012 Presidential Elections Results (%) - Republican Party (Romney)
2012 Presidential Elections Results (%) - Other
2016 Presidential Elections Results (%) - Democratic Party (Clinton)
2016 Presidential Elections Results (%) - Republican Party (Trump)
2016 Presidential Elections Results (%) - Other
2020 Presidential Elections Results (%) - Democratic Party (Biden)
2020 Presidential Elections Results (%) - Republican Party (Trump)
2020 Presidential Elections Results (%) - Other
Ancestries Reported - Arab (%)
Ancestries Reported - Czech (%)
Ancestries Reported - Danish (%)
Ancestries Reported - Dutch (%)
Ancestries Reported - English (%)
Ancestries Reported - French (%)
Ancestries Reported - French Canadian (%)
Ancestries Reported - German (%)
Ancestries Reported - Greek (%)
Ancestries Reported - Hungarian (%)
Ancestries Reported - Irish (%)
Ancestries Reported - Italian (%)
Ancestries Reported - Lithuanian (%)
Ancestries Reported - Norwegian (%)
Ancestries Reported - Polish (%)
Ancestries Reported - Portuguese (%)
Ancestries Reported - Russian (%)
Ancestries Reported - Scotch-Irish (%)
Ancestries Reported - Scottish (%)
Ancestries Reported - Slovak (%)
Ancestries Reported - Subsaharan African (%)
Ancestries Reported - Swedish (%)
Ancestries Reported - Swiss (%)
Ancestries Reported - Ukrainian (%)
Ancestries Reported - United States (%)
Ancestries Reported - Welsh (%)
Ancestries Reported - West Indian (%)
Ancestries Reported - Other (%)
Educational Attainment - No schooling completed (%)
Educational Attainment - Less than high school (%)
Educational Attainment - High school or equivalent (%)
Educational Attainment - Less than 1 year of college (%)
Educational Attainment - 1 or more years of college (%)
Educational Attainment - Associate degree (%)
Educational Attainment - Bachelor's degree (%)
Educational Attainment - Master's degree (%)
Educational Attainment - Professional school degree (%)
Educational Attainment - Doctorate degree (%)
School Enrollment - Nursery, preschool (%)
School Enrollment - Kindergarten (%)
School Enrollment - Grade 1 to 4 (%)
School Enrollment - Grade 5 to 8 (%)
School Enrollment - Grade 9 to 12 (%)
School Enrollment - College undergrad (%)
School Enrollment - Graduate or professional (%)
School Enrollment - Not enrolled in school (%)
School enrollment - Public schools (%)
School enrollment - Private schools (%)
School enrollment - Not enrolled (%)
Median number of rooms in houses and condos
Median number of rooms in apartments
Housing units lacking complete plumbing facilities (%)
Housing units lacking complete kitchen facilities (%)
Density of houses
Urban houses (%)
Rural houses (%)
Households with people 60 years and over (%)
Households with people 65 years and over (%)
Households with people 75 years and over (%)
Households with one or more nonrelatives (%)
Households with no nonrelatives (%)
Population in households (%)
Family households (%)
Nonfamily households (%)
Population in families (%)
Family households with own children (%)
Median number of bedrooms in owner occupied houses
Mean number of bedrooms in owner occupied houses
Median number of bedrooms in renter occupied houses
Mean number of bedrooms in renter occupied houses
Median number of vehichles in owner occupied houses
Mean number of vehichles in owner occupied houses
Median number of vehichles in renter occupied houses
Mean number of vehichles in renter occupied houses
Mortgage status - with mortgage (%)
Mortgage status - with second mortgage (%)
Mortgage status - with home equity loan (%)
Mortgage status - with both second mortgage and home equity loan (%)
Mortgage status - without a mortgage (%)
Average family size
Average family size - White
Average family size - Black or African American
Average family size - Asian
Average family size - Hispanic or Latino
Average family size - American Indian and Alaska Native
Average family size - Multirace
Average family size - Other Race
Geographical mobility - Same house 1 year ago (%)
Geographical mobility - Moved within same county (%)
Geographical mobility - Moved from different county within same state (%)
Geographical mobility - Moved from different state (%)
Geographical mobility - Moved from abroad (%)
Place of birth - Born in state of residence (%)
Place of birth - Born in other state (%)
Place of birth - Native, outside of US (%)
Place of birth - Foreign born (%)
Housing units in structures - 1, detached (%)
Housing units in structures - 1, attached (%)
Housing units in structures - 2 (%)
Housing units in structures - 3 or 4 (%)
Housing units in structures - 5 to 9 (%)
Housing units in structures - 10 to 19 (%)
Housing units in structures - 20 to 49 (%)
Housing units in structures - 50 or more (%)
Housing units in structures - Mobile home (%)
Housing units in structures - Boat, RV, van, etc. (%)
House/condo owner moved in on average (years ago)
Renter moved in on average (years ago)
Year householder moved into unit - Moved in 1999 to March 2000 (%)
Year householder moved into unit - Moved in 1995 to 1998 (%)
Year householder moved into unit - Moved in 1990 to 1994 (%)
Year householder moved into unit - Moved in 1980 to 1989 (%)
Year householder moved into unit - Moved in 1970 to 1979 (%)
Year householder moved into unit - Moved in 1969 or earlier (%)
Means of transportation to work - Drove car alone (%)
Means of transportation to work - Carpooled (%)
Means of transportation to work - Public transportation (%)
Means of transportation to work - Bus or trolley bus (%)
Means of transportation to work - Streetcar or trolley car (%)
Means of transportation to work - Subway or elevated (%)
Means of transportation to work - Railroad (%)
Means of transportation to work - Ferryboat (%)
Means of transportation to work - Taxicab (%)
Means of transportation to work - Motorcycle (%)
Means of transportation to work - Bicycle (%)
Means of transportation to work - Walked (%)
Means of transportation to work - Other means (%)
Working at home (%)
Industry diversity
Most Common Industries - Agriculture, forestry, fishing and hunting, and mining (%)
Most Common Industries - Agriculture, forestry, fishing and hunting (%)
Most Common Industries - Mining, quarrying, and oil and gas extraction (%)
Most Common Industries - Construction (%)
Most Common Industries - Manufacturing (%)
Most Common Industries - Wholesale trade (%)
Most Common Industries - Retail trade (%)
Most Common Industries - Transportation and warehousing, and utilities (%)
Most Common Industries - Transportation and warehousing (%)
Most Common Industries - Utilities (%)
Most Common Industries - Information (%)
Most Common Industries - Finance and insurance, and real estate and rental and leasing (%)
Most Common Industries - Finance and insurance (%)
Most Common Industries - Real estate and rental and leasing (%)
Most Common Industries - Professional, scientific, and management, and administrative and waste management services (%)
Most Common Industries - Professional, scientific, and technical services (%)
Most Common Industries - Management of companies and enterprises (%)
Most Common Industries - Administrative and support and waste management services (%)
Most Common Industries - Educational services, and health care and social assistance (%)
Most Common Industries - Educational services (%)
Most Common Industries - Health care and social assistance (%)
Most Common Industries - Arts, entertainment, and recreation, and accommodation and food services (%)
Most Common Industries - Arts, entertainment, and recreation (%)
Most Common Industries - Accommodation and food services (%)
Most Common Industries - Other services, except public administration (%)
Most Common Industries - Public administration (%)
Occupation diversity
Most Common Occupations - Management, business, science, and arts occupations (%)
Most Common Occupations - Management, business, and financial occupations (%)
Most Common Occupations - Management occupations (%)
Most Common Occupations - Business and financial operations occupations (%)
Most Common Occupations - Computer, engineering, and science occupations (%)
Most Common Occupations - Computer and mathematical occupations (%)
Most Common Occupations - Architecture and engineering occupations (%)
Most Common Occupations - Life, physical, and social science occupations (%)
Most Common Occupations - Education, legal, community service, arts, and media occupations (%)
Most Common Occupations - Community and social service occupations (%)
Most Common Occupations - Legal occupations (%)
Most Common Occupations - Education, training, and library occupations (%)
Most Common Occupations - Arts, design, entertainment, sports, and media occupations (%)
Most Common Occupations - Healthcare practitioners and technical occupations (%)
Most Common Occupations - Health diagnosing and treating practitioners and other technical occupations (%)
Most Common Occupations - Health technologists and technicians (%)
Most Common Occupations - Service occupations (%)
Most Common Occupations - Healthcare support occupations (%)
Most Common Occupations - Protective service occupations (%)
Most Common Occupations - Fire fighting and prevention, and other protective service workers including supervisors (%)
Most Common Occupations - Law enforcement workers including supervisors (%)
Most Common Occupations - Food preparation and serving related occupations (%)
Most Common Occupations - Building and grounds cleaning and maintenance occupations (%)
Most Common Occupations - Personal care and service occupations (%)
Most Common Occupations - Sales and office occupations (%)
Most Common Occupations - Sales and related occupations (%)
Most Common Occupations - Office and administrative support occupations (%)
Most Common Occupations - Natural resources, construction, and maintenance occupations (%)
Most Common Occupations - Farming, fishing, and forestry occupations (%)
Most Common Occupations - Construction and extraction occupations (%)
Most Common Occupations - Installation, maintenance, and repair occupations (%)
Most Common Occupations - Production, transportation, and material moving occupations (%)
Most Common Occupations - Production occupations (%)
Most Common Occupations - Transportation occupations (%)
Most Common Occupations - Material moving occupations (%)
People in Group quarters - Institutionalized population (%)
People in Group quarters - Correctional institutions (%)
People in Group quarters - Federal prisons and detention centers (%)
People in Group quarters - Halfway houses (%)
People in Group quarters - Local jails and other confinement facilities (including police lockups) (%)
People in Group quarters - Military disciplinary barracks (%)
People in Group quarters - State prisons (%)
People in Group quarters - Other types of correctional institutions (%)
People in Group quarters - Nursing homes (%)
People in Group quarters - Hospitals/wards, hospices, and schools for the handicapped (%)
People in Group quarters - Hospitals/wards and hospices for chronically ill (%)
People in Group quarters - Hospices or homes for chronically ill (%)
People in Group quarters - Military hospitals or wards for chronically ill (%)
People in Group quarters - Other hospitals or wards for chronically ill (%)
People in Group quarters - Hospitals or wards for drug/alcohol abuse (%)
People in Group quarters - Mental (Psychiatric) hospitals or wards (%)
People in Group quarters - Schools, hospitals, or wards for the mentally retarded (%)
People in Group quarters - Schools, hospitals, or wards for the physically handicapped (%)
People in Group quarters - Institutions for the deaf (%)
People in Group quarters - Institutions for the blind (%)
People in Group quarters - Orthopedic wards and institutions for the physically handicapped (%)
People in Group quarters - Wards in general hospitals for patients who have no usual home elsewhere (%)
People in Group quarters - Wards in military hospitals for patients who have no usual home elsewhere (%)
People in Group quarters - Juvenile institutions (%)
People in Group quarters - Long-term care (%)
People in Group quarters - Homes for abused, dependent, and neglected children (%)
People in Group quarters - Residential treatment centers for emotionally disturbed children (%)
People in Group quarters - Training schools for juvenile delinquents (%)
People in Group quarters - Short-term care, detention or diagnostic centers for delinquent children (%)
People in Group quarters - Type of juvenile institution unknown (%)
People in Group quarters - Noninstitutionalized population (%)
People in Group quarters - College dormitories (includes college quarters off campus) (%)
People in Group quarters - Military quarters (%)
People in Group quarters - On base (%)
People in Group quarters - Barracks, unaccompanied personnel housing (UPH), (Enlisted/Officer), ;and similar group living quarters for military personnel (%)
People in Group quarters - Transient quarters for temporary residents (%)
People in Group quarters - Military ships (%)
People in Group quarters - Group homes (%)
People in Group quarters - Homes or halfway houses for drug/alcohol abuse (%)
People in Group quarters - Homes for the mentally ill (%)
People in Group quarters - Homes for the mentally retarded (%)
People in Group quarters - Homes for the physically handicapped (%)
People in Group quarters - Other group homes (%)
People in Group quarters - Religious group quarters (%)
People in Group quarters - Dormitories (%)
People in Group quarters - Agriculture workers' dormitories on farms (%)
People in Group quarters - Job Corps and vocational training facilities (%)
People in Group quarters - Other workers' dormitories (%)
People in Group quarters - Crews of maritime vessels (%)
People in Group quarters - Other nonhousehold living situations (%)
People in Group quarters - Other noninstitutional group quarters (%)
Residents speaking English at home (%)
Residents speaking English at home - Born in the United States (%)
Residents speaking English at home - Native, born elsewhere (%)
Residents speaking English at home - Foreign born (%)
Residents speaking Spanish at home (%)
Residents speaking Spanish at home - Born in the United States (%)
Residents speaking Spanish at home - Native, born elsewhere (%)
Residents speaking Spanish at home - Foreign born (%)
Residents speaking other language at home (%)
Residents speaking other language at home - Born in the United States (%)
Residents speaking other language at home - Native, born elsewhere (%)
Residents speaking other language at home - Foreign born (%)
Class of Workers - Employee of private company (%)
Class of Workers - Self-employed in own incorporated business (%)
Class of Workers - Private not-for-profit wage and salary workers (%)
Class of Workers - Local government workers (%)
Class of Workers - State government workers (%)
Class of Workers - Federal government workers (%)
Class of Workers - Self-employed workers in own not incorporated business and Unpaid family workers (%)
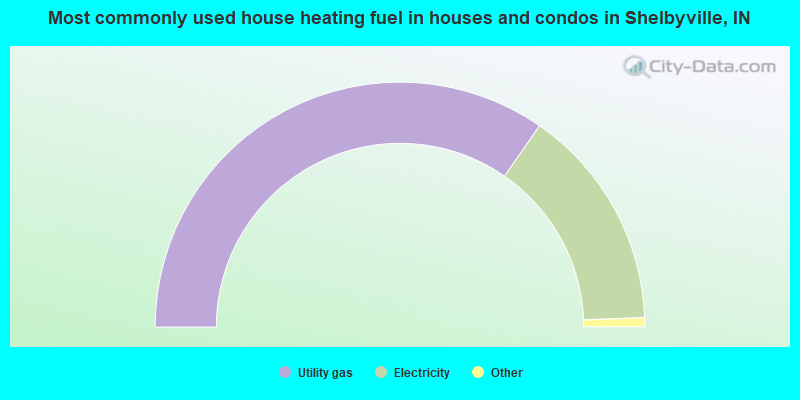
House heating fuel used in houses and condos - Utility gas (%)
House heating fuel used in houses and condos - Bottled, tank, or LP gas (%)
House heating fuel used in houses and condos - Electricity (%)
House heating fuel used in houses and condos - Fuel oil, kerosene, etc. (%)
House heating fuel used in houses and condos - Coal or coke (%)
House heating fuel used in houses and condos - Wood (%)
House heating fuel used in houses and condos - Solar energy (%)
House heating fuel used in houses and condos - Other fuel (%)
House heating fuel used in houses and condos - No fuel used (%)
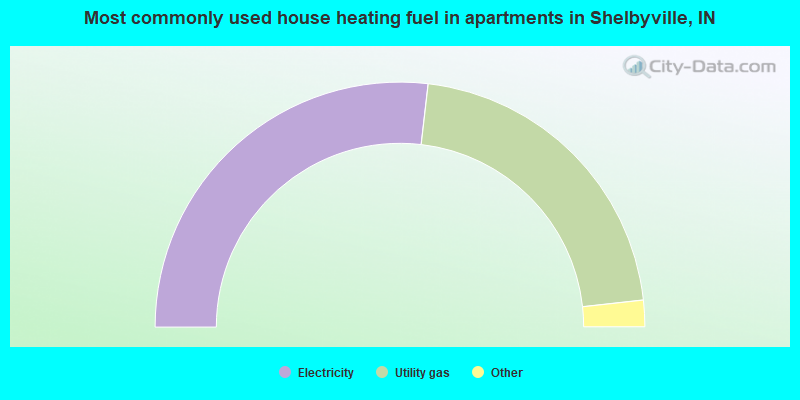
House heating fuel used in apartments - Utility gas (%)
House heating fuel used in apartments - Bottled, tank, or LP gas (%)
House heating fuel used in apartments - Electricity (%)
House heating fuel used in apartments - Fuel oil, kerosene, etc. (%)
House heating fuel used in apartments - Coal or coke (%)
House heating fuel used in apartments - Wood (%)
House heating fuel used in apartments - Solar energy (%)
House heating fuel used in apartments - Other fuel (%)
House heating fuel used in apartments - No fuel used (%)
Armed forces status - In Armed Forces (%)
Armed forces status - Civilian (%)
Armed forces status - Civilian - Veteran (%)
Armed forces status - Civilian - Nonveteran (%)
Fatal accidents locations in years 2005-2021
Fatal accidents locations in 2005
Fatal accidents locations in 2006
Fatal accidents locations in 2007
Fatal accidents locations in 2008
Fatal accidents locations in 2009
Fatal accidents locations in 2010
Fatal accidents locations in 2011
Fatal accidents locations in 2012
Fatal accidents locations in 2013
Fatal accidents locations in 2014
Fatal accidents locations in 2015
Fatal accidents locations in 2016
Fatal accidents locations in 2017
Fatal accidents locations in 2018
Fatal accidents locations in 2019
Fatal accidents locations in 2020
Fatal accidents locations in 2021
Alcohol use - People drinking some alcohol every month (%)
Alcohol use - People not drinking at all (%)
Alcohol use - Average days/month drinking alcohol
Alcohol use - Average drinks/week
Alcohol use - Average days/year people drink much
Audiometry - Average condition of hearing (%)
Audiometry - People that can hear a whisper from across a quiet room (%)
Audiometry - People that can hear normal voice from across a quiet room (%)
Audiometry - Ears ringing, roaring, buzzing (%)
Audiometry - Had a job exposure to loud noise (%)
Audiometry - Had off-work exposure to loud noise (%)
Blood Pressure & Cholesterol - Has high blood pressure (%)
Blood Pressure & Cholesterol - Checking blood pressure at home (%)
Blood Pressure & Cholesterol - Frequently checking blood cholesterol (%)
Blood Pressure & Cholesterol - Has high cholesterol level (%)
Consumer Behavior - Money monthly spent on food at supermarket/grocery store
Consumer Behavior - Money monthly spent on food at other stores
Consumer Behavior - Money monthly spent on eating out
Consumer Behavior - Money monthly spent on carryout/delivered foods
Consumer Behavior - Income spent on food at supermarket/grocery store (%)
Consumer Behavior - Income spent on food at other stores (%)
Consumer Behavior - Income spent on eating out (%)
Consumer Behavior - Income spent on carryout/delivered foods (%)
Current Health Status - General health condition (%)
Current Health Status - Blood donors (%)
Current Health Status - Has blood ever tested for HIV virus (%)
Current Health Status - Left-handed people (%)
Dermatology - People using sunscreen (%)
Diabetes - Diabetics (%)
Diabetes - Had a blood test for high blood sugar (%)
Diabetes - People taking insulin (%)
Diet Behavior & Nutrition - Diet health (%)
Diet Behavior & Nutrition - Milk product consumption (# of products/month)
Diet Behavior & Nutrition - Meals not home prepared (#/week)
Diet Behavior & Nutrition - Meals from fast food or pizza place (#/week)
Diet Behavior & Nutrition - Ready-to-eat foods (#/month)
Diet Behavior & Nutrition - Frozen meals/pizza (#/month)
Drug Use - People that ever used marijuana or hashish (%)
Drug Use - Ever used hard drugs (%)
Drug Use - Ever used any form of cocaine (%)
Drug Use - Ever used heroin (%)
Drug Use - Ever used methamphetamine (%)
Health Insurance - People covered by health insurance (%)
Kidney Conditions-Urology - Avg. # of times urinating at night
Medical Conditions - People with asthma (%)
Medical Conditions - People with anemia (%)
Medical Conditions - People with psoriasis (%)
Medical Conditions - People with overweight (%)
Medical Conditions - Elderly people having difficulties in thinking or remembering (%)
Medical Conditions - People who ever received blood transfusion (%)
Medical Conditions - People having trouble seeing even with glass/contacts (%)
Medical Conditions - People with arthritis (%)
Medical Conditions - People with gout (%)
Medical Conditions - People with congestive heart failure (%)
Medical Conditions - People with coronary heart disease (%)
Medical Conditions - People with angina pectoris (%)
Medical Conditions - People who ever had heart attack (%)
Medical Conditions - People who ever had stroke (%)
Medical Conditions - People with emphysema (%)
Medical Conditions - People with thyroid problem (%)
Medical Conditions - People with chronic bronchitis (%)
Medical Conditions - People with any liver condition (%)
Medical Conditions - People who ever had cancer or malignancy (%)
Mental Health - People who have little interest in doing things (%)
Mental Health - People feeling down, depressed, or hopeless (%)
Mental Health - People who have trouble sleeping or sleeping too much (%)
Mental Health - People feeling tired or having little energy (%)
Mental Health - People with poor appetite or overeating (%)
Mental Health - People feeling bad about themself (%)
Mental Health - People who have trouble concentrating on things (%)
Mental Health - People moving or speaking slowly or too fast (%)
Mental Health - People having thoughts they would be better off dead (%)
Oral Health - Average years since last visit a dentist
Oral Health - People embarrassed because of mouth (%)
Oral Health - People with gum disease (%)
Oral Health - General health of teeth and gums (%)
Oral Health - Average days a week using dental floss/device
Oral Health - Average days a week using mouthwash for dental problem
Oral Health - Average number of teeth
Pesticide Use - Households using pesticides to control insects (%)
Pesticide Use - Households using pesticides to kill weeds (%)
Physical Activity - People doing vigorous-intensity work activities (%)
Physical Activity - People doing moderate-intensity work activities (%)
Physical Activity - People walking or bicycling (%)
Physical Activity - People doing vigorous-intensity recreational activities (%)
Physical Activity - People doing moderate-intensity recreational activities (%)
Physical Activity - Average hours a day doing sedentary activities
Physical Activity - Average hours a day watching TV or videos
Physical Activity - Average hours a day using computer
Physical Functioning - People having limitations keeping them from working (%)
Physical Functioning - People limited in amount of work they can do (%)
Physical Functioning - People that need special equipment to walk (%)
Physical Functioning - People experiencing confusion/memory problems (%)
Physical Functioning - People requiring special healthcare equipment (%)
Prescription Medications - Average number of prescription medicines taking
Preventive Aspirin Use - Adults 40+ taking low-dose aspirin (%)
Reproductive Health - Vaginal deliveries (%)
Reproductive Health - Cesarean deliveries (%)
Reproductive Health - Deliveries resulted in a live birth (%)
Reproductive Health - Pregnancies resulted in a delivery (%)
Reproductive Health - Women breastfeeding newborns (%)
Reproductive Health - Women that had a hysterectomy (%)
Reproductive Health - Women that had both ovaries removed (%)
Reproductive Health - Women that have ever taken birth control pills (%)
Reproductive Health - Women taking birth control pills (%)
Reproductive Health - Women that have ever used Depo-Provera or injectables (%)
Reproductive Health - Women that have ever used female hormones (%)
Sexual Behavior - People 18+ that ever had sex (vaginal, anal, or oral) (%)
Sexual Behavior - Males 18+ that ever had vaginal sex with a woman (%)
Sexual Behavior - Males 18+ that ever performed oral sex on a woman (%)
Sexual Behavior - Males 18+ that ever had anal sex with a woman (%)
Sexual Behavior - Males 18+ that ever had any sex with a man (%)
Sexual Behavior - Females 18+ that ever had vaginal sex with a man (%)
Sexual Behavior - Females 18+ that ever performed oral sex on a man (%)
Sexual Behavior - Females 18+ that ever had anal sex with a man (%)
Sexual Behavior - Females 18+ that ever had any kind of sex with a woman (%)
Sexual Behavior - Average age people first had sex
Sexual Behavior - Average number of female sex partners in lifetime (males 18+)
Sexual Behavior - Average number of female vaginal sex partners in lifetime (males 18+)
Sexual Behavior - Average age people first performed oral sex on a woman (18+)
Sexual Behavior - Average number of woman performed oral sex on in lifetime (18+)
Sexual Behavior - Average number of male sex partners in lifetime (males 18+)
Sexual Behavior - Average number of male anal sex partners in lifetime (males 18+)
Sexual Behavior - Average age people first performed oral sex on a man (18+)
Sexual Behavior - Average number of male oral sex partners in lifetime (18+)
Sexual Behavior - People using protection when performing oral sex (%)
Sexual Behavior - Average number of times people have vaginal or anal sex a year
Sexual Behavior - People having sex without condom (%)
Sexual Behavior - Average number of male sex partners in lifetime (females 18+)
Sexual Behavior - Average number of male vaginal sex partners in lifetime (females 18+)
Sexual Behavior - Average number of female sex partners in lifetime (females 18+)
Sexual Behavior - Circumcised males 18+ (%)
Sleep Disorders - Average hours sleeping at night
Sleep Disorders - People that has trouble sleeping (%)
Smoking-Cigarette Use - People smoking cigarettes (%)
Taste & Smell - People 40+ having problems with smell (%)
Taste & Smell - People 40+ having problems with taste (%)
Taste & Smell - People 40+ that ever had wisdom teeth removed (%)
Taste & Smell - People 40+ that ever had tonsils teeth removed (%)
Taste & Smell - People 40+ that ever had a loss of consciousness because of a head injury (%)
Taste & Smell - People 40+ that ever had a broken nose or other serious injury to face or skull (%)
Taste & Smell - People 40+ that ever had two or more sinus infections (%)
Weight - Average height (inches)
Weight - Average weight (pounds)
Weight - Average BMI
Weight - People that are obese (%)
Weight - People that ever were obese (%)
Weight - People trying to lose weight (%)
According to our research of Indiana and other state lists, there were 3 registered sex offenders living in Shelbyville, Indiana as of May 14, 2024 . The ratio of all residents to sex offenders in Shelbyville is 6,403 to 1.The ratio of registered sex offenders to all residents in this city is much lower than the state average.
Officers per 1,000 residents here:
2.31Indiana average:
2.12
Latest news from Shelbyville, IN collected exclusively by city-data.com from local newspapers, TV, and radio stations
Ancestries: American (28.1%), German (11.3%), English (8.5%), Irish (6.6%), Scottish (2.4%), European (2.3%).
Current Local Time:
Land area: 8.87 square miles.
Population density: 2,272 people per square mile (low).
1,415 residents are foreign born (4.0% Latin America , 1.7% Asia , 0.7% Africa ).
This city:
7.1%Indiana:
5.6%
Median real estate property taxes paid for housing units with mortgages in 2022: $1,231 (0.8%)Median real estate property taxes paid for housing units with no mortgage in 2022: $995 (0.7%)
Nearest city with pop. 50,000+: Indianapolis, IN
Nearest city with pop. 1,000,000+: Chicago, IL
Nearest cities:
Latitude: 39.52 N, Longitude: 85.78 W
Daytime population change due to commuting: +4,037 (+20.4%)Workers who live and work in this city: 5,212 (55.5%)
Single-family new house construction building permits:
2022: 98 buildings , average cost: $233,3002021: 91 buildings , average cost: $226,1002020: 47 buildings , average cost: $212,9002019: 34 buildings , average cost: $163,8002018: 55 buildings , average cost: $163,6002017: 44 buildings , average cost: $151,8002016: 28 buildings , average cost: $155,4002015: 18 buildings , average cost: $134,2002014: 12 buildings , average cost: $124,0002013: 17 buildings , average cost: $123,7002012: 14 buildings , average cost: $127,6002011: 16 buildings , average cost: $93,9002010: 18 buildings , average cost: $124,0002009: 4 buildings , average cost: $135,0002008: 46 buildings , average cost: $103,0002007: 60 buildings , average cost: $112,4002006: 88 buildings , average cost: $119,4002005: 175 buildings , average cost: $121,1002004: 74 buildings , average cost: $165,0002003: 45 buildings , average cost: $179,5002002: 50 buildings , average cost: $136,1002001: 33 buildings , average cost: $118,2002000: 34 buildings , average cost: $119,9001999: 79 buildings , average cost: $108,5001998: 70 buildings , average cost: $121,0001997: 48 buildings , average cost: $110,400Unemployment in December 2023:
Population change in the 1990s: +2,060 (+13.0%).
Most common occupations in Shelbyville, IN (%)
Both Males Females
Other production occupations, including supervisors (9.2%)
Metal workers and plastic workers (6.3%)
Laborers and material movers, hand (4.0%)
Material recording, scheduling, dispatching, and distributing workers (3.8%)
Building and grounds cleaning and maintenance occupations (3.6%)
Driver/sales workers and truck drivers (3.5%)
Other management occupations, except farmers and farm managers (3.4%)
Other production occupations, including supervisors (12.3%)
Metal workers and plastic workers (7.1%)
Driver/sales workers and truck drivers (6.2%)
Laborers and material movers, hand (5.9%)
Electrical equipment mechanics and other installation, maintenance, and repair workers, including supervisors (4.5%)
Material recording, scheduling, dispatching, and distributing workers (4.2%)
Building and grounds cleaning and maintenance occupations (3.5%)
Other production occupations, including supervisors (5.5%)
Metal workers and plastic workers (5.3%)
Other office and administrative support workers, including supervisors (4.7%)
Cashiers (4.1%)
Building and grounds cleaning and maintenance occupations (3.8%)
Secretaries and administrative assistants (3.7%)
Other management occupations, except farmers and farm managers (3.7%)
Tornado activity:
Shelbyville-area historical tornado activity is slightly above Indiana state average. It is 125% greater than the overall U.S. average.
On 4/25/1961, a category F4 (max. wind speeds 207-260 mph) tornado 4.2 miles away from the Shelbyville city center injured 7 people and caused between $500,000 and $5,000,000 in damages.
On 4/3/1974, a category F4 tornado 17.2 miles away from the city center injured 17 people and caused between $5,000,000 and $50,000,000 in damages.
Earthquake activity:
Shelbyville-area historical earthquake activity is significantly above Indiana state average. It is 76% greater than the overall U.S. average. On 4/18/2008 at 09:36:59, a magnitude 5.4 (5.1 MB, 4.8 MS, 5.4 MW, 5.2 MW, Class: Moderate, Intensity: VI - VII) earthquake occurred 135.4 miles away from Shelbyville center On 7/27/1980 at 18:52:21, a magnitude 5.2 (5.1 MB, 4.7 MS, 5.0 UK, 5.2 UK) earthquake occurred 134.3 miles away from the city center On 4/18/2008 at 09:36:59, a magnitude 5.2 (5.2 MW, Depth: 8.9 mi) earthquake occurred 135.4 miles away from Shelbyville center On 6/10/1987 at 23:48:54, a magnitude 5.1 (4.9 MB, 4.4 MS, 4.6 MS, 5.1 LG) earthquake occurred 123.0 miles away from Shelbyville center On 6/18/2002 at 17:37:15, a magnitude 5.0 (4.3 MB, 4.6 MW, 5.0 LG) earthquake occurred 151.5 miles away from the city center On 4/18/2008 at 15:14:16, a magnitude 4.8 (4.5 MB, 4.8 MW, 4.6 MW, Class: Light, Intensity: IV - V) earthquake occurred 132.7 miles away from the city center Magnitude types: regional Lg-wave magnitude (LG), body-wave magnitude (MB), surface-wave magnitude (MS), moment magnitude (MW) Natural disasters: The number of natural disasters in Shelby County (12) is smaller than the US average (15).Major Disasters (Presidential) Declared: 8Emergencies Declared: 3Floods: 5, Storms: 5, Tornadoes: 4, Winter Storms: 2, Blizzard: 1, Hurricane: 1, Snow: 1, Other: 1 (Note: some incidents may be assigned to more than one category). Hospitals and medical centers in Shelbyville: DEVELOPMENTAL SERVICE ALTERNAT (3222 S 125 E) DEVELOPMENTAL SERVICE ALTERNAT (2326 BERWICK DRIVE) MAJOR HOSPITAL (Government - Local, provides emergency services, 150 W WASHINGTON ST) ASHFORD PLACE HEALTH CAMPUS (2200 N RILEY HWY)
ESPECIALLY KIDZ HEALTH AND REHAB (2325 S MILLER ST)
HERITAGE HOUSE OF SHELBYVILLE (2309 S MILLER ST)
DAVITA - BLUE RIVER VALLEY RENAL CENTER (2309 S MILLER STREET STE 100)
FMC- SHELBYVILLE (2500 PARKWAY DR.)
MAJOR HOME CARE (30 W RAMPART PROFESSIONAL BLDG 110)
Colleges/universities with over 2000 students nearest to Shelbyville:
University of Indianapolis (about 24 miles; Indianapolis, IN ; Full-time enrollment: 4,625)
Harrison College-Indianapolis (about 27 miles; Indianapolis, IN ; FT enrollment: 4,244)
American College of Education (about 27 miles; Indianapolis, IN ; FT enrollment: 2,718)
Indiana University-Purdue University-Indianapolis (about 28 miles; Indianapolis, IN ; FT enrollment: 22,751)
Ivy Tech Community College (about 29 miles; Indianapolis, IN ; FT enrollment: 71,493)
Butler University (about 31 miles; Indianapolis, IN ; FT enrollment: 4,388)
Marian University (about 31 miles; Indianapolis, IN ; FT enrollment: 2,476)
Public high schools in Shelbyville:
Private high school in Shelbyville: APOSTOLIC CHRISTIAN SCHOOL Students: 25, Location: 1500 MILLER AVE, Grades: KG-12)
Public elementary/middle schools in Shelbyville: SHELBYVILLE MIDDLE SCHOOL Students: 916, Location: 1200 W MCKAY RD, Grades: 6-8)THOMAS A HENDRICKS ELEM SCH Students: 668, Location: 1111 ST JOSEPH ST, Grades: PK-5)WILLIAM F LOPER ELEM SCH Students: 650, Location: 901 LOPER DR, Grades: PK-5)COULSTON ELEMENTARY SCHOOL Students: 527, Location: 121 KNIGHTSTOWN RD, Grades: PK-5)SOUTHWESTERN ELEMENTARY SCH Students: 424, Location: 3406 W 600 S, Grades: KG-6)Private elementary/middle school in Shelbyville: ST JOSEPH SCHOOL Students: 144, Location: 127 E BROADWAY ST, Grades: PK-5)
See full list of schools located in Shelbyville Library in Shelbyville: SHELBYVILLE-SHELBY COUNTY PUBLIC LIBRARY Operating income: $475,208; Location: 57 WEST BROADWAY; 132,156 books ; 3,540 audio materials ; 6,662 video materials ; 37 state licensed databases ; 3 other licensed databases ; 132 print serial subscriptions ; 4 electronic serial subscriptions )
Notable locations in Shelbyville: (A) , Shelby County Courthouse (B) , Shelbyville Fire Department Station 3 (C) , Shelbyville Fire Department Station 2 (D) . Display/hide their locations on the map
Cemeteries: (1) , Saint Josephs Cemetery (2) . Display/hide their locations on the map
Reservoir: (A) . Display/hide its location on the map
River: (A) . Display/hide its location on the map
Parks in Shelbyville include: (1) , Morrison Park (2) , Sunset Park (3) . Display/hide their locations on the map
Tourist attractions: (1) , Grover Museum (Cultural Attractions- Events- & Facilities; 52 West Broadway Street) (2) . Display/hide their approximate locations on the map
Hotels: (1) , Days Inn Shelbyville IN (1810 North Riley Highway) (2) , China Inn (2505 East State Road 44) (3) , Best Western Shelbyville (68 East Rampart Street) (4) , Rasner Enterprises (1835 East Michigan Road) (5) , Comfort Inn (36 Rampart Street) (6) , Holiday Inn Express (68 East Rampart Street) (7) , Hampton Inn Shelbyville (59 East Rampart) (8) , Super 8 (20 West Rampart Street) (9) . Display/hide their approximate locations on the map
Courts: (1) , Shelby County - Probation Office Court House (Court House) (2) , Shelby County - Courts- Circuit Court Court House (Court House) (3) . Display/hide their approximate locations on the map
Birthplace of: Jerry Akers - Baseball player, Mike Phipps - College football player, Bob Whitlow - Football player.
Shelby County has a predicted average indoor radon screening level greater than 4 pCi/L (pico curies per liter) - Highest Potential Drinking water stations with addresses in Shelbyville and their reported violations in the past:
SHELBYVILLE COMMUNITY CHURCH (Population served: 705, Groundwater):
Past monitoring violations:
7 routine major monitoring violations
Population served: 75, Groundwater):
Past health violations:
MCL, Monthly (TCR) - In FEB-2012, Contaminant: Coliform. Follow-up actions: St Violation/Reminder Notice (MAR-29-2012), St Public Notif requested (MAR-29-2012), St Boil Water Order (MAR-29-2012), St Compliance achieved (AUG-28-2012)
MCL, Monthly (TCR) - In AUG-2008, Contaminant: Coliform. Follow-up actions: St Public Notif requested (SEP-16-2008), St Violation/Reminder Notice (SEP-16-2008), St Compliance achieved (MAY-11-2010)
MCL, Monthly (TCR) - In SEP-2005, Contaminant: Coliform. Follow-up actions: St Violation/Reminder Notice (OCT-03-2005), St Boil Water Order (OCT-03-2005), St Public Notif requested (OCT-03-2005), St Compliance achieved (MAY-11-2010)
Past monitoring violations:
Monitoring, Repeat Major (TCR) - In AUG-2008, Contaminant: Coliform (TCR). Follow-up actions: St Public Notif requested (SEP-16-2008), St Violation/Reminder Notice (SEP-16-2008), St Compliance achieved (MAY-11-2010)
3 routine major monitoring violations
Population served: 75, Groundwater):
Past health violations:
MCL, Monthly (TCR) - In NOV-2006, Contaminant: Coliform. Follow-up actions: St Public Notif requested (DEC-06-2006), St Violation/Reminder Notice (DEC-06-2006), St Public Notif received (DEC-15-2006), St Boil Water Order (DEC-15-2006), St Compliance achieved (MAY-17-2010)
Past monitoring violations:
Monitoring, Repeat Major (TCR) - In NOV-2006, Contaminant: Coliform (TCR). Follow-up actions: St Public Notif requested (DEC-06-2006), St Violation/Reminder Notice (DEC-06-2006), St Boil Water Order (DEC-15-2006), St Public Notif received (JUL-06-2007), St Compliance achieved (MAY-17-2010)
One minor monitoring violation
Drinking water stations with addresses in Shelbyville that have no violations reported:
PLATTS LAKEVIEW CAMPGROUND (Population served: 100, Primary Water Source Type: Groundwater)
Average household size: This city:
2.4 peopleIndiana:
2.5 people
Percentage of family households: This city:
63.1%Whole state:
66.9%
Percentage of households with unmarried partners: This city:
9.1%Whole state:
6.9%
Likely homosexual households (counted as self-reported same-sex unmarried-partner households)
Lesbian couples: 0.5% of all households Gay men: 0.2% of all households
People in group quarters in Shelbyville in 2010:
275 people in nursing facilities/skilled-nursing facilities
214 people in local jails and other municipal confinement facilities
8 people in group homes for juveniles (non-correctional)
8 people in residential treatment centers for adults
2 people in other noninstitutional facilities
People in group quarters in Shelbyville in 2000:
178 people in nursing homes
151 people in other nonhousehold living situations
146 people in local jails and other confinement facilities (including police lockups)
12 people in other noninstitutional group quarters
11 people in homes for the mentally retarded
8 people in homes for the mentally ill
Banks with most branches in Shelbyville (2011 data):
JPMorgan Chase Bank, National Association: Shelbyville Main Branch at 49 Public Square, branch established on 1855/01/01; Noble Jackson Branch at 25 South Noble Street, branch established on 1981/11/05. Info updated 2011/11/10: Bank assets: $1,811,678.0 mil, Deposits: $1,190,738.0 mil, headquarters in Columbus, OH, positive income , International Specialization, 5577 total offices , Holding Company: Jpmorgan Chase & Co.
PNC Bank, National Association: Shelbyville Eastside at 1832 East Sr 44, branch established on 1964/08/10; Shellbyville Branch at 102 South Harrison Street, branch established on 1892/01/01. Info updated 2012/03/20: Bank assets: $263,309.6 mil, Deposits: $197,343.0 mil, headquarters in Wilmington, DE, positive income , Commercial Lending Specialization, 3085 total offices , Holding Company: Pnc Financial Services Group, Inc., The
First Merchants Bank National Association: Scb Bank Branch at 29 E Washington Street, branch established on 1891/01/01; Shelbyville Branch at 34 Rampart Street, branch established on 1995/05/06. Info updated 2012/02/13: Bank assets: $4,154.9 mil, Deposits: $3,154.7 mil, headquarters in Muncie, IN, positive income , Commercial Lending Specialization, 89 total offices , Holding Company: First Merchants Corporation
First Financial Bank, National Association: Shelbyville Branch at 1850 Marketplace Boulevard, branch established on 1993/03/01. Info updated 2009/09/21: Bank assets: $6,663.4 mil, Deposits: $5,754.9 mil, headquarters in Hamilton, OH, positive income , Commercial Lending Specialization, 101 total offices , Holding Company: First Financial Bancorp
KeyBank National Association: Junction Center Branch at 1620 East State Road 44, branch established on 1976/11/01. Info updated 2008/03/03: Bank assets: $86,198.8 mil, Deposits: $64,214.8 mil, headquarters in Cleveland, OH, positive income , Commercial Lending Specialization, 1067 total offices , Holding Company: Keycorp
First Bank Richmond, National Association: Shelbyville Branch at 1601 East Michigan Street, branch established on 1999/03/24. Info updated 2006/11/03: Bank assets: $521.4 mil, Deposits: $375.1 mil, headquarters in Richmond, IN, negative income in the last year , Commercial Lending Specialization, 9 total offices , Holding Company: First Mutual Of Richmond, Inc.
Fifth Third Bank: Shelbyville Branch at 110 North Harrison Street, branch established on 1996/09/23. Info updated 2009/10/05: Bank assets: $114,540.4 mil, Deposits: $89,689.1 mil, headquarters in Cincinnati, OH, positive income , Commercial Lending Specialization, 1378 total offices , Holding Company: Fifth Third Bancorp
First Federal Savings and Loan Association of Greensburg: Shelbyville Branch at 25 Public Square, branch established on 2010/05/01. Info updated 2011/07/21: Bank assets: $143.6 mil, Deposits: $130.5 mil, headquarters in Greensburg, IN, positive income , Consumer Lending Specialization, 3 total offices
MainSource Bank: Shelbyville Branch at 2507 Progress Parkway, branch established on 2008/09/08. Info updated 2009/12/09: Bank assets: $2,729.1 mil, Deposits: $2,167.0 mil, headquarters in Greensburg, IN, positive income , 86 total offices , Holding Company: Mainsource Financial Group, Inc.
For population 15 years and over in Shelbyville:
Never married: 24.5%Now married: 51.1%Separated: 2.1%Widowed: 6.2%Divorced: 16.0% For population 25 years and over in Shelbyville:
High school or higher: 87.2%Bachelor's degree or higher: 17.5%Graduate or professional degree: 6.0%Unemployed: 4.5%Mean travel time to work (commute): 19.4 minutes
Education Gini index (Inequality in education) Here:
11.0Indiana average:
11.3
Religion statistics for Shelbyville, IN (based on Shelby County data)
Religion Adherents Congregations Mainline Protestant 7,006 31 Evangelical Protestant 4,717 31 Catholic 3,600 2 Other 408 2 None 28,705 -
Source: Clifford Grammich, Kirk Hadaway, Richard Houseal, Dale E.Jones, Alexei Krindatch, Richie Stanley and Richard H.Taylor. 2012. 2010 U.S.Religion Census: Religious Congregations & Membership Study. Association of Statisticians of American Religious Bodies. Jones, Dale E., et al. 2002. Congregations and Membership in the United States 2000. Nashville, TN: Glenmary Research Center. Graphs represent county-level data
Food Environment Statistics: Number of grocery stores : 10Shelby County :
2.28 / 10,000 pop.State :
1.73 / 10,000 pop.
Number of convenience stores (no gas) : 1This county :
0.23 / 10,000 pop.Indiana :
0.50 / 10,000 pop.
Number of convenience stores (with gas) : 12This county :
2.73 / 10,000 pop.Indiana :
3.57 / 10,000 pop.
Number of full-service restaurants : 25Shelby County :
5.69 / 10,000 pop.Indiana :
6.78 / 10,000 pop.
Adult obesity rate : This county :
29.9%Indiana :
29.0%
Low-income preschool obesity rate : Health and Nutrition:
Average overall health of teeth and gums : Shelbyville:
44.1%Indiana:
46.2%
Average BMI : Shelbyville:
28.5Indiana:
28.7
People feeling badly about themselves : This city:
21.2%State:
21.3%
People not drinking alcohol at all : This city:
10.6%Indiana:
10.6%
Average hours sleeping at night : Overweight people : Shelbyville:
31.8%Indiana:
33.9%
General health condition : Shelbyville:
55.5%State:
56.1%
Average condition of hearing : This city:
78.2%Indiana:
78.7%
More about Health and Nutrition of Shelbyville, IN Residents
Local government employment and payroll (March 2022)
Function
Full-time employees
Monthly full-time payroll
Average yearly full-time wage
Part-time employees
Monthly part-time payroll
Hospitals
786 $4,534,980 $69,236 133 $290,629 Firefighters
61 $375,441 $73,857 0 $0 Police Protection - Officers
45 $265,149 $70,706 0 $0 Streets and Highways
26 $88,442 $40,819 2 $3,583 Sewerage
19 $86,143 $54,406 1 $806 Solid Waste Management
16 $63,216 $47,412 0 $0 Parks and Recreation
14 $52,090 $44,649 4 $3,892 Police - Other
5 $20,797 $49,913 0 $0 Fire - Other
5 $25,975 $62,340 0 $0 Financial Administration
5 $24,153 $57,967 0 $0 Other Government Administration
4 $18,332 $54,996 1 $183 Water Supply
4 $14,956 $44,868 0 $0 Judicial and Legal
1 $8,407 $100,884 0 $0 Airports
0 $0 3 $2,942
Totals for Government
991 $5,578,081 $67,545 144 $302,035
Shelbyville government finances - Expenditure in 2021 (per resident):
Construction - Hospitals: $13,700,000 ($679.60)
Air Transportation: $647,000 ($32.09)Current Operations - Hospitals: $449,629,000 ($22304.13)
Local Fire Protection: $6,043,000 ($299.77)Sewerage: $5,356,000 ($265.69)Police Protection: $4,307,000 ($213.65)Parks and Recreation: $2,110,000 ($104.67)Regular Highways: $1,054,000 ($52.28)Solid Waste Management: $819,000 ($40.63)General - Other: $731,000 ($36.26)Central Staff Services: $396,000 ($19.64)Air Transportation: $278,000 ($13.79)Financial Administration: $238,000 ($11.81)General - Interest on Debt: $5,681,000 ($281.81)
Intergovernmental to State - Hospitals: $5,406,000 ($268.17)
Total Salaries and Wages: $65,717,000 ($3259.93)
Shelbyville government finances - Revenue in 2021 (per resident):
Charges - Hospital Public: $494,795,000 ($24544.62)
Sewerage: $4,654,000 ($230.86)Parks and Recreation: $542,000 ($26.89)Air Transportation: $299,000 ($14.83)Federal Intergovernmental - Other: $28,000 ($1.39)
Miscellaneous - Interest Earnings: $17,528,000 ($869.49)
General Revenue - Other: $644,000 ($31.95)Rents: $213,000 ($10.57)State Intergovernmental - Other: $9,015,000 ($447.19)
Highways: $990,000 ($49.11)General Local Government Support: $100,000 ($4.96)Tax - Property: $10,706,000 ($531.08)
Shelbyville government finances - Debt in 2021 (per resident):
Long Term Debt - Beginning Outstanding - Unspecified Public Purpose: $142,033,000 ($7045.64)
Outstanding Unspecified Public Purpose: $139,478,000 ($6918.89)Retired Unspecified Public Purpose: $2,555,000 ($126.74)
Shelbyville government finances - Cash and Securities in 2021 (per resident):
Other Funds - Cash and Securities: $288,382,000 ($14305.37)
Businesses in Shelbyville, IN
Name Count Name Count
ALDI 1 Lane Furniture 1 AT&T 1 Little Caesars Pizza 1 Ace Hardware 1 MasterBrand Cabinets 4 Advance Auto Parts 1 Maurices 1 Applebee's 1 McDonald's 4 Arby's 1 Nike 1 AutoZone 1 Papa John's Pizza 1 Burger King 1 Penske 1 CVS 1 Pizza Hut 1 Chevrolet 1 Quality 1 Circle K 1 RadioShack 1 Comfort Inn 1 SAS Shoes 1 Cracker Barrel 1 Sears 1 Dairy Queen 1 Starbucks 1 Dennys 1 Subway 2 Domino's Pizza 1 Super 8 1 FedEx 2 T-Mobile 2 Ford 1 Taco Bell 1 GameStop 1 True Value 1 H&R Block 1 U-Haul 2 Hilton 1 UPS 4 Holiday Inn 1 Vans 1 KFC 1 Waffle House 1 Kincaid 1 Walgreens 1 Knights Inn 2 Walmart 1 Kroger 1 Wendy's 2 La-Z-Boy 1 White Castle 1
Strongest AM radio stations in Shelbyville:
WKWH (1520 AM; 1 kW; SHELBYVILLE, IN; Owner: RSE BROADCASTING, LLC)
WIBC (1070 AM; 50 kW; INDIANAPOLIS, IN; Owner: EMMIS RADIO LICENSE CORPORATION)
WLW (700 AM; 50 kW; CINCINNATI, OH; Owner: JACOR BROADCASTING CORPORATION)
WHAS (840 AM; 50 kW; LOUISVILLE, KY; Owner: CLEAR CHANNEL BROADCASTING LICENSES, INC.)
WSAI (1530 AM; 50 kW; CINCINNATI, OH; Owner: JACOR BROADCASTING CORPORATION)
WNTS (1590 AM; 5 kW; BEECH GROVE, IN; Owner: S + M BROADCASTING CO., INC.)
WTLC (1310 AM; 5 kW; INDIANAPOLIS, IN; Owner: RADIO ONE OF INDIANA, LLC)
WNDE (1260 AM; 5 kW; INDIANAPOLIS, IN; Owner: CAPSTAR TX LIMITED PARTNERSHIP)
WXLW (950 AM; 5 kW; INDIANAPOLIS, IN)
WBRI (1500 AM; daytime; 5 kW; INDIANAPOLIS, IN)
WOWO (1190 AM; 50 kW; FORT WAYNE, IN; Owner: PATHFINDER COMMUNICATIONS CORPORATION)
WXNT (1430 AM; 5 kW; INDIANAPOLIS, IN; Owner: MYSTAR COMMUNICATIONS CORPORATION)
WTVN (610 AM; 50 kW; COLUMBUS, OH; Owner: CITICASTERS LICENSES, L.P.)
Strongest FM radio stations in Shelbyville:
WENS (97.1 FM; SHELBYVILLE, IN; Owner: EMMIS RADIO LICENSE CORPORATION)
WTTS (92.3 FM; BLOOMINGTON, IN; Owner: SARKES TARZIAN, INC.)
WNOU (93.1 FM; INDIANAPOLIS, IN; Owner: EMMIS RADIO LICENSE CORPORATION)
WZPL (99.5 FM; GREENFIELD, IN; Owner: MYSTAR COMMUNICATIONS CORPORATION)
WFMS (95.5 FM; INDIANAPOLIS, IN; Owner: WFMS LICO, INC)
WYXB (105.7 FM; INDIANAPOLIS, IN; Owner: EMMIS RADIO LICENSE CORPORATION)
WJLR (91.5 FM; SEYMOUR, IN; Owner: MIDWEST MINISTRIES, INC.)
WIJY (95.9 FM; FRANKLIN, IN; Owner: PILGRIM COMMUNICATIONS, LLC)
WKWH-FM (94.3 FM; RUSHVILLE, IN; Owner: RSE BROADCASTING, LLC)
WHHH (96.3 FM; INDIANAPOLIS, IN; Owner: RADIO ONE OF INDIANA, LLC)
WRZQ-FM (107.3 FM; GREENSBURG, IN; Owner: WTRE, INC.)
WFBQ (94.7 FM; INDIANAPOLIS, IN; Owner: CAPSTAR TX LIMITED PARTNERSHIP)
WAUZ (89.1 FM; GREENSBURG, IN; Owner: GOOD SHEPHERD RADIO INC)
WRZX (103.3 FM; INDIANAPOLIS, IN; Owner: CAPSTAR TX LIMITED PARTNERSHIP)
WGLD (104.5 FM; INDIANAPOLIS, IN; Owner: INDY LICO, INC)
WTPI (107.9 FM; INDIANAPOLIS, IN; Owner: MYSTAR COMMUNICATIONS CORPORATION)
WKKG (101.5 FM; COLUMBUS, IN; Owner: WHITE RIVER BROADCASTING CO. INC.)
WTLC-FM (106.7 FM; GREENWOOD, IN; Owner: RADIO ONE OF INDIANA, LLC)
WYGB (102.9 FM; EDINBURGH, IN; Owner: EDINBURGH RADIO)
WRFT (91.5 FM; INDIANAPOLIS, IN; Owner: FRANKLIN TWSP. COMM. SCH. CORP.)
TV broadcast stations around Shelbyville:
WTTV (Channel 4; BLOOMINGTON, IN; Owner: TRIBUNE BROADCAST HOLDINGS, INC.)
WIPX (Channel 63; BLOOMINGTON, IN; Owner: PAXSON INDIANAPOLIS LICENSE, INC.)
WCLJ (Channel 42; BLOOMINGTON, IN; Owner: TRINITY BROADCASTING OF INDIANA, INC.)
WKOG-LP (Channel 31; INDIANAPOLIS, IN; Owner: KINGDOM OF GOD MINISTRIES, INC.)
WDNI-LP (Channel 65; INDIANAPOLIS, IN; Owner: RADIO ONE OF INDIANA, LLC)
WIPX-LP (Channel 51; INDIANAPOLIS, IN; Owner: PAXSON COMMUNICATIONS LICENSE COMPANY, LLC)
WXIN (Channel 59; INDIANAPOLIS, IN; Owner: TRIBUNE TELEVISION COMPANY)
WISH-TV (Channel 8; INDIANAPOLIS, IN; Owner: INDIANA BROADCASTING, LLC)
WHMB-TV (Channel 40; INDIANAPOLIS, IN; Owner: LESEA BROADCASTING CORPORATION)
WRTV (Channel 6; INDIANAPOLIS, IN; Owner: MCGRAW-HILL BROADCASTING COMPANY, INC.)
WTIU (Channel 30; BLOOMINGTON, IN; Owner: THE TRUSTEES OF INDIANA UNIVERSITY)
WTHR (Channel 13; INDIANAPOLIS, IN; Owner: VIDEOINDIANA, INC.)
WBXI-CA (Channel 47; INDIANAPOLIS, IN; Owner: THE BOX WORLDWIDE LLC)
WFYI (Channel 20; INDIANAPOLIS, IN; Owner: METROPOLITAN INDIANAPOLIS PUBLIC BROADCASTING, INC.)
WALV-CA (Channel 50; INDIANAPOLIS, IN; Owner: VIDEOHIO, INC..)
WTBU-TV (Channel 69; INDIANAPOLIS, IN; Owner: BUTLER UNIVERSITY)
National Bridge Inventory (NBI) Statistics 99 Number of bridges1,001ft / 305m Total length $5,635,000 Total costs512,163 Total average daily traffic80,568 Total average daily truck traffic
New bridges - historical statistics
3 1910-1919 2 1920-1929 3 1930-1939 2 1940-1949 40 1950-1959 6 1960-1969 12 1970-1979 6 1980-1989 13 1990-1999 6 2000-2009 6 2010-2019
See full National Bridge Inventory statistics for Shelbyville, IN
Home Mortgage Disclosure Act Aggregated Statistics For Year 2009(Based on 1 full and 6 partial tracts) A) FHA, FSA/RHS & VA B) Conventional C) Refinancings D) Home Improvement Loans E) Loans on Dwellings For 5+ Families F) Non-occupant Loans on G) Loans On Manufactured Number Average Value Number Average Value Number Average Value Number Average Value Number Average Value Number Average Value Number Average Value
LOANS ORIGINATED 69 $86,303 31 $88,292 210 $102,585 9 $47,086 2 $2,434,445 14 $76,844 4 $139,058 APPLICATIONS APPROVED, NOT ACCEPTED 5 $93,786 4 $67,405 28 $108,779 0 $0 0 $0 2 $56,760 1 $22,440 APPLICATIONS DENIED 14 $62,704 13 $67,572 110 $105,226 8 $43,462 0 $0 18 $53,863 6 $26,458 APPLICATIONS WITHDRAWN 11 $84,365 5 $83,648 57 $105,906 2 $169,085 0 $0 2 $49,175 1 $114,200 FILES CLOSED FOR INCOMPLETENESS 2 $60,735 0 $0 10 $87,895 1 $114,060 0 $0 4 $71,775 0 $0
Aggregated Statistics For Year 2008(Based on 1 full and 6 partial tracts) A) FHA, FSA/RHS & VA B) Conventional C) Refinancings D) Home Improvement Loans E) Loans on Dwellings For 5+ Families F) Non-occupant Loans on G) Loans On Manufactured Number Average Value Number Average Value Number Average Value Number Average Value Number Average Value Number Average Value Number Average Value
LOANS ORIGINATED 96 $92,711 59 $98,482 121 $110,530 19 $29,801 2 $431,415 20 $136,270 3 $106,543 APPLICATIONS APPROVED, NOT ACCEPTED 5 $111,190 5 $107,544 21 $104,877 8 $41,460 0 $0 4 $99,368 2 $110,310 APPLICATIONS DENIED 28 $98,100 21 $83,024 118 $104,706 30 $35,196 0 $0 16 $59,281 7 $51,919 APPLICATIONS WITHDRAWN 9 $93,652 11 $111,315 47 $122,619 3 $136,920 0 $0 4 $69,218 1 $124,290 FILES CLOSED FOR INCOMPLETENESS 7 $74,966 1 $88,000 8 $127,298 0 $0 0 $0 0 $0 1 $67,180
Aggregated Statistics For Year 2007(Based on 1 full and 6 partial tracts) A) FHA, FSA/RHS & VA B) Conventional C) Refinancings D) Home Improvement Loans E) Loans on Dwellings For 5+ Families F) Non-occupant Loans on G) Loans On Manufactured Number Average Value Number Average Value Number Average Value Number Average Value Number Average Value Number Average Value Number Average Value
LOANS ORIGINATED 51 $100,561 179 $86,186 164 $95,397 29 $31,399 3 $868,443 45 $67,103 3 $91,707 APPLICATIONS APPROVED, NOT ACCEPTED 4 $105,995 16 $115,128 36 $91,324 4 $31,020 0 $0 4 $51,575 2 $110,990 APPLICATIONS DENIED 9 $110,314 48 $73,167 197 $101,291 56 $30,516 1 $197,590 32 $75,611 4 $60,360 APPLICATIONS WITHDRAWN 4 $111,630 20 $83,262 83 $102,480 5 $55,804 0 $0 8 $73,974 0 $0 FILES CLOSED FOR INCOMPLETENESS 4 $111,290 9 $90,024 21 $108,977 0 $0 0 $0 1 $66,840 0 $0
Aggregated Statistics For Year 2006(Based on 1 full and 6 partial tracts) A) FHA, FSA/RHS & VA B) Conventional C) Refinancings D) Home Improvement Loans E) Loans on Dwellings For 5+ Families F) Non-occupant Loans on G) Loans On Manufactured Number Average Value Number Average Value Number Average Value Number Average Value Number Average Value Number Average Value Number Average Value
LOANS ORIGINATED 46 $103,755 219 $78,624 207 $78,111 25 $36,978 2 $320,675 73 $59,837 2 $80,315 APPLICATIONS APPROVED, NOT ACCEPTED 3 $100,100 21 $74,974 46 $87,602 9 $33,211 2 $114,680 11 $63,082 0 $0 APPLICATIONS DENIED 11 $99,219 60 $69,779 202 $94,343 41 $48,226 0 $0 25 $65,001 4 $43,070 APPLICATIONS WITHDRAWN 3 $111,937 30 $72,717 100 $99,856 9 $55,861 0 $0 10 $55,357 0 $0 FILES CLOSED FOR INCOMPLETENESS 1 $159,400 2 $120,430 25 $121,936 1 $70,160 0 $0 1 $81,120 0 $0
Aggregated Statistics For Year 2005(Based on 1 full and 6 partial tracts) A) FHA, FSA/RHS & VA B) Conventional C) Refinancings D) Home Improvement Loans E) Loans on Dwellings For 5+ Families F) Non-occupant Loans on G) Loans On Manufactured Number Average Value Number Average Value Number Average Value Number Average Value Number Average Value Number Average Value Number Average Value
LOANS ORIGINATED 59 $106,543 222 $84,236 245 $88,230 44 $30,723 2 $86,880 99 $64,384 4 $93,148 APPLICATIONS APPROVED, NOT ACCEPTED 4 $109,888 24 $82,492 50 $80,468 7 $22,460 0 $0 7 $70,760 3 $59,200 APPLICATIONS DENIED 12 $107,731 64 $69,394 240 $87,774 55 $33,654 0 $0 28 $72,959 11 $62,375 APPLICATIONS WITHDRAWN 7 $92,440 29 $65,018 109 $98,598 21 $137,397 0 $0 16 $63,309 2 $31,370 FILES CLOSED FOR INCOMPLETENESS 0 $0 6 $54,013 46 $104,328 1 $13,110 0 $0 1 $56,600 0 $0
Aggregated Statistics For Year 2004(Based on 1 full and 6 partial tracts) A) FHA, FSA/RHS & VA B) Conventional C) Refinancings D) Home Improvement Loans E) Loans on Dwellings For 5+ Families F) Non-occupant Loans on G) Loans On Manufactured Number Average Value Number Average Value Number Average Value Number Average Value Number Average Value Number Average Value Number Average Value
LOANS ORIGINATED 45 $88,235 172 $88,616 305 $86,809 50 $33,789 0 $0 81 $71,180 4 $31,640 APPLICATIONS APPROVED, NOT ACCEPTED 1 $64,940 21 $72,343 56 $94,192 9 $11,658 0 $0 6 $52,210 2 $42,410 APPLICATIONS DENIED 7 $98,619 46 $86,770 204 $86,820 49 $26,466 1 $125,400 22 $47,411 5 $31,704 APPLICATIONS WITHDRAWN 2 $80,515 16 $93,582 122 $95,441 16 $42,601 0 $0 5 $67,088 0 $0 FILES CLOSED FOR INCOMPLETENESS 1 $49,260 9 $96,573 43 $96,633 3 $79,153 0 $0 5 $74,786 0 $0
Aggregated Statistics For Year 2003(Based on 1 full and 6 partial tracts) A) FHA, FSA/RHS & VA B) Conventional C) Refinancings D) Home Improvement Loans E) Loans on Dwellings For 5+ Families F) Non-occupant Loans on Number Average Value Number Average Value Number Average Value Number Average Value Number Average Value Number Average Value
LOANS ORIGINATED 50 $86,220 133 $88,676 641 $83,366 50 $13,604 1 $64,720 102 $60,151 APPLICATIONS APPROVED, NOT ACCEPTED 5 $87,818 23 $86,350 101 $88,153 9 $18,302 0 $0 13 $55,805 APPLICATIONS DENIED 2 $93,035 33 $87,192 217 $81,562 28 $17,688 0 $0 19 $54,063 APPLICATIONS WITHDRAWN 3 $72,107 26 $64,295 134 $89,327 6 $27,918 0 $0 20 $57,986 FILES CLOSED FOR INCOMPLETENESS 1 $124,260 2 $68,095 24 $85,733 4 $17,725 0 $0 1 $60,570
Aggregated Statistics For Year 2002(Based on 1 full and 6 partial tracts) A) FHA, FSA/RHS & VA B) Conventional C) Refinancings D) Home Improvement Loans E) Loans on Dwellings For 5+ Families F) Non-occupant Loans on Number Average Value Number Average Value Number Average Value Number Average Value Number Average Value Number Average Value
LOANS ORIGINATED 98 $85,520 125 $81,442 498 $83,541 54 $22,513 1 $105,250 76 $57,980 APPLICATIONS APPROVED, NOT ACCEPTED 6 $97,267 21 $69,719 95 $78,258 10 $28,375 0 $0 12 $51,036 APPLICATIONS DENIED 10 $80,935 24 $57,593 217 $77,301 53 $11,152 0 $0 21 $53,200 APPLICATIONS WITHDRAWN 5 $85,200 18 $87,321 163 $82,370 10 $22,576 0 $0 10 $67,789 FILES CLOSED FOR INCOMPLETENESS 1 $97,780 5 $70,428 34 $74,547 2 $23,625 0 $0 3 $49,200
Aggregated Statistics For Year 2001(Based on 1 full and 6 partial tracts) A) FHA, FSA/RHS & VA B) Conventional C) Refinancings D) Home Improvement Loans F) Non-occupant Loans on Number Average Value Number Average Value Number Average Value Number Average Value Number Average Value
LOANS ORIGINATED 119 $81,827 124 $83,860 473 $76,977 53 $16,892 68 $59,089 APPLICATIONS APPROVED, NOT ACCEPTED 8 $74,522 7 $57,236 95 $65,709 13 $16,913 4 $52,038 APPLICATIONS DENIED 7 $97,351 63 $54,268 238 $69,912 71 $15,063 20 $53,558 APPLICATIONS WITHDRAWN 4 $83,605 13 $55,905 164 $75,783 14 $20,668 7 $72,717 FILES CLOSED FOR INCOMPLETENESS 4 $79,218 4 $75,612 45 $77,362 2 $10,130 3 $101,647
Aggregated Statistics For Year 2000(Based on 1 full and 6 partial tracts) A) FHA, FSA/RHS & VA B) Conventional C) Refinancings D) Home Improvement Loans E) Loans on Dwellings For 5+ Families F) Non-occupant Loans on Number Average Value Number Average Value Number Average Value Number Average Value Number Average Value Number Average Value
LOANS ORIGINATED 92 $77,163 130 $73,781 222 $54,751 79 $16,028 2 $220,920 64 $50,790 APPLICATIONS APPROVED, NOT ACCEPTED 9 $72,710 27 $55,714 63 $55,248 28 $17,016 0 $0 9 $61,538 APPLICATIONS DENIED 9 $80,984 97 $50,732 161 $57,520 63 $15,510 0 $0 12 $64,327 APPLICATIONS WITHDRAWN 8 $87,082 14 $76,655 61 $56,179 12 $37,079 1 $1,011,770 9 $49,684 FILES CLOSED FOR INCOMPLETENESS 1 $108,530 7 $72,284 21 $73,360 1 $19,860 0 $0 0 $0
Aggregated Statistics For Year 1999(Based on 1 full and 6 partial tracts) A) FHA, FSA/RHS & VA B) Conventional C) Refinancings D) Home Improvement Loans F) Non-occupant Loans on Number Average Value Number Average Value Number Average Value Number Average Value Number Average Value
LOANS ORIGINATED 105 $76,393 129 $75,314 312 $61,666 74 $16,853 92 $45,554 APPLICATIONS APPROVED, NOT ACCEPTED 1 $91,130 17 $80,108 73 $55,134 24 $14,427 4 $17,398 APPLICATIONS DENIED 6 $78,512 44 $52,241 168 $57,198 70 $11,926 10 $43,064 APPLICATIONS WITHDRAWN 6 $68,952 10 $91,057 116 $60,415 18 $33,443 1 $19,840 FILES CLOSED FOR INCOMPLETENESS 1 $42,330 5 $87,814 30 $61,502 2 $19,040 8 $38,772
Detailed HMDA statistics for the following Tracts:
7103.00
, 7104.00 , 7105.00 , 7106.00 , 7107.00
Private Mortgage Insurance Companies Aggregated Statistics For Year 2009(Based on 1 full and 6 partial tracts) A) Conventional B) Refinancings Number Average Value Number Average Value
LOANS ORIGINATED 4 $77,448 9 $115,306 APPLICATIONS APPROVED, NOT ACCEPTED 0 $0 4 $136,468 APPLICATIONS DENIED 2 $77,620 2 $209,090 APPLICATIONS WITHDRAWN 3 $79,617 1 $66,090 FILES CLOSED FOR INCOMPLETENESS 0 $0 1 $130,620
Aggregated Statistics For Year 2008(Based on 1 full and 6 partial tracts) A) Conventional B) Refinancings C) Non-occupant Loans on Number Average Value Number Average Value Number Average Value
LOANS ORIGINATED 31 $98,079 16 $94,521 1 $71,270 APPLICATIONS APPROVED, NOT ACCEPTED 12 $102,020 8 $114,058 1 $71,350 APPLICATIONS DENIED 2 $125,015 5 $65,134 5 $65,506 APPLICATIONS WITHDRAWN 1 $61,570 1 $62,440 0 $0 FILES CLOSED FOR INCOMPLETENESS 0 $0 1 $220,930 0 $0
Aggregated Statistics For Year 2007(Based on 1 full and 6 partial tracts) A) Conventional B) Refinancings C) Non-occupant Loans on Number Average Value Number Average Value Number Average Value
LOANS ORIGINATED 103 $96,285 26 $112,995 9 $93,321 APPLICATIONS APPROVED, NOT ACCEPTED 9 $98,790 7 $85,020 1 $115,320 APPLICATIONS DENIED 1 $139,130 0 $0 0 $0 APPLICATIONS WITHDRAWN 2 $54,280 1 $81,720 0 $0 FILES CLOSED FOR INCOMPLETENESS 0 $0 0 $0 0 $0
Aggregated Statistics For Year 2006(Based on 1 full and 6 partial tracts) A) Conventional B) Refinancings C) Non-occupant Loans on D) Loans On Manufactured Number Average Value Number Average Value Number Average Value Number Average Value
LOANS ORIGINATED 60 $96,302 24 $108,805 5 $47,202 1 $133,200 APPLICATIONS APPROVED, NOT ACCEPTED 10 $113,608 7 $93,557 3 $49,647 0 $0 APPLICATIONS DENIED 1 $129,950 7 $75,480 5 $81,020 0 $0 APPLICATIONS WITHDRAWN 2 $111,940 5 $113,682 3 $79,433 0 $0 FILES CLOSED FOR INCOMPLETENESS 0 $0 0 $0 0 $0 0 $0
Aggregated Statistics For Year 2005(Based on 1 full and 6 partial tracts) A) Conventional B) Refinancings C) Non-occupant Loans on Number Average Value Number Average Value Number Average Value
LOANS ORIGINATED 62 $95,361 23 $113,189 14 $52,746 APPLICATIONS APPROVED, NOT ACCEPTED 5 $179,980 4 $218,052 0 $0 APPLICATIONS DENIED 0 $0 0 $0 0 $0 APPLICATIONS WITHDRAWN 2 $65,415 3 $99,930 0 $0 FILES CLOSED FOR INCOMPLETENESS 0 $0 1 $103,260 0 $0
Aggregated Statistics For Year 2004(Based on 1 full and 6 partial tracts) A) Conventional B) Refinancings C) Non-occupant Loans on Number Average Value Number Average Value Number Average Value
LOANS ORIGINATED 37 $81,634 31 $91,234 10 $57,640 APPLICATIONS APPROVED, NOT ACCEPTED 2 $108,110 13 $99,728 1 $70,200 APPLICATIONS DENIED 1 $67,180 1 $59,690 1 $67,180 APPLICATIONS WITHDRAWN 2 $56,140 3 $104,117 1 $41,700 FILES CLOSED FOR INCOMPLETENESS 0 $0 1 $53,740 0 $0
Aggregated Statistics For Year 2003(Based on 1 full and 6 partial tracts) A) Conventional B) Refinancings C) Non-occupant Loans on Number Average Value Number Average Value Number Average Value
LOANS ORIGINATED 40 $88,572 92 $99,032 11 $66,941 APPLICATIONS APPROVED, NOT ACCEPTED 4 $88,635 20 $98,726 3 $71,157 APPLICATIONS DENIED 2 $144,080 0 $0 0 $0 APPLICATIONS WITHDRAWN 0 $0 5 $83,412 0 $0 FILES CLOSED FOR INCOMPLETENESS 0 $0 1 $61,200 0 $0
Aggregated Statistics For Year 2002(Based on 1 full and 6 partial tracts) A) Conventional B) Refinancings C) Non-occupant Loans on Number Average Value Number Average Value Number Average Value
LOANS ORIGINATED 39 $92,480 83 $96,125 11 $80,567 APPLICATIONS APPROVED, NOT ACCEPTED 5 $80,174 15 $95,995 1 $51,630 APPLICATIONS DENIED 1 $98,790 3 $62,840 0 $0 APPLICATIONS WITHDRAWN 1 $51,800 3 $92,277 2 $61,630 FILES CLOSED FOR INCOMPLETENESS 0 $0 2 $104,060 0 $0
Aggregated Statistics For Year 2001(Based on 1 full and 6 partial tracts) A) Conventional B) Refinancings C) Non-occupant Loans on Number Average Value Number Average Value Number Average Value
LOANS ORIGINATED 40 $95,654 66 $96,060 8 $52,789 APPLICATIONS APPROVED, NOT ACCEPTED 6 $80,338 11 $107,937 3 $35,743 APPLICATIONS DENIED 4 $57,675 7 $90,974 4 $50,725 APPLICATIONS WITHDRAWN 1 $65,680 0 $0 0 $0 FILES CLOSED FOR INCOMPLETENESS 0 $0 0 $0 0 $0
Aggregated Statistics For Year 2000(Based on 1 full and 6 partial tracts) A) Conventional B) Refinancings C) Non-occupant Loans on Number Average Value Number Average Value Number Average Value
LOANS ORIGINATED 38 $87,236 11 $86,510 3 $47,387 APPLICATIONS APPROVED, NOT ACCEPTED 4 $71,975 3 $91,960 1 $39,890 APPLICATIONS DENIED 3 $73,807 2 $130,680 1 $94,790 APPLICATIONS WITHDRAWN 1 $60,790 1 $50,010 0 $0 FILES CLOSED FOR INCOMPLETENESS 0 $0 1 $99,290 0 $0
Aggregated Statistics For Year 1999(Based on 1 full and 6 partial tracts) A) Conventional B) Refinancings C) Non-occupant Loans on Number Average Value Number Average Value Number Average Value
LOANS ORIGINATED 35 $93,691 39 $86,414 11 $52,115 APPLICATIONS APPROVED, NOT ACCEPTED 2 $82,805 6 $100,933 1 $44,550 APPLICATIONS DENIED 2 $82,745 1 $99,890 0 $0 APPLICATIONS WITHDRAWN 1 $50,500 1 $49,510 1 $49,510 FILES CLOSED FOR INCOMPLETENESS 0 $0 0 $0 0 $0
Detailed PMIC statistics for the following Tracts:
7103.00
, 7104.00 , 7105.00 , 7106.00 , 7107.00 Fire-safe hotels and motels in Shelbyville, Indiana:
Americas Best Value Inn, 68 E Rampart St, Shelbyville, Indiana 46176 Phone: (317) 398-0472, Fax: (317) 398-0481
Holiday Inn Express - Shelbyville, 38 W Rampart St, Shelbyville, Indiana 46176 Phone: (317) 398-0800, Fax: (317) 642-5265
Comfort Inn Shelbyville, 36 W Rampart St, Shelbyville, Indiana 46176 Phone: (317) 398-8044, Fax: (317) 398-8442
All 3 fire-safe hotels and motels in Shelbyville, Indiana
Most common first names in Shelbyville, IN among deceased individuals Name Count Lived (average)
Mary 236 78.1 years William 178 72.7 years Robert 160 70.6 years John 159 73.3 years James 141 70.4 years Charles 139 72.1 years George 97 74.8 years Paul 92 73.1 years Helen 84 79.8 years Ruth 81 81.4 years
Most common last names in Shelbyville, IN among deceased individuals Last name Count Lived (average)
Smith 115 74.2 years Brown 75 76.9 years Jones 57 77.0 years Kuhn 54 80.0 years Miller 48 76.6 years Williams 46 74.7 years Johnson 46 72.7 years Scott 42 77.8 years Tucker 36 75.0 years Thurston 34 75.1 years
Shelbyville compared to Indiana state average:
Unemployed percentage significantly below state average. Black race population percentage significantly below state average. Median age below state average. Length of stay since moving in above state average. Shelbyville on our top lists :
#53 on the list of "Top 101 cities with largest percentage of females in industries: manufacturing (population 5,000+)"
#56 on the list of "Top 101 cities with the most full-time firefighters per 1000 residents (population 5,000+)"
#92 on the list of "Top 101 counties with the highest Ozone (1-hour) air pollution readings in 2012 (ppm)"
Top Patent Applicants
Ronald E. Kissell (10)
Robert C. Stolmeier (4)
Clarence H. Helbing (4)
Ronald A. Houpt (4)
Gert Mueller (4)
Jack Wilker, Jr. (3)
John Browder (3)
James Brent Vannatta (2)
Kenji Ota (2)
Yasuo Maeda (2)
Total of 71 patent applications in 2008-2024.
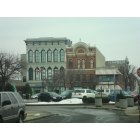

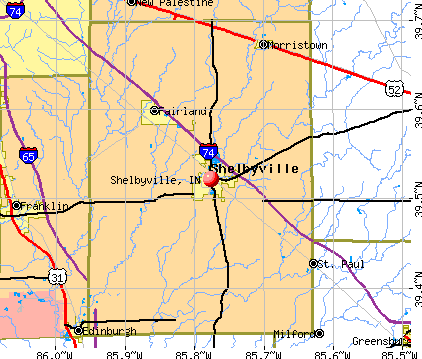


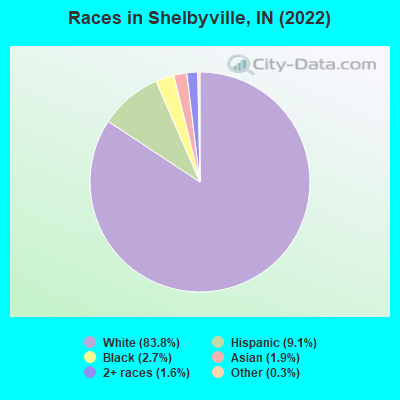
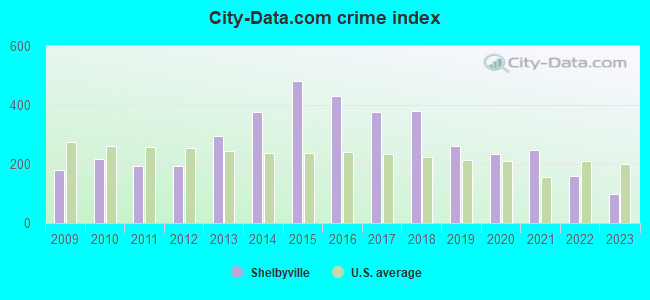
 Recent articles from our blog. Our writers, many of them Ph.D. graduates or candidates, create easy-to-read articles on a wide variety of topics.

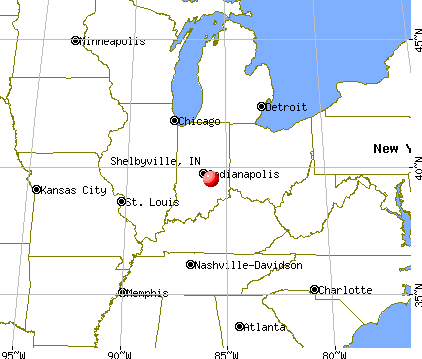
 (27.2 miles
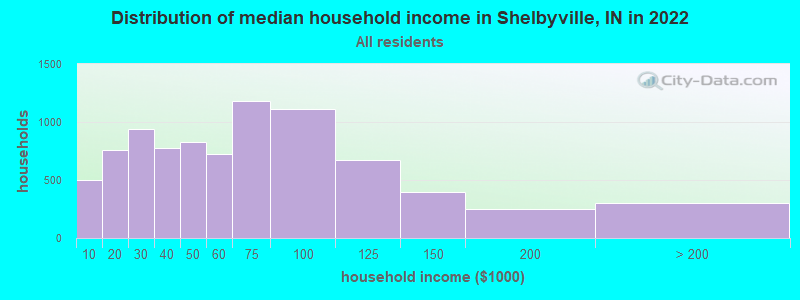
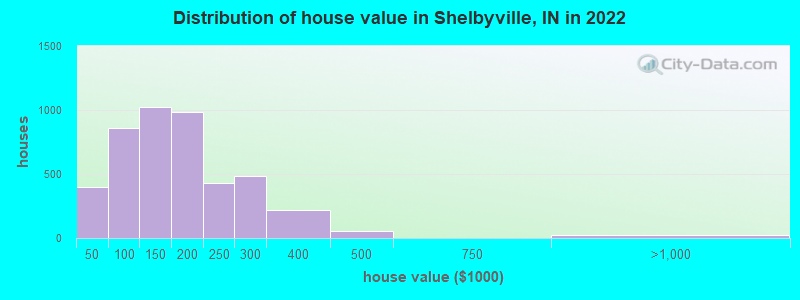

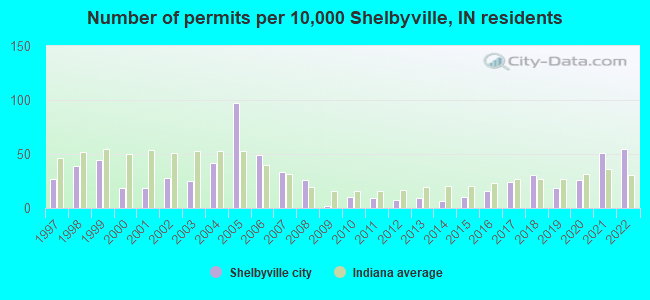
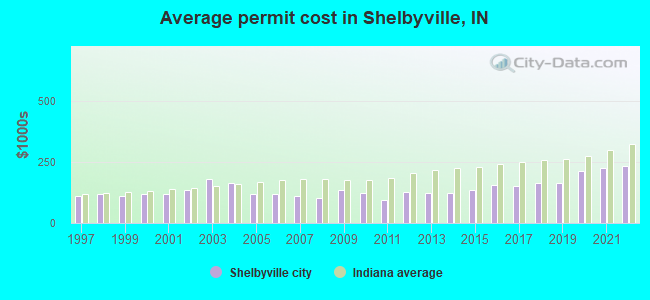
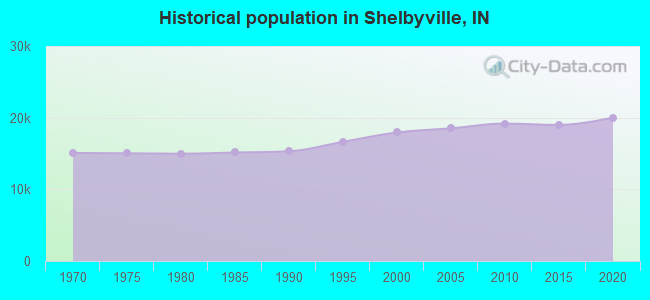
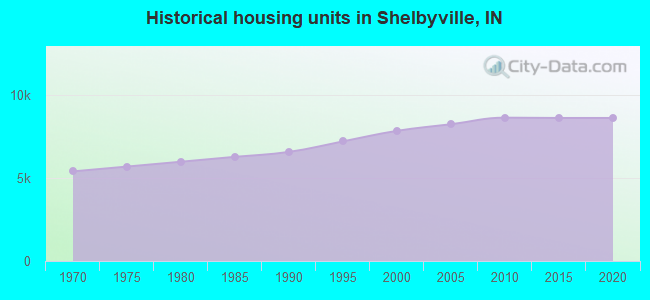
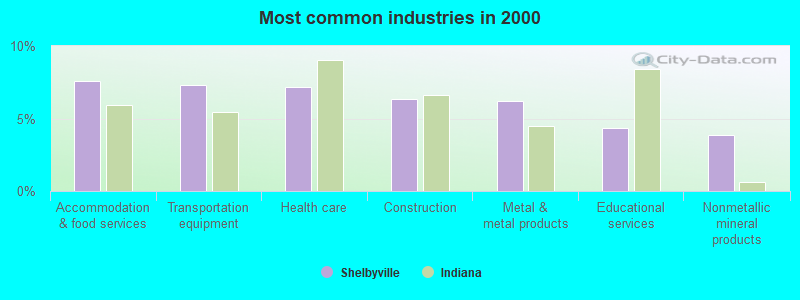
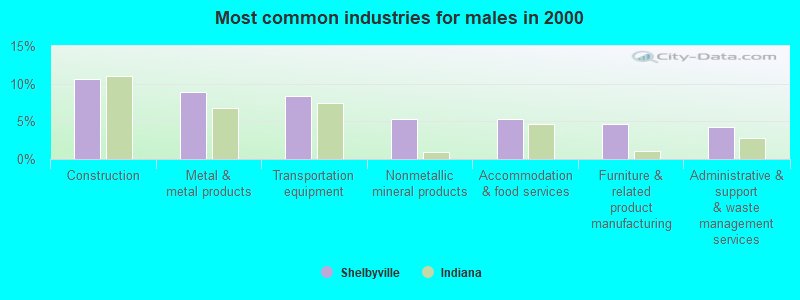
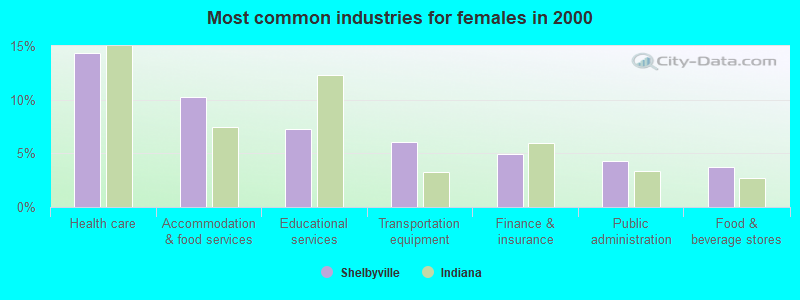
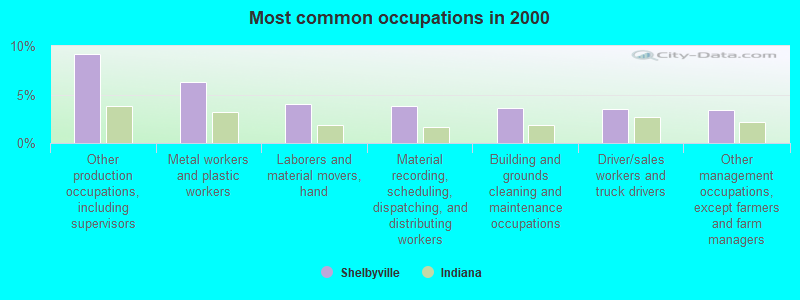
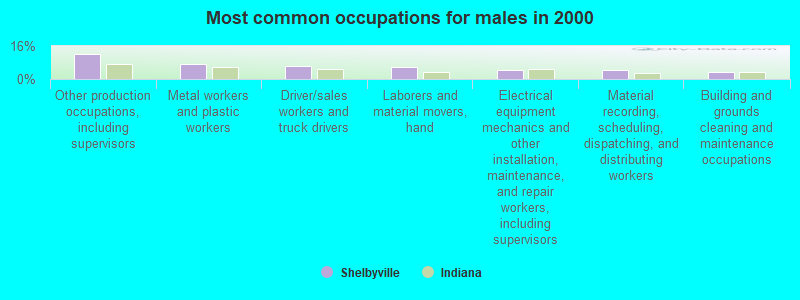
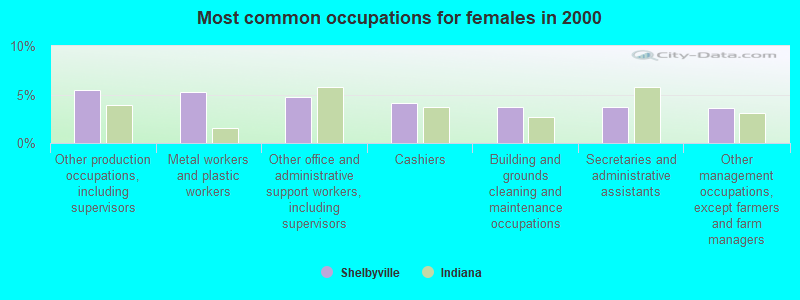
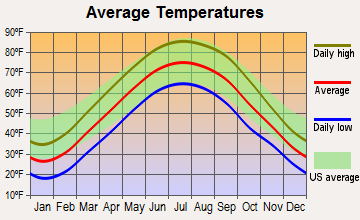
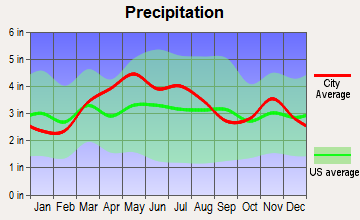
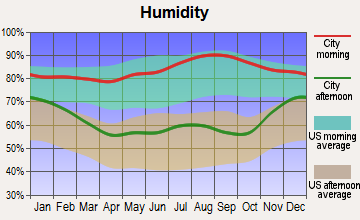
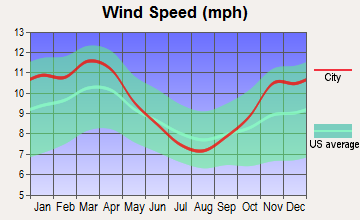
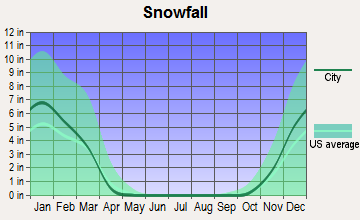
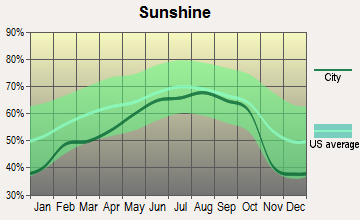
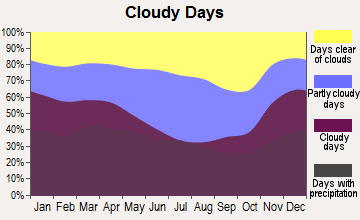
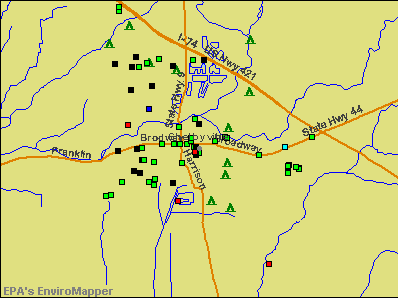

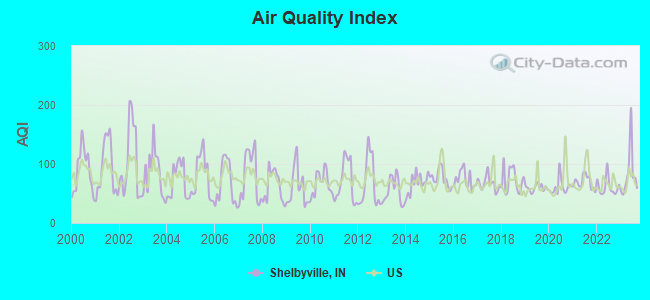
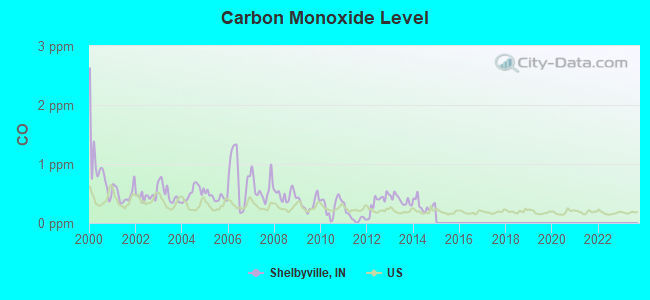
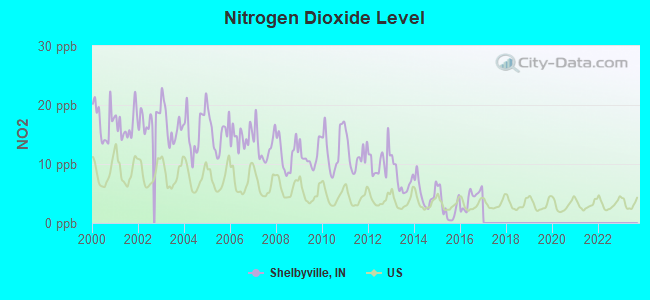
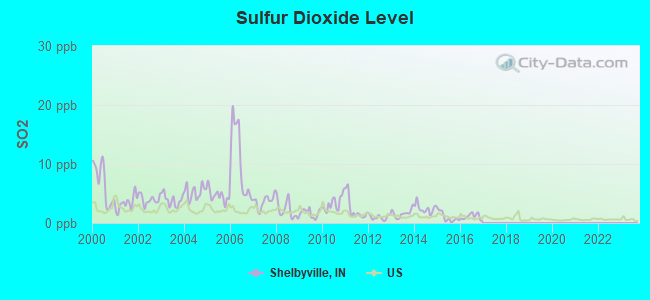
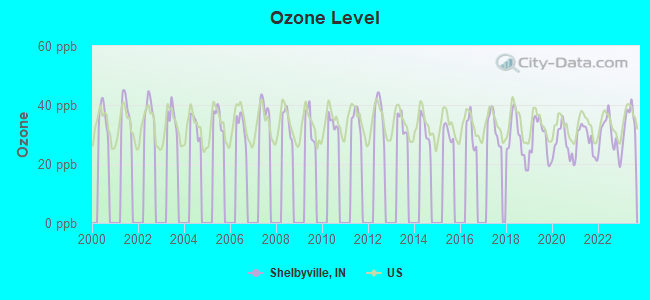
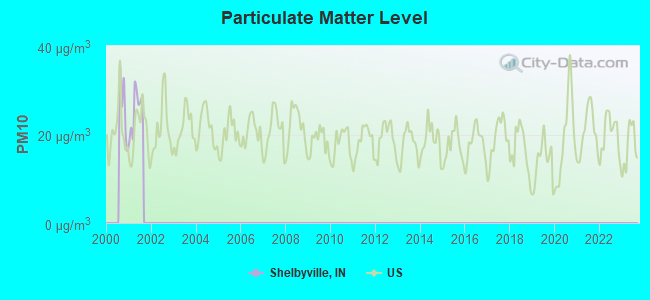
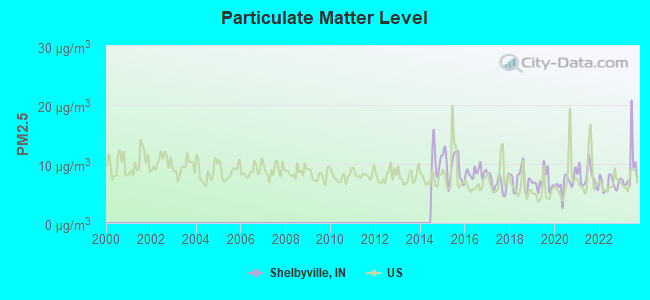
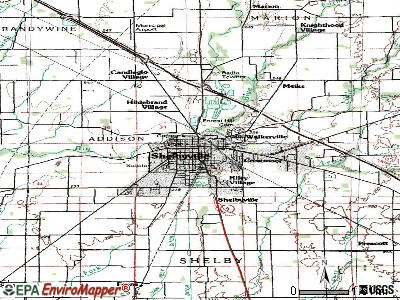
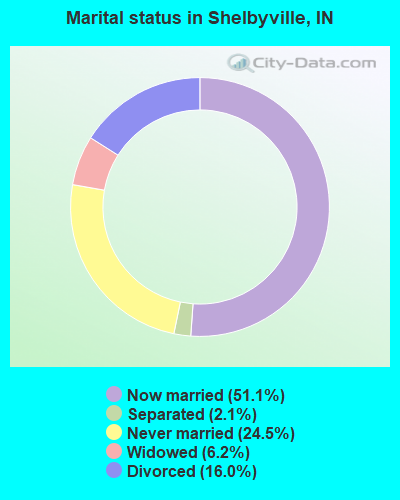
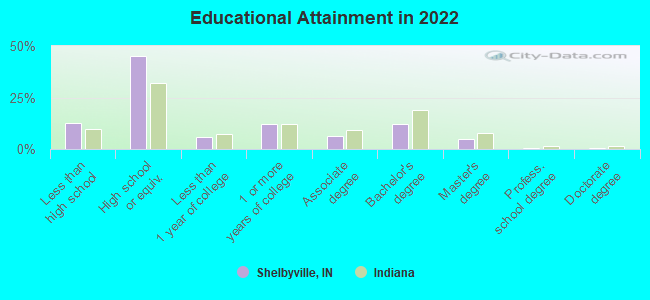
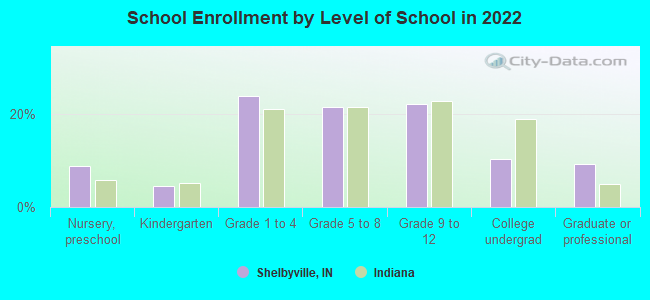
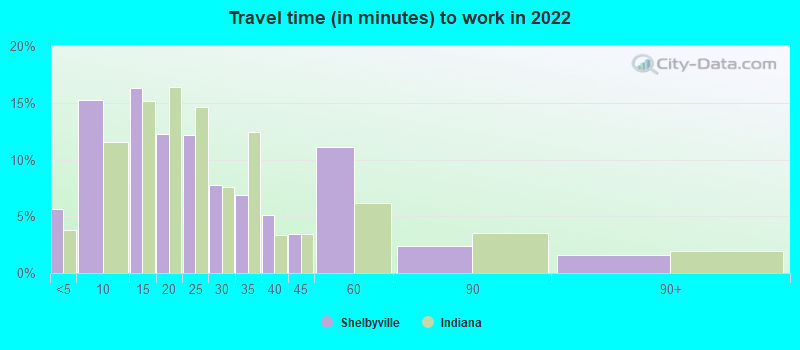
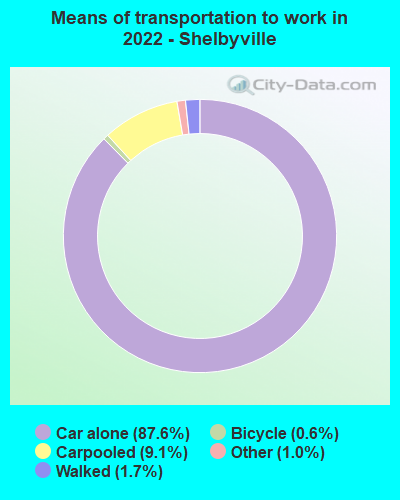
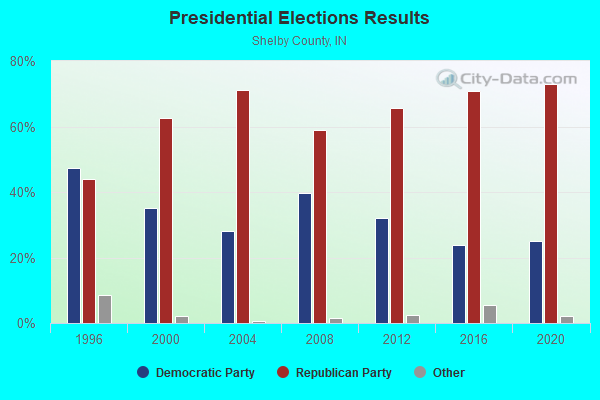
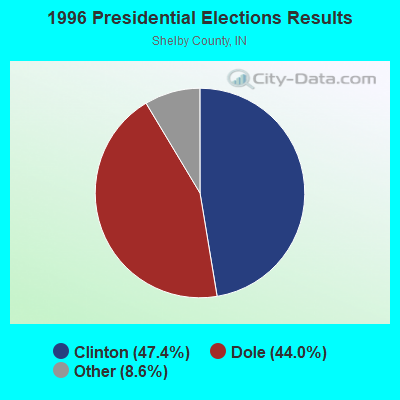
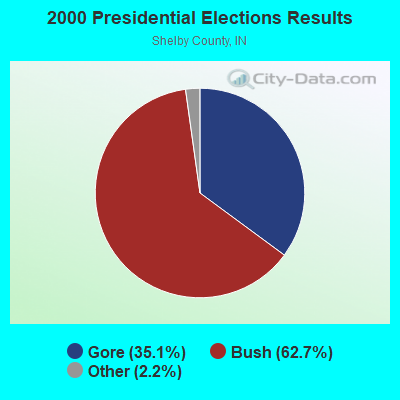
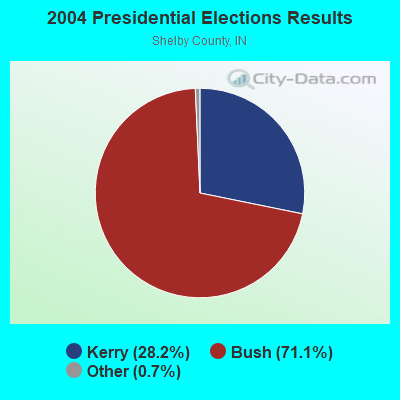
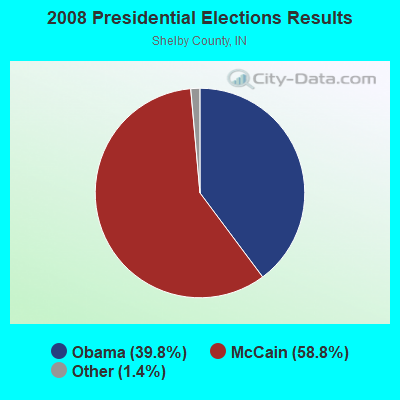

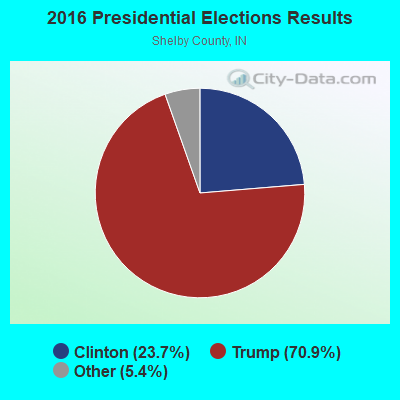
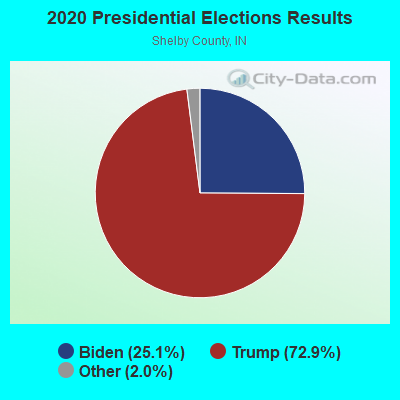
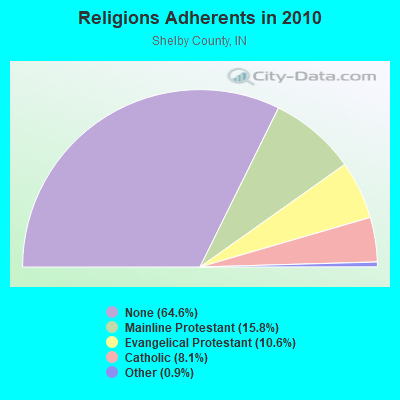
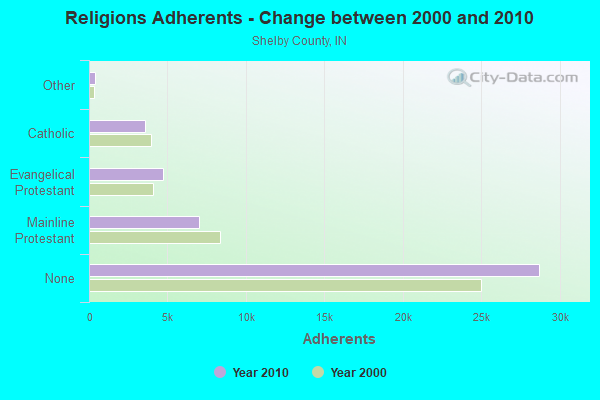
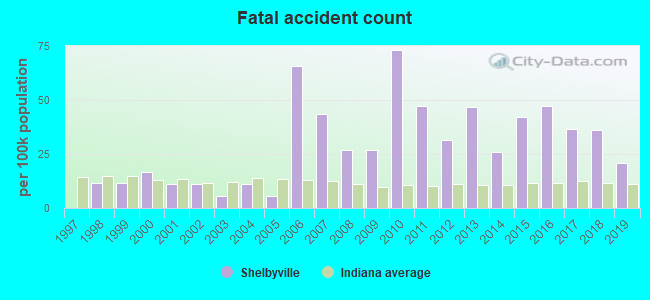
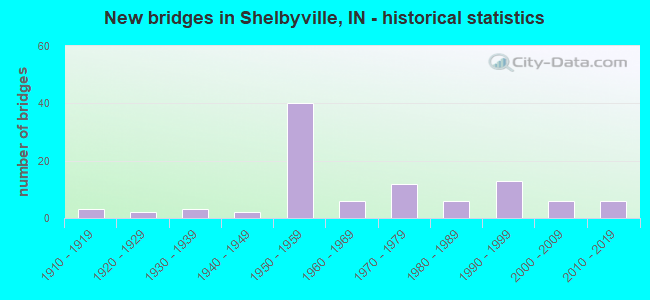
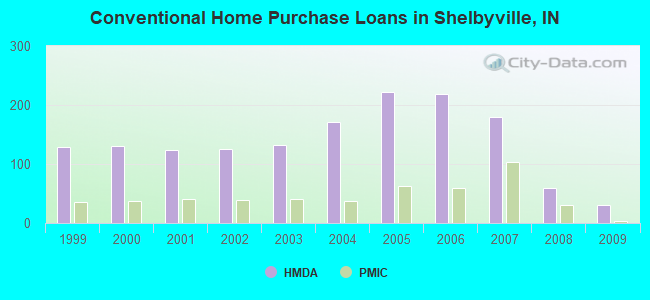
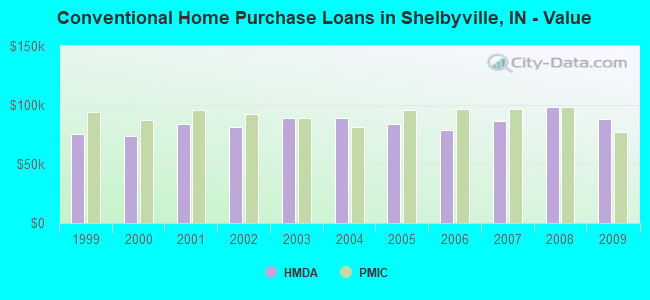
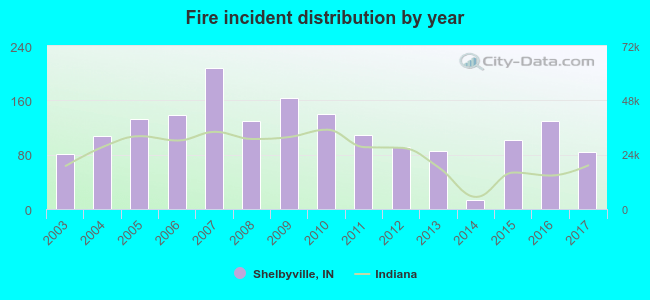 According to the data from the years 2003 - 2017 the average number of fires per year is 114. The highest number of reported fire incidents - 208 took place in 2007, and the least - 13 in 2014. The data has a growing trend.
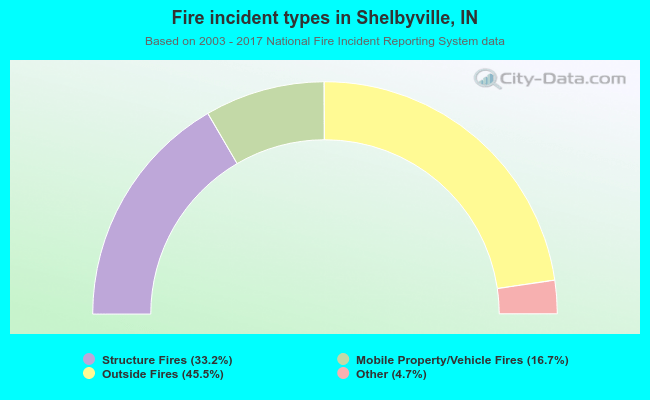 When looking into fire subcategories, the most reports belonged to: Outside Fires (45.5%), and Structure Fires (33.2%).