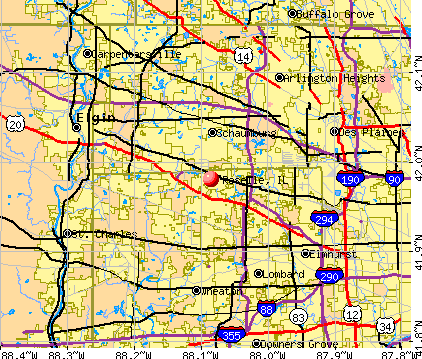
Roselle, Illinois
Submit your own pictures of this village and show them to the world
- OSM Map
- General Map
- Google Map
- MSN Map
Population change since 2000: -2.6%
 |
| Males: 10,803 | |
| Females: 11,702 |
| Median resident age: | 42.5 years |
| Illinois median age: | 39.1 years |
Zip codes: 60172.
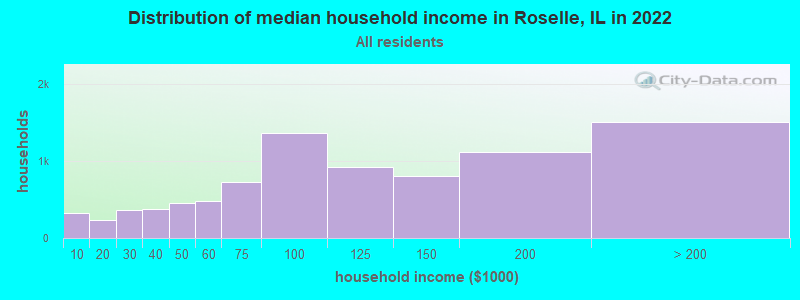
| Roselle: | $99,415 |
| IL: | $76,708 |
Estimated per capita income in 2022: $50,267 (it was $28,501 in 2000)
Roselle village income, earnings, and wages data
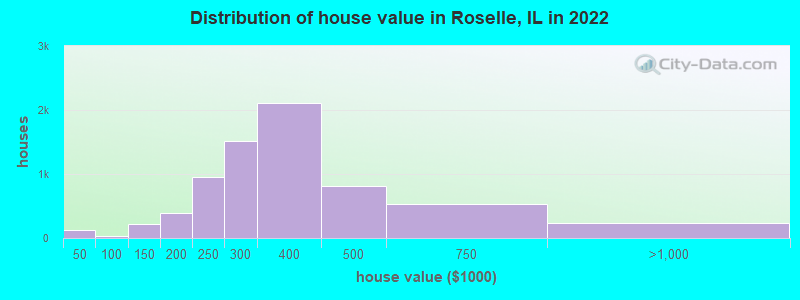
Estimated median house or condo value in 2022: $304,268 (it was $166,700 in 2000)
| Roselle: | $304,268 |
| IL: | $251,600 |
Mean prices in 2022: all housing units: $343,755; detached houses: $381,908; townhouses or other attached units: $251,154; in 3-to-4-unit structures: $214,798; in 5-or-more-unit structures: $199,081
Median gross rent in 2022: $1,411.
(2.8% for White Non-Hispanic residents, 15.0% for Black residents, 5.0% for Hispanic or Latino residents, 15.1% for other race residents)
Detailed information about poverty and poor residents in Roselle, IL


Compare current foreclosures in Roselle, IL:
| Photo | Address | Area | Beds / Baths | Price | Details |
|---|---|---|---|---|---|

|
#1
Middleton Dr
Roselle, IL 60172
|
988 sq. feet
|
2 baths 3 beds |
show details | |

|
#2
Yosemite Trl
Roselle, IL 60172
|
1,135 sq. feet
|
2 baths 3 beds |
show details | |

|
#3
W Devon Ave
Roselle, IL 60172
|
2,945 sq. feet
|
3 baths 4 beds |
show details | |

|
#4
Ardmore Ave
Roselle, IL 60172
|
1,554 sq. feet
|
2 baths 4 beds |
show details | |

|
#5
E Devon Ave
Roselle, IL 60172
|
1,144 sq. feet
|
2 baths 3 beds |
show details | |

|
#6
Case Dr
Roselle, IL 60172
|
1,859 sq. feet
|
3 baths 3 beds |
show details | |

|
#7
Berwick Pl
Roselle, IL 60172
|
1,165 sq. feet
|
2 baths 3 beds |
show details | |

|
#8
Rosemont Ave
Roselle, IL 60172
|
1,056 sq. feet
|
2 baths 3 beds |
show details | |

|
#9
Flamingo Dr
Roselle, IL 60172
|
3,540 sq. feet
|
3 baths 4 beds |
show details | |

|
#10
W Bryn Mawr Ave
Roselle, IL 60172
|
1,165 sq. feet
|
2 baths 3 beds |
show details |
| Photo | Address | Area | Beds / Baths | Price | Details |
|---|---|---|---|---|---|

|
#11
E Foster Ave
Roselle, IL 60172
|
3,788 sq. feet
|
4 baths 6 beds |
show details | |

|
#12
S Prospect St Apt 507
Roselle, IL 60172
|
1,959 sq. feet
|
2 baths 3 beds |
show details | |

|
#13
Newcastle Dr
Roselle, IL 60172
|
1,743 sq. feet
|
3 baths 3 beds |
show details | |

|
#14
Springfield Dr
Roselle, IL 60172
|
825 sq. feet
|
2 baths 4 beds |
show details | |

|
#15
Springwood Dr
Roselle, IL 60172
|
2,598 sq. feet
|
3 baths 4 beds |
show details | |

|
#16
Nassau Dr
Roselle, IL 60172
|
1,850 sq. feet
|
2 baths 4 beds |
show details | |

|
#17
Yosemite Ct
Roselle, IL 60172
|
1,135 sq. feet
|
2 baths 3 beds |
show details | |

|
#18
Dee Ln
Roselle, IL 60172
|
2,551 sq. feet
|
2 baths 4 beds |
show details | |

|
#19
Circle Dr
Roselle, IL 60172
|
1,877 sq. feet
|
2 baths 3 beds |
show details | |

|
#20
Ashbury Ln W Apt 6
Roselle, IL 60172
|
1,311 sq. feet
|
2 baths 2 beds |
show details |
| Photo | Address | Area | Beds / Baths | Price | Details |
|---|---|---|---|---|---|

|
#21
S Roselle Rd
Roselle, IL 60172
|
1,010 sq. feet
|
1 baths 3 beds |
show details | |

|
#22
Brittania Way
Roselle, IL 60172
|
1,760 sq. feet
|
2 baths 3 beds |
show details | |

|
#23
Quincy Dr
Roselle, IL 60172
|
1,138 sq. feet
|
1 baths 3 beds |
show details | |

|
#24
Fall Cir
Roselle, IL 60172
|
1,654 sq. feet
|
1 baths 3 beds |
show details | |

|
#25
Lakeside Dr
Roselle, IL 60172
|
2,560 sq. feet
|
2 baths 4 beds |
show details | |

|
#26
Welland Ct
Roselle, IL 60172
|
2,368 sq. feet
|
2 baths 3 beds |
show details | |

|
#27
E Granville Ave
Roselle, IL 60172
|
1,368 sq. feet
|
1 baths 3 beds |
show details | |

|
#28
Rosemont Ave
Roselle, IL 60172
|
2,006 sq. feet
|
1 baths 3 beds |
show details | |

|
#29
High Ridge Rd
Roselle, IL 60172
|
1,421 sq. feet
|
1 baths 2 beds |
show details | |

|
#30
Locust Ln
Roselle, IL 60172
|
2,036 sq. feet
|
2 baths 4 beds |
show details |
| Photo | Address | Area | Beds / Baths | Price | Details |
|---|---|---|---|---|---|

|
#31
Lawrence Ave Apt 112
Roselle, IL 60172
|
684 sq. feet
|
1 baths 1 beds |
show details | |

|
#32
W Ardmore Ave
Roselle, IL 60172
|
1,985 sq. feet
|
2 baths 4 beds |
show details | |

|
#33
Forum Dr
Roselle, IL 60172
|
1,885 sq. feet
|
2 baths 3 beds |
show details | |

|
#34
Terry Dr
Roselle, IL 60172
|
3,570 sq. feet
|
4 baths 7 beds |
show details | |

|
#35
Circle Dr
Roselle, IL 60172
|
1,664 sq. feet
|
1 baths 3 beds |
show details | |

|
#36
Norfolk Ct Apt 4
Roselle, IL 60172
|
1,064 sq. feet
|
1 baths 2 beds |
show details | |

|
#37
Rodenburg Rd
Roselle, IL 60172
|
1,530 sq. feet
|
1 baths 3 beds |
show details | |

|
#38
High Ridge Rd
Roselle, IL 60172
|
1,421 sq. feet
|
1 baths 2 beds |
show details | |

|
#39
Bryce Trl
Roselle, IL 60172
|
1,594 sq. feet
|
2 baths - beds |
show details | |

|
#40
Roslyn Rd
Roselle, IL 60172
|
1,743 sq. feet
|
1 baths - beds |
show details |
| Photo | Address | Area | Beds / Baths | Price | Details |
|---|---|---|---|---|---|

|
#41
Ashbury Ct
Roselle, IL 60172
|
- sq. feet
|
2 baths 2 beds |
show details | |

|
#42
Indian Hill Dr
Roselle, IL 60172
|
1,300 sq. feet
|
1 baths - beds |
show details | |

|
#43
Carlsbad Trl
Roselle, IL 60172
|
1,271 sq. feet
|
1 baths - beds |
show details | |

|
#44
E Nerge Rd
Roselle, IL 60172
|
- sq. feet
|
- baths - beds |
show details | |

|
#45
Thorn Ave
Roselle, IL 60172
|
- sq. feet
|
- baths - beds |
show details | |

|
#46
Prescott Dr Apt 104
Roselle, IL 60172
|
- sq. feet
|
- baths - beds |
show details | |

|
#47
Central Ave Unit 72372
Roselle, IL 60172
|
- sq. feet
|
- baths - beds |
show details | |

|
#48
Cross Creek Dr N Apt 1b
Roselle, IL 60172
|
- sq. feet
|
- baths - beds |
show details | |

|
#49
Gary Ave
Roselle, IL 60172
|
- sq. feet
|
- baths - beds |
show details | |

|
Check over 1 million property listings on Foreclosure.com!
|
browse all offers | |||


- 17,00875.2%White alone
- 2,34610.4%Asian alone
- 2,1689.6%Hispanic
- 6392.8%Two or more races
- 2020.9%Black alone
- 160.07%Other race alone
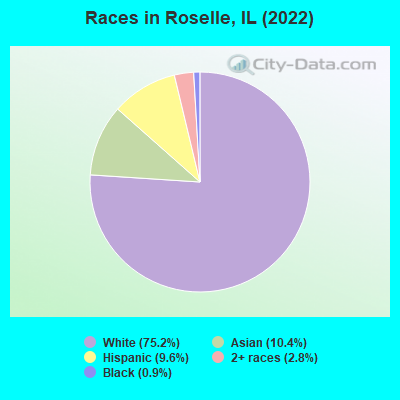
Races in Roselle detailed stats: ancestries, foreign born residents, place of birth
According to our research of Illinois and other state lists, there were 10 registered sex offenders living in Roselle, Illinois as of June 03, 2024.
The ratio of all residents to sex offenders in Roselle is 2,288 to 1.
The ratio of registered sex offenders to all residents in this city is much lower than the state average.
Type |
2009 |
2010 |
2011 |
2012 |
2013 |
2014 |
2015 |
2016 |
2017 |
2018 |
2019 |
2020 |
|---|---|---|---|---|---|---|---|---|---|---|---|---|
| Murders (per 100,000) | 0 (0.0) | 0 (0.0) | 0 (0.0) | 0 (0.0) | 0 (0.0) | 0 (0.0) | 0 (0.0) | 0 (0.0) | 0 (0.0) | 0 (0.0) | 1 (4.4) | 1 (4.5) |
| Rapes (per 100,000) | 0 (0.0) | 8 (35.1) | 7 (30.7) | 2 (8.7) | 3 (13.0) | 2 (8.7) | 3 (13.0) | 11 (47.7) | 5 (21.9) | 6 (26.3) | 7 (30.9) | 4 (17.8) |
| Robberies (per 100,000) | 9 (38.8) | 9 (39.5) | 4 (17.5) | 4 (17.4) | 2 (8.7) | 1 (4.3) | 7 (30.3) | 2 (8.7) | 4 (17.5) | 1 (4.4) | 3 (13.2) | 1 (4.5) |
| Assaults (per 100,000) | 12 (51.7) | 7 (30.8) | 7 (30.7) | 6 (26.2) | 5 (21.7) | 5 (21.6) | 6 (26.0) | 5 (21.7) | 4 (17.5) | 2 (8.8) | 5 (22.1) | 8 (35.7) |
| Burglaries (per 100,000) | 36 (155.2) | 47 (206.5) | 45 (197.1) | 73 (318.5) | 30 (130.2) | 24 (103.9) | 18 (77.9) | 29 (125.9) | 27 (118.3) | 24 (105.3) | 14 (61.8) | 21 (93.6) |
| Thefts (per 100,000) | 281 (1,211) | 213 (935.7) | 205 (897.9) | 225 (981.5) | 203 (880.8) | 212 (917.9) | 130 (562.9) | 157 (681.5) | 132 (578.3) | 172 (754.4) | 122 (538.8) | 131 (584.0) |
| Auto thefts (per 100,000) | 5 (21.6) | 5 (22.0) | 7 (30.7) | 8 (34.9) | 11 (47.7) | 10 (43.3) | 4 (17.3) | 4 (17.4) | 10 (43.8) | 10 (43.9) | 10 (44.2) | 9 (40.1) |
| Arson (per 100,000) | 2 (8.6) | 1 (4.4) | 0 (0.0) | 1 (4.4) | 0 (0.0) | 3 (13.0) | 6 (26.0) | 3 (13.0) | 2 (8.8) | 1 (4.4) | 1 (4.4) | 0 (0.0) |
| City-Data.com crime index | 83.0 | 99.8 | 88.1 | 81.8 | 65.5 | 60.0 | 54.0 | 82.6 | 61.2 | 65.2 | 71.4 | 64.8 |
The City-Data.com crime index weighs serious crimes and violent crimes more heavily. Higher means more crime, U.S. average is 246.1. It adjusts for the number of visitors and daily workers commuting into cities.
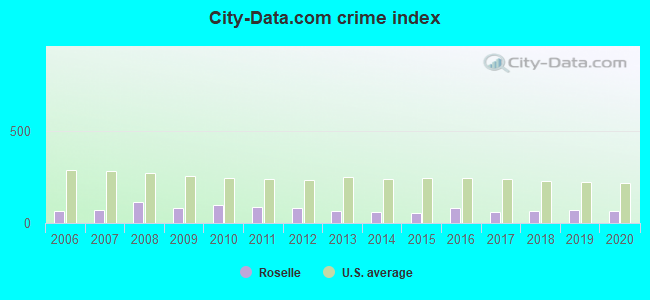
Crime rate in Roselle detailed stats: murders, rapes, robberies, assaults, burglaries, thefts, arson
Full-time law enforcement employees in 2016, including police officers: 36 (29 officers - 24 male; 5 female).
| Officers per 1,000 residents here: | 1.26 |
| Illinois average: | 3.16 |
 Recent articles from our blog. Our writers, many of them Ph.D. graduates or candidates, create easy-to-read articles on a wide variety of topics.

 | top 3 areas to avoid in nw suburbs (84 replies) |
| Suburbs that are obscure or little-known (240 replies) |
| Buffalo Grove/Arlington Heights vs. Naperville (19 replies) |
| Relocating /// NYC to CHICAGO. Safe Suburban Home Commutable to Downtown. (72 replies) |
| Is there airplane noise in Bloomingdale? (5 replies) |
| Lake County, tell me about Antioch Illinois please. (6 replies) |
Latest news from Roselle, IL collected exclusively by city-data.com from local newspapers, TV, and radio stations
Ancestries: Polish (31.0%), Italian (8.8%), German (6.1%), Irish (4.1%), American (3.8%), Assyrian (2.4%).
Current Local Time: CST time zone
Incorporated on 01/02/1934
Elevation: 770 feet
Land area: 5.37 square miles.
Population density: 4,188 people per square mile (average).
5,332 residents are foreign born (11.8% Europe, 8.6% Asia, 2.5% Latin America).
| This village: | 23.6% |
| Illinois: | 14.1% |
Median real estate property taxes paid for housing units with mortgages in 2022: $6,592 (2.2%)
Median real estate property taxes paid for housing units with no mortgage in 2022: $6,620 (2.2%)
Nearest city with pop. 50,000+: Schaumburg, IL  (3.4 miles , pop. 75,386).
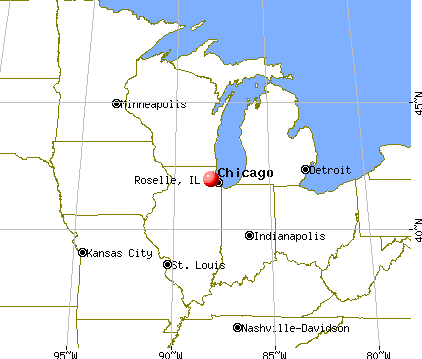
Nearest city with pop. 200,000+: Chicago, IL (23.0 miles , pop. 2,896,016).
Nearest cities:
Latitude: 41.98 N, Longitude: 88.09 W
Daytime population change due to commuting: -2,192 (-9.7%)
Workers who live and work in this village: 2,772 (22.9%)
Area codes: 847, 630, 708, 312, 224

Roselle, Illinois accommodation & food services, waste management - Economy and Business Data
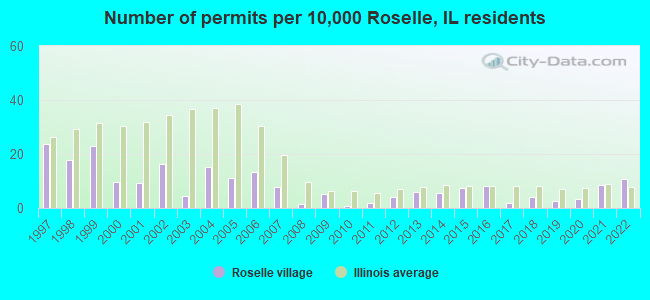
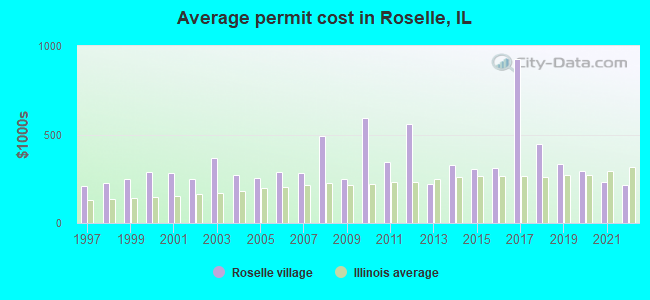
Single-family new house construction building permits:
- 2022: 25 buildings, average cost: $212,800
- 2021: 20 buildings, average cost: $232,000
- 2020: 8 buildings, average cost: $290,600
- 2019: 6 buildings, average cost: $335,800
- 2018: 9 buildings, average cost: $444,200
- 2017: 4 buildings, average cost: $925,000
- 2016: 19 buildings, average cost: $309,800
- 2015: 17 buildings, average cost: $304,300
- 2014: 13 buildings, average cost: $330,400
- 2013: 14 buildings, average cost: $219,800
- 2012: 9 buildings, average cost: $560,000
- 2011: 4 buildings, average cost: $345,000
- 2010: 2 buildings, average cost: $594,500
- 2009: 12 buildings, average cost: $248,800
- 2008: 3 buildings, average cost: $490,000
- 2007: 18 buildings, average cost: $280,800
- 2006: 31 buildings, average cost: $287,900
- 2005: 26 buildings, average cost: $256,400
- 2004: 35 buildings, average cost: $273,600
- 2003: 10 buildings, average cost: $369,000
- 2002: 38 buildings, average cost: $249,500
- 2001: 21 buildings, average cost: $281,200
- 2000: 22 buildings, average cost: $287,000
- 1999: 53 buildings, average cost: $247,700
- 1998: 41 buildings, average cost: $226,500
- 1997: 55 buildings, average cost: $210,900
| Here: | 3.1% |
| Illinois: | 4.2% |
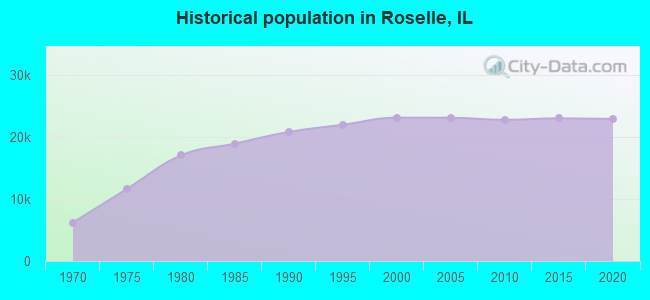
Population change in the 1990s: +2,080 (+9.9%).
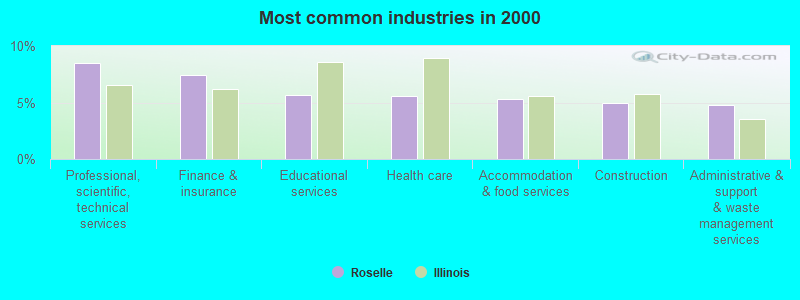
- Professional, scientific, technical services (8.5%)
- Finance & insurance (7.4%)
- Educational services (5.7%)
- Health care (5.6%)
- Accommodation & food services (5.3%)
- Construction (5.0%)
- Administrative & support & waste management services (4.7%)
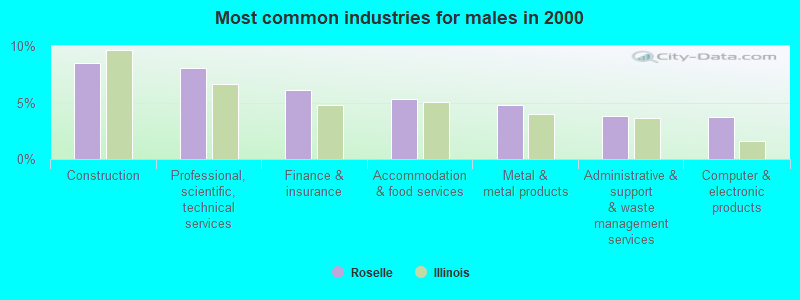
- Construction (8.5%)
- Professional, scientific, technical services (8.0%)
- Finance & insurance (6.1%)
- Accommodation & food services (5.3%)
- Metal & metal products (4.8%)
- Administrative & support & waste management services (3.8%)
- Computer & electronic products (3.7%)
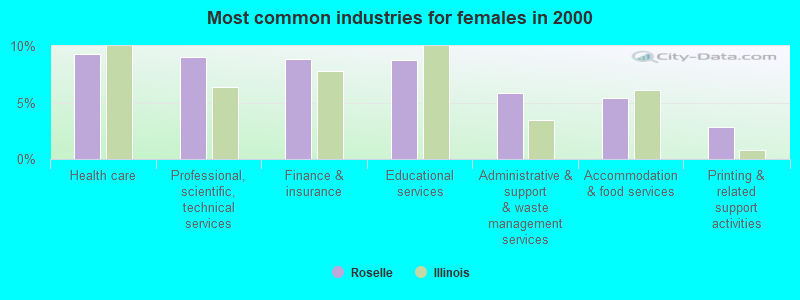
- Health care (9.3%)
- Professional, scientific, technical services (9.1%)
- Finance & insurance (8.8%)
- Educational services (8.7%)
- Administrative & support & waste management services (5.8%)
- Accommodation & food services (5.4%)
- Printing & related support activities (2.9%)
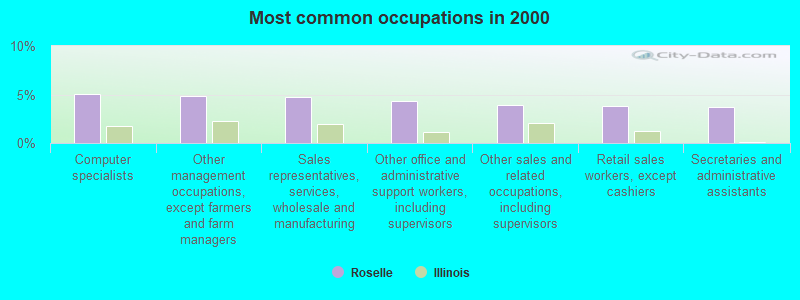
- Computer specialists (5.1%)
- Other management occupations, except farmers and farm managers (4.8%)
- Sales representatives, services, wholesale and manufacturing (4.7%)
- Other office and administrative support workers, including supervisors (4.3%)
- Other sales and related occupations, including supervisors (3.9%)
- Retail sales workers, except cashiers (3.9%)
- Secretaries and administrative assistants (3.7%)
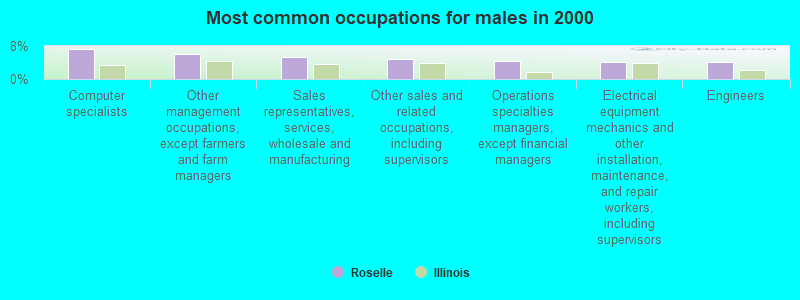
- Computer specialists (7.2%)
- Other management occupations, except farmers and farm managers (6.0%)
- Sales representatives, services, wholesale and manufacturing (5.4%)
- Other sales and related occupations, including supervisors (4.7%)
- Operations specialties managers, except financial managers (4.4%)
- Electrical equipment mechanics and other installation, maintenance, and repair workers, including supervisors (4.2%)
- Engineers (4.0%)
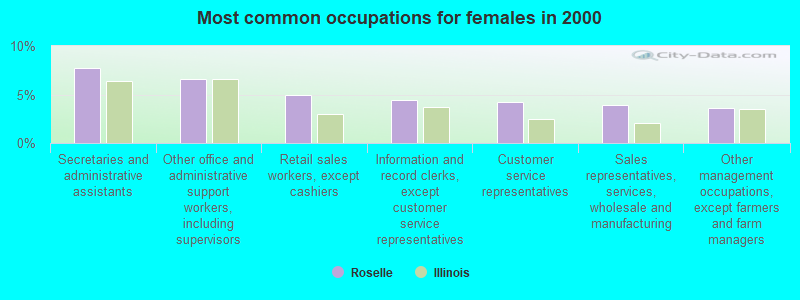
- Secretaries and administrative assistants (7.7%)
- Other office and administrative support workers, including supervisors (6.6%)
- Retail sales workers, except cashiers (4.9%)
- Information and record clerks, except customer service representatives (4.5%)
- Customer service representatives (4.2%)
- Sales representatives, services, wholesale and manufacturing (3.9%)
- Other management occupations, except farmers and farm managers (3.6%)
Average climate in Roselle, Illinois
Based on data reported by over 4,000 weather stations


|
|


(lower is better)
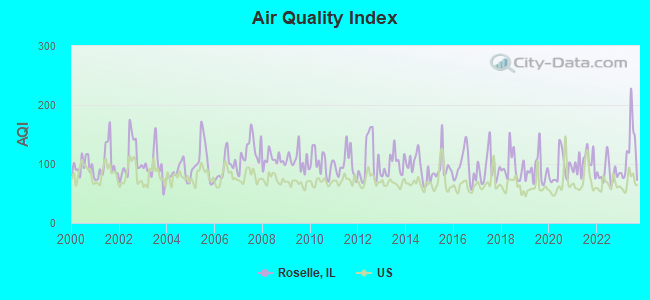
Air Quality Index (AQI) level in 2023 was 121. This is significantly worse than average.
| City: | 121 |
| U.S.: | 73 |
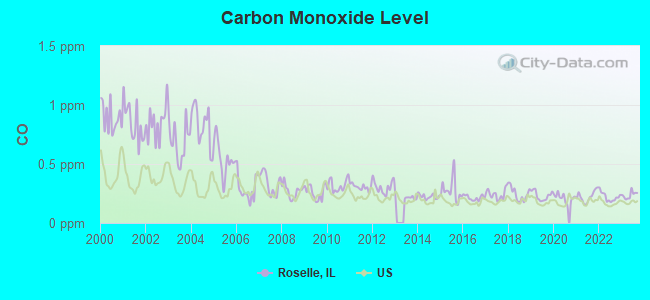
Carbon Monoxide (CO) [ppm] level in 2023 was 0.237. This is about average. Closest monitor was 8.4 miles away from the city center.
| City: | 0.237 |
| U.S.: | 0.251 |
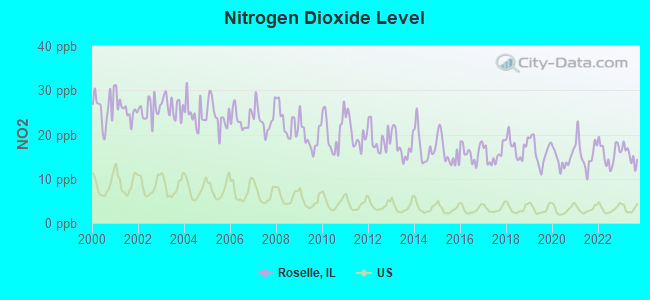
Nitrogen Dioxide (NO2) [ppb] level in 2023 was 15.4. This is significantly worse than average. Closest monitor was 3.2 miles away from the city center.
| City: | 15.4 |
| U.S.: | 5.1 |
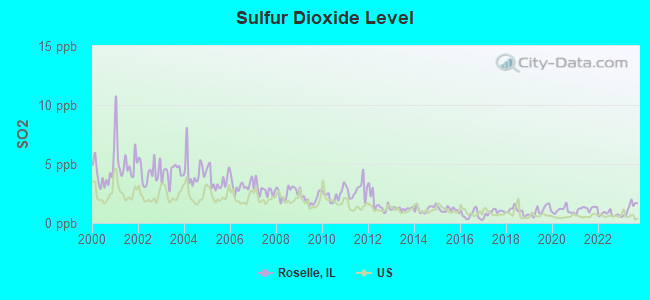
Sulfur Dioxide (SO2) [ppb] level in 2023 was 1.23. This is better than average. Closest monitor was 3.2 miles away from the city center.
| City: | 1.23 |
| U.S.: | 1.51 |
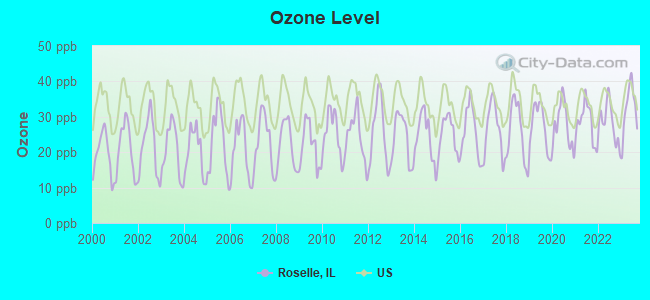
Ozone [ppb] level in 2023 was 32.3. This is about average. Closest monitor was 7.0 miles away from the city center.
| City: | 32.3 |
| U.S.: | 33.3 |
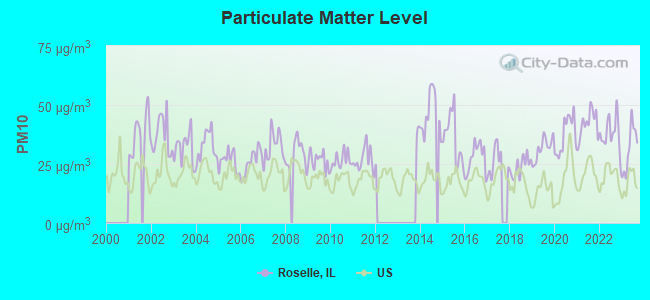
Particulate Matter (PM10) [µg/m3] level in 2023 was 31.4. This is significantly worse than average. Closest monitor was 5.2 miles away from the city center.
| City: | 31.4 |
| U.S.: | 19.2 |
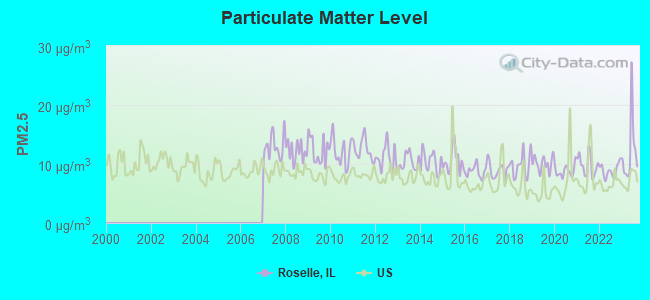
Particulate Matter (PM2.5) [µg/m3] level in 2023 was 12.0. This is significantly worse than average. Closest monitor was 9.8 miles away from the city center.
| City: | 12.0 |
| U.S.: | 8.1 |
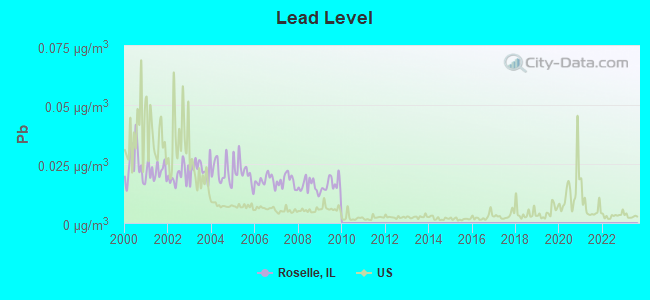
Lead (Pb) [µg/m3] level in 2009 was 0.0162. This is significantly worse than average. Closest monitor was 3.2 miles away from the city center.
| City: | 0.0162 |
| U.S.: | 0.0093 |
Tornado activity:
Roselle-area historical tornado activity is slightly below Illinois state average. It is 44% greater than the overall U.S. average.
On 8/28/1990, a category F5 (max. wind speeds 261-318 mph) tornado 24.9 miles away from the Roselle village center killed 29 people and injured 350 people and caused between $50,000 and $500,000 in damages.
On 4/21/1967, a category F4 (max. wind speeds 207-260 mph) tornado 15.1 miles away from the village center killed one person and injured 100 people and caused between $500,000 and $5,000,000 in damages.
Earthquake activity:
Roselle-area historical earthquake activity is significantly above Illinois state average. It is 42% greater than the overall U.S. average.On 4/18/2008 at 09:36:59, a magnitude 5.4 (5.1 MB, 4.8 MS, 5.4 MW, 5.2 MW, Class: Moderate, Intensity: VI - VII) earthquake occurred 244.3 miles away from the city center
On 6/10/1987 at 23:48:54, a magnitude 5.1 (4.9 MB, 4.4 MS, 4.6 MS, 5.1 LG) earthquake occurred 218.8 miles away from Roselle center
On 4/18/2008 at 09:36:59, a magnitude 5.2 (5.2 MW, Depth: 8.9 mi) earthquake occurred 244.3 miles away from Roselle center
On 6/28/2004 at 06:10:52, a magnitude 4.2 (4.2 MW, Depth: 6.2 mi, Class: Light, Intensity: IV - V) earthquake occurred 55.4 miles away from Roselle center
On 2/10/2010 at 09:59:35, a magnitude 3.8 (3.8 MW, Depth: 6.2 mi, Class: Light, Intensity: II - III) earthquake occurred 21.2 miles away from Roselle center
On 6/18/2002 at 17:37:15, a magnitude 5.0 (4.3 MB, 4.6 MW, 5.0 LG) earthquake occurred 276.7 miles away from the city center
Magnitude types: regional Lg-wave magnitude (LG), body-wave magnitude (MB), surface-wave magnitude (MS), moment magnitude (MW)
Natural disasters:
The number of natural disasters in DuPage County (15) is near the US average (15).Major Disasters (Presidential) Declared: 10
Emergencies Declared: 4
Causes of natural disasters: Floods: 8, Storms: 8, Snowstorms: 2, Tornadoes: 2, Winter Storms: 2, Blizzard: 1, Hurricane: 1, Snow: 1, Wind: 1, Other: 1 (Note: some incidents may be assigned to more than one category).

Hospitals and medical centers in Roselle:
Other hospitals and medical centers near Roselle:
- HEALING TOUCH HOMEHEALTH SERVICES, INC (Home Health Center, about 2 miles away; BLOOMINGDALE, IL)
- HOME HEALTH CONNECT, INC (Home Health Center, about 2 miles away; BLOOMINGDALE, IL)
- NURTURE CARE HOME HEALTH, INC (Home Health Center, about 2 miles away; BLOOMINGDALE, IL)
- ALDEN OF OLD TOWN WEST (Hospital, about 2 miles away; BLOOMINGDALE, IL)
- DAVITA - SCHAUMBURG RENAL CENTER (Dialysis Facility, about 2 miles away; SCHAUMBURG, IL)
- 1ST ASSIST HOME HEALTHCARE, LLC (Home Health Center, about 2 miles away; SCHAUMBURG, IL)
- LEXINGTON HLTH CR CTR-BLMNGDL (Nursing Home, about 2 miles away; BLOOMINGDALE, IL)
Heliports located in Roselle:
Amtrak stations near Roselle:
- 15 miles: NAPERVILLE (E. 4TH & ELLSWORTH AVE.) . Services: ticket office, partially wheelchair accessible, enclosed waiting area, public restrooms, public payphones, free short-term parking, free long-term parking, call for taxi service, public transit connection.
- 16 miles: GLENVIEW (1116 DEPOT ST.) . Services: ticket office, fully wheelchair accessible, enclosed waiting area, public restrooms, public payphones, free short-term parking, free long-term parking, call for car rental service, taxi stand, public transit connection.
- 16 miles: LA GRANGE ROAD (LA GRANGE, 25 W. BURLINGTON AVE.) . Services: enclosed waiting area, public payphones, taxi stand, public transit connection.
Colleges/universities with over 2000 students nearest to Roselle:
- Chamberlain College of Nursing-Illinois (about 4 miles; Addison, IL; Full-time enrollment: 8,977)
- Universal Technical Institute of Illinois Inc (about 4 miles; Glendale Heights, IL; FT enrollment: 2,281)
- American InterContinental University-Online (about 5 miles; Schaumburg, IL; FT enrollment: 16,158)
- Harper College (about 8 miles; Palatine, IL; FT enrollment: 10,800)
- Wheaton College (about 8 miles; Wheaton, IL; FT enrollment: 2,948)
- Elmhurst College (about 10 miles; Elmhurst, IL; FT enrollment: 3,364)
- College of DuPage (about 10 miles; Glen Ellyn, IL; FT enrollment: 18,910)
Public high school in Roselle:
- LAKE PARK HIGH SCHOOL (Students: 3,053, Location: 500 W BRYN MAWR AVE, Grades: 9-12)
Public elementary/middle schools in Roselle:
- FREDERICK NERGE ELEM SCHOOL (Students: 639, Location: 660 N WOODFIELD TRL, Grades: KG-6)
- WATERBURY ELEM SCHOOL (Students: 606, Location: 355 RODENBURG RD, Grades: KG-5)
- SPRING HILLS ELEM SCHOOL (Students: 423, Location: 560 PINECROFT DR, Grades: KG-5)
- ROSELLE MIDDLE SCHOOL (Students: 246, Location: 500 S PARK ST, Grades: 6-8)
- MEDINAH MIDDLE SCHOOL (Students: 236, Location: 700 E GRANVILLE AVE, Grades: 6-8)
Private elementary/middle school in Roselle:
Points of interest:
Notable locations in Roselle: Roselle Village Hall (A), Roselle Fire Department (B). Display/hide their locations on the map
Shopping Centers: Cross Creek Commons Shopping Center (1), Roselle Towne Square Shopping Center (2). Display/hide their locations on the map
Churches in Roselle include: Canaan Apostolic United Church (A), Christian Tabernacle Church (B), Medinah Baptist Church (C), Roselle United Methodist Church (D), Saint Walter's Catholic Church (E). Display/hide their locations on the map
Cemetery: Freinenigreit Cemetery (1). Display/hide its location on the map
Reservoir: Turner Pond (A). Display/hide its location on the map
Parks in Roselle include: Valley Park (1), Turner Park (2), Springhill Park (3), Rock Run Park (4), Brookrose Park (5), Claus Farm Recreation Area (6), Kemmering Park (7), Kennedy Park (8), Pine Park (9). Display/hide their locations on the map
Tourist attractions: Art Excursions- Inc. (Museums; 194 Cheviot Court), Four Seasons Family Fun Center (Amusement & Theme Parks; 1350 Lake Street).
Birthplace of: Glenn Kotche - Rock drummer, Don Schulze - Baseball player, Don Sunderlage - Basketball player, Jake Gannon - Ice hockey player, Keith Hackney - Martial artist.
Drinking water stations with addresses in Roselle that have no violations reported:
- LIVING HOPE BIBLE CHURCH (Population served: 300, Primary Water Source Type: Groundwater)
- WOODLAND WINDOWS & DOORS (Population served: 60, Primary Water Source Type: Groundwater)
- WILDWOOD RESORT (Serves WI, Population served: 25, Primary Water Source Type: Groundwater)
- LAKE COUNTY WINERY (Population served: 25, Primary Water Source Type: Groundwater)
| This village: | 2.6 people |
| Illinois: | 2.6 people |
| This village: | 71.8% |
| Whole state: | 65.8% |
| This village: | 5.1% |
| Whole state: | 6.3% |
Likely homosexual households (counted as self-reported same-sex unmarried-partner households)
- Lesbian couples: 0.4% of all households
- Gay men: 0.3% of all households
3 people in other noninstitutional facilities in 2010
73 people in nursing homes in 2000
Banks with branches in Roselle (2011 data):
- BMO Harris Bank National Association: Drive-In Facility at 400 East Irving Park, branch established on 1971/10/27; Harris Bk West Na Branch at 110 East Irving Park Road, branch established on 1934/01/01. Info updated 2011/07/14: Bank assets: $97,264.0 mil, Deposits: $75,624.6 mil, headquarters in Chicago, IL, positive income, 717 total offices, Holding Company: Bank Of Montreal
- RBS Citizens, National Association: Roselle/Butera Branch at 5500 W. Lake Street, branch established on 2003/02/25. Info updated 2007/09/19: Bank assets: $106,940.6 mil, Deposits: $75,690.2 mil, headquarters in Providence, RI, positive income, 1135 total offices, Holding Company: Uk Financial Investments Limited
- Associated Bank, National Association: Roselle Branch at 56 East Irving Park Road, branch established on 1883/01/01. Info updated 2008/09/12: Bank assets: $21,715.0 mil, Deposits: $15,244.4 mil, headquarters in Green Bay, WI, positive income, Commercial Lending Specialization, 282 total offices, Holding Company: Associated Banc-Corp
- United Central Bank: Roselle Branch at 801 East Nerge Road, branch established on 2001/02/15. Info updated 2009/08/04: Bank assets: $2,348.5 mil, Deposits: $2,060.1 mil, headquarters in Garland, TX, negative income in the last year, Commercial Lending Specialization, 30 total offices, Holding Company: Central Bancorp, Inc.
- Harris Central National Association: at 110 East Irving Park Road, branch established on 2005/05/28. Info updated 2006/11/03: Bank assets: $4.6 mil, Deposits: $0.5 mil, local headquarters, positive income, 1 total offices, Holding Company: Bank Of Montreal
- Firstmerit Bank, National Association: Roselle Branch at 505 North Roselle Road, branch established on 2000/02/15. Info updated 2010/05/17: Bank assets: $14,420.6 mil, Deposits: $11,497.6 mil, headquarters in Akron, OH, positive income, Commercial Lending Specialization, 213 total offices, Holding Company: Firstmerit Corporation
- Schaumburg Bank & Trust Company, National Association: Roselle Bank & Trust, A Branch Of Schaumburg Bank & Trust Company, N.A. at 1350 West Lake Street, branch established on 2001/01/22. Info updated 2011/12/02: Bank assets: $590.8 mil, Deposits: $477.2 mil, headquarters in Schaumburg, IL, positive income, Commercial Lending Specialization, 6 total offices, Holding Company: Wintrust Financial Corporation
For population 15 years and over in Roselle:
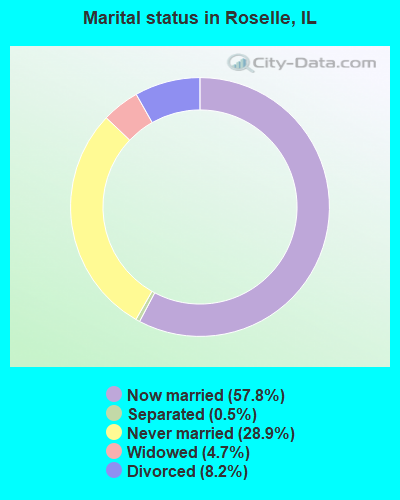
- Never married: 28.9%
- Now married: 57.8%
- Separated: 0.5%
- Widowed: 4.7%
- Divorced: 8.2%
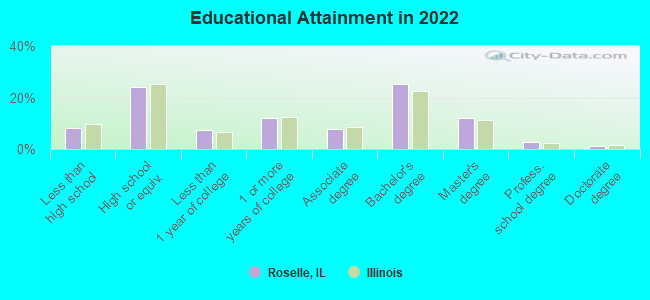
For population 25 years and over in Roselle:
- High school or higher: 92.3%
- Bachelor's degree or higher: 39.4%
- Graduate or professional degree: 15.1%
- Unemployed: 2.5%
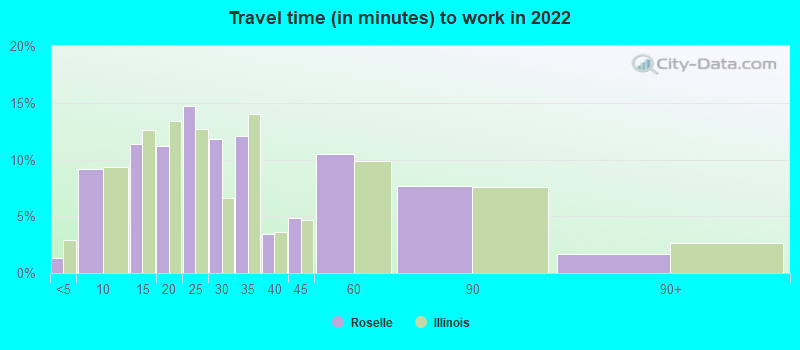
- Mean travel time to work (commute): 24.0 minutes
| Here: | 11.5 |
| Illinois average: | 12.5 |
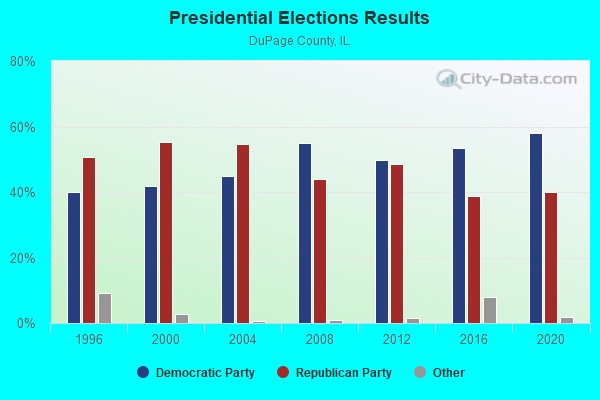
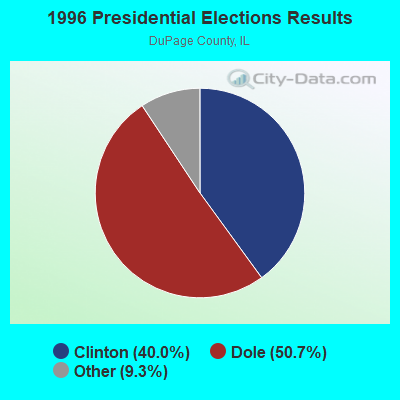
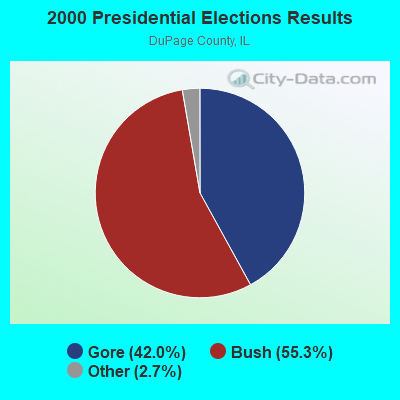
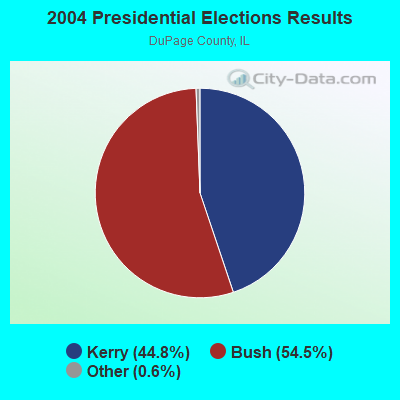
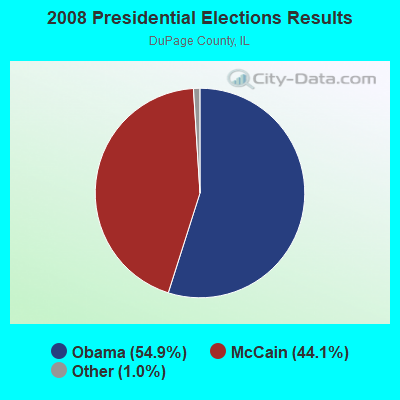
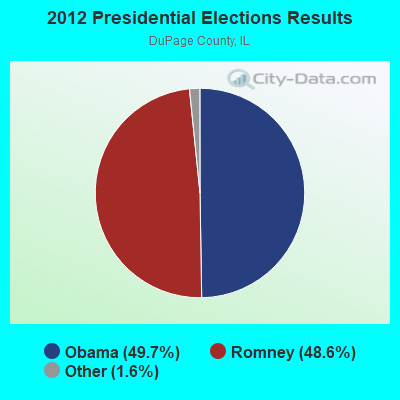
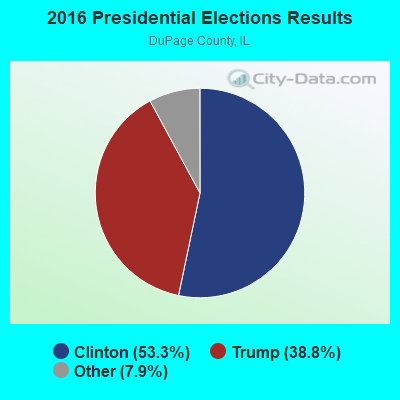
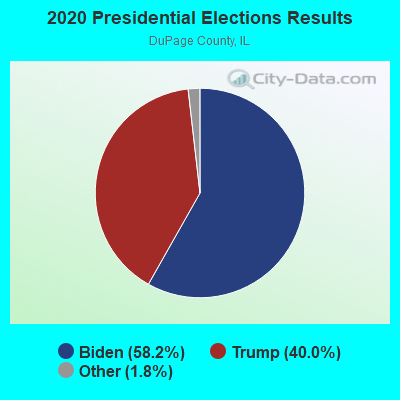
Graphs represent county-level data. Detailed 2008 Election Results
Religion statistics for Roselle, IL (based on DuPage County data)
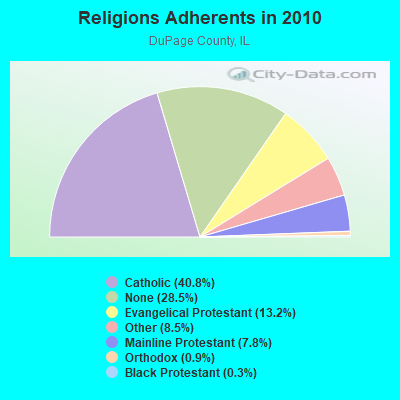
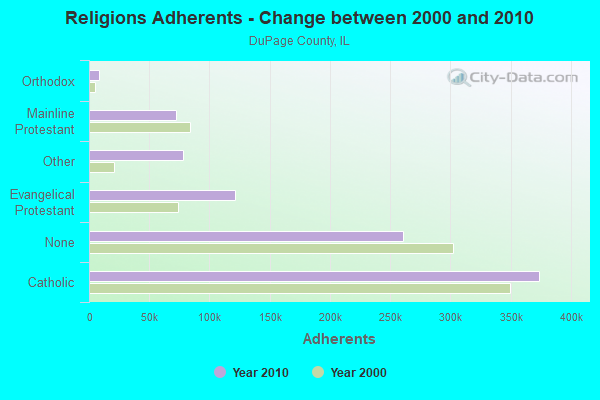
| Religion | Adherents | Congregations |
|---|---|---|
| Catholic | 373,823 | 54 |
| Evangelical Protestant | 120,953 | 247 |
| Other | 77,889 | 80 |
| Mainline Protestant | 71,909 | 126 |
| Orthodox | 8,460 | 10 |
| Black Protestant | 3,014 | 5 |
| None | 260,876 | - |
Food Environment Statistics:
| DuPage County: | 1.89 / 10,000 pop. |
| State: | 2.24 / 10,000 pop. |
| Here: | 0.09 / 10,000 pop. |
| State: | 0.08 / 10,000 pop. |
| DuPage County: | 1.05 / 10,000 pop. |
| Illinois: | 0.75 / 10,000 pop. |
| DuPage County: | 2.16 / 10,000 pop. |
| Illinois: | 2.61 / 10,000 pop. |
| This county: | 7.24 / 10,000 pop. |
| Illinois: | 6.86 / 10,000 pop. |
| Here: | 7.1% |
| Illinois: | 8.3% |
| DuPage County: | 24.0% |
| Illinois: | 25.2% |
| This county: | 13.2% |
| Illinois: | 14.5% |
Health and Nutrition:
| Here: | 50.1% |
| Illinois: | 49.5% |
| This city: | 47.5% |
| Illinois: | 47.2% |
| Roselle: | 28.5 |
| State: | 28.6 |
| Roselle: | 21.5% |
| Illinois: | 20.5% |
| Roselle: | 10.7% |
| State: | 10.8% |
| Here: | 6.8 |
| State: | 6.8 |
| Roselle: | 33.3% |
| Illinois: | 33.4% |
| Here: | 57.3% |
| Illinois: | 56.4% |
| This city: | 80.1% |
| State: | 79.9% |
More about Health and Nutrition of Roselle, IL Residents
| Local government employment and payroll (March 2022) | |||||
| Function | Full-time employees | Monthly full-time payroll | Average yearly full-time wage | Part-time employees | Monthly part-time payroll |
|---|---|---|---|---|---|
| Police Protection - Officers | 31 | $284,952 | $110,304 | 0 | $0 |
| Firefighters | 18 | $197,579 | $131,719 | 14 | $28,422 |
| Police - Other | 10 | $49,267 | $59,120 | 0 | $0 |
| Sewerage | 9 | $63,647 | $84,863 | 0 | $0 |
| Streets and Highways | 9 | $54,629 | $72,839 | 0 | $0 |
| Other Government Administration | 8 | $27,999 | $41,999 | 4 | $1,749 |
| Other and Unallocable | 6 | $52,671 | $105,342 | 2 | $901 |
| Financial Administration | 6 | $41,386 | $82,772 | 1 | $3,377 |
| Water Supply | 4 | $25,254 | $75,762 | 0 | $0 |
| Welfare | 2 | $13,660 | $81,960 | 0 | $0 |
| Fire - Other | 0 | $0 | 3 | $2,218 | |
| Totals for Government | 103 | $811,044 | $94,491 | 24 | $36,667 |
Roselle government finances - Expenditure in 2017 (per resident):
- Construction - Police Protection: $1,846,000 ($82.03)
Regular Highways: $231,000 ($10.26)
Water Utilities: $201,000 ($8.93)
Financial Administration: $123,000 ($5.47)
General Public Buildings: $27,000 ($1.20)
- Current Operations - Water Utilities: $6,331,000 ($281.32)
Police Protection: $6,300,000 ($279.94)
Local Fire Protection: $3,940,000 ($175.07)
General Public Buildings: $2,789,000 ($123.93)
Regular Highways: $1,925,000 ($85.54)
General - Other: $426,000 ($18.93)
Parks and Recreation: $104,000 ($4.62)
- General - Interest on Debt: $664,000 ($29.50)
- Other Capital Outlay - Local Fire Protection: $1,754,000 ($77.94)
Water Utilities: $624,000 ($27.73)
Regular Highways: $228,000 ($10.13)
Police Protection: $111,000 ($4.93)
Central Staff Services: $34,000 ($1.51)
- Total Salaries and Wages: $7,926,000 ($352.19)
Roselle government finances - Revenue in 2017 (per resident):
- Charges - Other: $1,468,000 ($65.23)
Parks and Recreation: $120,000 ($5.33)
Solid Waste Management: $6,000 ($0.27)
- Federal Intergovernmental - Other: $52,000 ($2.31)
Public Welfare: $46,000 ($2.04)
- Miscellaneous - General Revenue - Other: $837,000 ($37.19)
Fines and Forfeits: $611,000 ($27.15)
Interest Earnings: $20,000 ($0.89)
- Revenue - Water Utilities: $8,704,000 ($386.76)
- State Intergovernmental - General Local Government Support: $2,988,000 ($132.77)
Highways: $580,000 ($25.77)
Other: $17,000 ($0.76)
- Tax - Property: $5,740,000 ($255.05)
General Sales and Gross Receipts: $2,680,000 ($119.08)
Public Utilities Sales: $1,551,000 ($68.92)
Other License: $1,211,000 ($53.81)
Other Selective Sales: $638,000 ($28.35)
Roselle government finances - Debt in 2017 (per resident):
- Long Term Debt - Outstanding Unspecified Public Purpose: $34,531,000 ($1534.37)
Beginning Outstanding - Unspecified Public Purpose: $30,981,000 ($1376.63)
Issue, Unspecified Public Purpose: $7,248,000 ($322.06)
Retired Unspecified Public Purpose: $3,698,000 ($164.32)
Roselle government finances - Cash and Securities in 2017 (per resident):
- Other Funds - Cash and Securities: $17,320,000 ($769.61)
7.06% of this county's 2021 resident taxpayers lived in other counties in 2020 ($90,805 average adjusted gross income)
| Here: | 7.06% |
| Illinois average: | 5.09% |
0.01% of residents moved from foreign countries ($57 average AGI)
DuPage County: 0.01% Illinois average: 0.01%
Top counties from which taxpayers relocated into this county between 2020 and 2021:
| from Cook County, IL | |
| from Will County, IL | |
| from Kane County, IL |
8.01% of this county's 2020 resident taxpayers moved to other counties in 2021 ($102,485 average adjusted gross income)
| Here: | 8.01% |
| Illinois average: | 6.10% |
0.01% of residents moved to foreign countries ($42 average AGI)
DuPage County: 0.01% Illinois average: 0.01%
Top counties to which taxpayers relocated from this county between 2020 and 2021:
| to Cook County, IL | |
| to Will County, IL | |
| to Kane County, IL |
| Businesses in Roselle, IL | ||||
| Name | Count | Name | Count | |
|---|---|---|---|---|
| Ace Hardware | 2 | FedEx | 7 | |
| Blockbuster | 1 | Jimmy John's | 1 | |
| Brunswick Bowling & Billiards | 1 | McDonald's | 1 | |
| Burger King | 1 | Pizza Hut | 1 | |
| Circle K | 1 | Starbucks | 1 | |
| Curves | 1 | U-Haul | 2 | |
| Dairy Queen | 1 | UPS | 3 | |
| Dunkin Donuts | 1 | Walgreens | 1 | |
Strongest AM radio stations in Roselle:
- WBBM (780 AM; 50 kW; CHICAGO, IL; Owner: INFINITY BROADCASTING OPERATIONS, INC.)
- WSCR (670 AM; 50 kW; CHICAGO, IL; Owner: INFINITY BROADCASTING OPERATIONS, INC.)
- WGN (720 AM; 50 kW; CHICAGO, IL; Owner: WGN CONTINENTAL BROADCASTING CO.)
- WMVP (1000 AM; 50 kW; CHICAGO, IL; Owner: ABC, INC.)
- WMBI (1110 AM; daytime; 5 kW; CHICAGO, IL; Owner: THE MOODY BIBLE INSTITUTE OF CHICAGO)
- WLS (890 AM; 50 kW; CHICAGO, IL; Owner: WLS, INC.)
- WYLL (1160 AM; 50 kW; CHICAGO, IL; Owner: SCA LICENSE CORPORATION)
- WTMJ (620 AM; 50 kW; MILWAUKEE, WI; Owner: JOURNAL BROADCAST CORPORATION)
- WCSN (820 AM; 5 kW; CHICAGO, IL; Owner: WYPA, INC.)
- WKTA (1330 AM; 5 kW; EVANSTON, IL; Owner: POLNET COMMUNICATIONS, LTD.)
- WVIV (1200 AM; 20 kW; CHICAGO, IL; Owner: WLXX-AM LICENSE CORP.)
- WISN (1130 AM; 50 kW; MILWAUKEE, WI; Owner: CAPSTAR TX LIMITED PARTNERSHIP)
- WJJG (1530 AM; daytime; 2 kW; ELMHURST, IL; Owner: JOSEPH J. GENTILE, INC.)
Strongest FM radio stations in Roselle:
- WMBI-FM (90.1 FM; CHICAGO, IL; Owner: THE MOODY BIBLE INSTITUTE OF CHICAGO)
- WLEY-FM (107.9 FM; AURORA, IL; Owner: WLEY LICENSING, INC.)
- WCKG (105.9 FM; ELMWOOD PARK, IL; Owner: INFINITY HOLDINGS CORPORATION OF ORLANDO)
- WLIT-FM (93.9 FM; CHICAGO, IL; Owner: AMFM RADIO LICENSES, L.L.C.)
- WJMK (104.3 FM; CHICAGO, IL; Owner: INFINITY BROADCASTING CORP. OF ILLINOIS)
- WNUA (95.5 FM; CHICAGO, IL; Owner: AMFM RADIO LICENSES, L.L.C.)
- WGCI-FM (107.5 FM; CHICAGO, IL; Owner: AMFM RADIO LICENSES, L.L.C.)
- WTMX (101.9 FM; SKOKIE, IL; Owner: BONNEVILLE HOLDING COMPANY)
- WBBM-FM (96.3 FM; CHICAGO, IL; Owner: INFINITY BROADCASTING OPERATIONS, INC.)
- WKSC-FM (103.5 FM; CHICAGO, IL; Owner: AMFM RADIO LICENSES, L.L.C.)
- WFMT (98.7 FM; CHICAGO, IL; Owner: WINDOW TO THE WORLD COMMUNICATIONS)
- WZZN (94.7 FM; CHICAGO, IL; Owner: ABC CHICAGO FM RADIO,INC.)
- WJKL (94.3 FM; ELGIN, IL; Owner: ELGIN BROADCASTING CO., INC.)
- WBEZ (91.5 FM; CHICAGO, IL; Owner: THE WBEZ ALLIANCE, INC.)
- WKQX (101.1 FM; CHICAGO, IL; Owner: EMMIS RADIO LICENSE CORPORATION)
- WLUP-FM (97.9 FM; CHICAGO, IL; Owner: BONNEVILLE HOLDING COMPANY)
- WNND (100.3 FM; CHICAGO, IL; Owner: BONNEVILLE HOLDING COMPANY)
- WOJO (105.1 FM; EVANSTON, IL; Owner: TICHENOR LICENSE CORPORATION ("TLC"))
- WUSN (99.5 FM; CHICAGO, IL; Owner: INFINITY BROADCASTING CORPORATION OF CHICAGO)
- WVAZ (102.7 FM; OAK PARK, IL; Owner: AMFM RADIO LICENSES, L.L.C.)
TV broadcast stations around Roselle:
- W34CK (Channel 34; ARLINGTON HEIGHTS, IL; Owner: FIRST UNITED, INC.)
- WLS-TV (Channel 7; CHICAGO, IL; Owner: WLS TELEVISION, INC.)
- WMAQ-TV (Channel 5; CHICAGO, IL; Owner: NBC SUBSIDIARY (WMAQ-TV), INC.)
- WTTW (Channel 11; CHICAGO, IL; Owner: WINDOW TO THE WORLD COMMUNICATIONS, INC.)
- WGN-TV (Channel 9; CHICAGO, IL; Owner: WGN CONTINENTAL BROADCASTING COMPANY)
- WGBO-TV (Channel 66; JOLIET, IL; Owner: WGBO LICENSE PARTNERSHIP, G.P.)
- W57DN (Channel 57; ELGIN, IL; Owner: TRINITY BROADCASTING NETWORK)
- WBBM-TV (Channel 2; CHICAGO, IL; Owner: CBS BROADCASTING INC.)
- WPWR-TV (Channel 50; GARY, IN; Owner: FOX TELEVISION STATIONS, INC.)
- WXFT (Channel 60; AURORA, IL; Owner: TELEFUTURA CHICAGO LLC)
- WCIU-TV (Channel 26; CHICAGO, IL; Owner: WCIU-TV LIMITED PARTNERSHIP)
- WCPX (Channel 38; CHICAGO, IL; Owner: PAXSON CHICAGO LICENSE, INC.)
- WFLD (Channel 32; CHICAGO, IL; Owner: FOX TELEVISION STATIONS, INC.)
- W68DO (Channel 68; PALATINE, IL; Owner: TRINITY BROADCASTING NETWORK)
- WFBT-CA (Channel 23; CHICAGO, IL; Owner: CHANNEL 23 LIMITED PARTNERSHIP)
- WSNS-TV (Channel 44; CHICAGO, IL; Owner: TELEMUNDO OF CHICAGO, INC.)
- WJYS (Channel 62; HAMMOND, IN; Owner: JOVON BROADCASTING CORPORATION)
- WOCH-LP (Channel 28; CHICAGO, IL; Owner: KM LPTV OF CHICAGO-28, L.L.C.)
- WYCC (Channel 20; CHICAGO, IL; Owner: COLLEGE DIST. #508, COUNTY OF COOK)
- WOCK-CA (Channel 13; CHICAGO, IL; Owner: KM LPTV OF CHICAGO-13, L.L.C.)
- W64CQ (Channel 64; ARLINGTON HEIGHTS, IL; Owner: TRINITY BROADCASTING NETWORK)
- W24AJ (Channel 24; AURORA, IL; Owner: NELSON TV, INC.)
- WYIN (Channel 56; GARY, IN; Owner: NORTHWEST INDIANA PUBLIC BROADCASTING, INC.)
- National Bridge Inventory (NBI) Statistics
- 8Number of bridges
- 79ft / 23.7mTotal length
- 187,450Total average daily traffic
- 15,598Total average daily truck traffic
FCC Registered Private Land Mobile Towers: 1 (See the full list of FCC Registered Private Land Mobile Towers in Roselle, IL)
FCC Registered Broadcast Land Mobile Towers: 8 (See the full list of FCC Registered Broadcast Land Mobile Towers)
FCC Registered Microwave Towers: 17 (See the full list of FCC Registered Microwave Towers in this town)
FCC Registered Amateur Radio Licenses: 98 (See the full list of FCC Registered Amateur Radio Licenses in Roselle)
FAA Registered Aircraft: 21 (See the full list of FAA Registered Aircraft in Roselle)
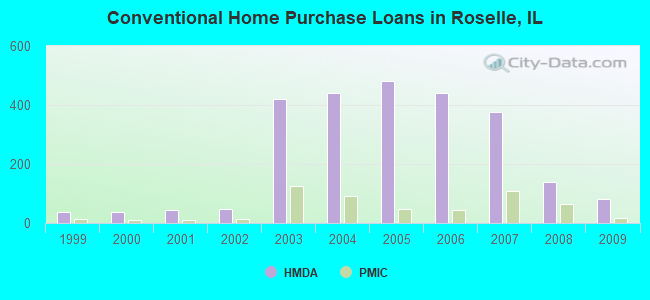
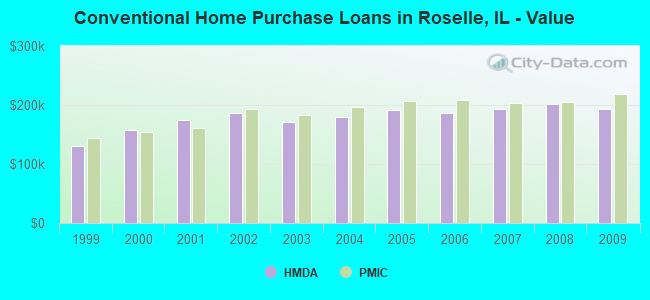
| Home Mortgage Disclosure Act Aggregated Statistics For Year 2009 (Based on 6 partial tracts) | ||||||||||||||
| A) FHA, FSA/RHS & VA Home Purchase Loans | B) Conventional Home Purchase Loans | C) Refinancings | D) Home Improvement Loans | E) Loans on Dwellings For 5+ Families | F) Non-occupant Loans on < 5 Family Dwellings (A B C & D) | G) Loans On Manufactured Home Dwelling (A B C & D) | ||||||||
|---|---|---|---|---|---|---|---|---|---|---|---|---|---|---|
| Number | Average Value | Number | Average Value | Number | Average Value | Number | Average Value | Number | Average Value | Number | Average Value | Number | Average Value | |
| LOANS ORIGINATED | 60 | $189,880 | 81 | $192,716 | 604 | $217,292 | 15 | $115,539 | 1 | $1,348,810 | 13 | $138,188 | 1 | $257,110 |
| APPLICATIONS APPROVED, NOT ACCEPTED | 3 | $269,283 | 11 | $175,577 | 63 | $237,364 | 2 | $46,245 | 0 | $0 | 2 | $266,885 | 0 | $0 |
| APPLICATIONS DENIED | 13 | $192,978 | 17 | $180,868 | 142 | $234,104 | 8 | $83,305 | 1 | $275,870 | 8 | $115,551 | 0 | $0 |
| APPLICATIONS WITHDRAWN | 3 | $167,173 | 9 | $205,828 | 76 | $216,844 | 4 | $84,540 | 0 | $0 | 3 | $91,107 | 0 | $0 |
| FILES CLOSED FOR INCOMPLETENESS | 4 | $171,782 | 3 | $305,813 | 30 | $250,832 | 0 | $0 | 0 | $0 | 2 | $112,510 | 0 | $0 |
Detailed HMDA statistics for the following Tracts: 8046.07 , 8410.01, 8410.02, 8411.02, 8411.03, 8411.04
| Private Mortgage Insurance Companies Aggregated Statistics For Year 2009 (Based on 6 partial tracts) | ||||
| A) Conventional Home Purchase Loans | B) Refinancings | |||
|---|---|---|---|---|
| Number | Average Value | Number | Average Value | |
| LOANS ORIGINATED | 16 | $217,976 | 16 | $248,189 |
| APPLICATIONS APPROVED, NOT ACCEPTED | 4 | $179,295 | 10 | $275,303 |
| APPLICATIONS DENIED | 3 | $167,157 | 3 | $228,403 |
| APPLICATIONS WITHDRAWN | 1 | $105,520 | 2 | $274,935 |
| FILES CLOSED FOR INCOMPLETENESS | 1 | $193,950 | 1 | $168,030 |
Detailed PMIC statistics for the following Tracts: 8046.07 , 8410.01, 8410.02, 8411.02, 8411.03, 8411.04
2002 - 2018 National Fire Incident Reporting System (NFIRS) incidents
- Fire incident types reported to NFIRS in Roselle, IL
- 85663.5%Structure Fires
- 30422.5%Outside Fires
- 1259.3%Mobile Property/Vehicle Fires
- 644.7%Other
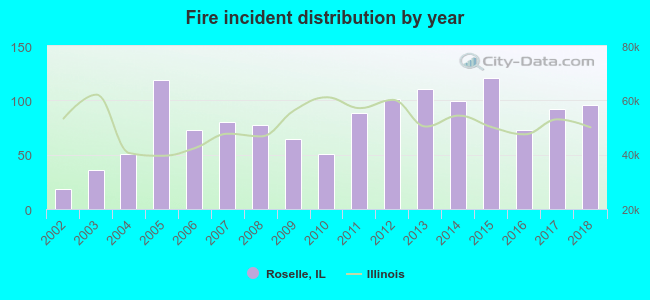 Based on the data from the years 2002 - 2018 the average number of fires per year is 79. The highest number of fire incidents - 121 took place in 2015, and the least - 18 in 2002. The data has a growing trend.
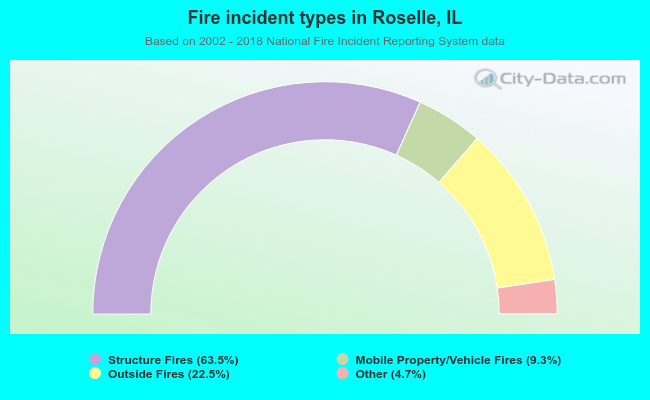 When looking into fire subcategories, the most reports belonged to: Structure Fires (63.5%), and Outside Fires (22.5%).
| Most common first names in Roselle, IL among deceased individuals | ||
| Name | Count | Lived (average) |
|---|---|---|
| John | 118 | 74.4 years |
| Mary | 99 | 79.7 years |
| William | 82 | 75.9 years |
| Robert | 73 | 66.5 years |
| Joseph | 69 | 75.7 years |
| Frank | 65 | 74.9 years |
| James | 63 | 68.3 years |
| Helen | 58 | 80.6 years |
| George | 57 | 76.1 years |
| Anna | 52 | 80.3 years |
| Most common last names in Roselle, IL among deceased individuals | ||
| Last name | Count | Lived (average) |
|---|---|---|
| Johnson | 26 | 75.8 years |
| Anderson | 22 | 76.4 years |
| Brown | 20 | 79.1 years |
| Meyer | 19 | 79.5 years |
| Smith | 17 | 70.1 years |
| Miller | 12 | 73.4 years |
| Thomas | 9 | 70.2 years |
| Swanson | 8 | 79.0 years |
| Wilson | 8 | 81.8 years |
| Carlson | 7 | 65.4 years |
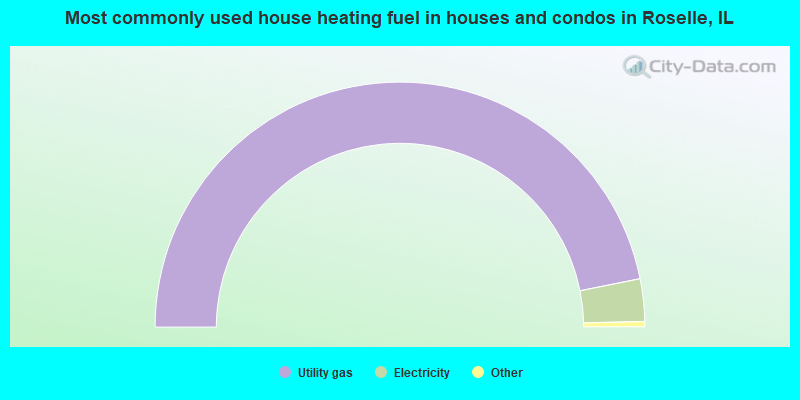
- 93.7%Utility gas
- 5.6%Electricity
- 0.3%Bottled, tank, or LP gas
- 0.3%No fuel used
- 0.1%Other fuel
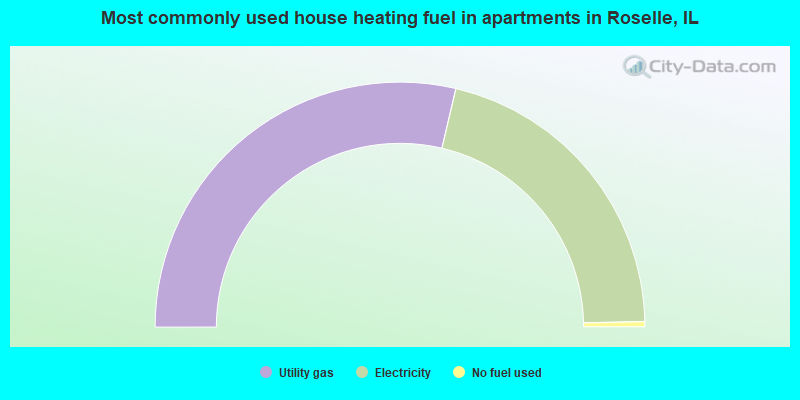
- 57.3%Utility gas
- 41.9%Electricity
- 0.7%No fuel used
Roselle compared to Illinois state average:
- Unemployed percentage significantly below state average.
- Black race population percentage significantly below state average.
- Hispanic race population percentage below state average.
- Foreign-born population percentage above state average.
- Renting percentage below state average.
- Length of stay since moving in significantly above state average.
- Percentage of population with a bachelor's degree or higher above state average.
Roselle on our top lists:
- #92 on the list of "Top 101 cities with the most residents born in Poland (population 500+)"
- #14 on the list of "Top 101 counties with the largest number of people without health insurance coverage in 2000 (pop. 50,000+)"
- #19 on the list of "Top 101 counties with the highest percentage of residents that visited a dentist within the past year"
- #23 on the list of "Top 101 counties with the most Catholic adherents"
- #25 on the list of "Top 101 counties with the best general health status score of residents (1-5), 3 years of data"
- #26 on the list of "Top 101 counties with the largest number of children under 18 without health insurance coverage in 2000 (pop. 50,000+)"

|
|
Total of 335 patent applications in 2008-2024.