Rancho Cordova, California Submit your own pictures of this place and show them to the world
OSM Map
General Map
Google Map
MSN Map
OSM Map
General Map
Google Map
MSN Map
OSM Map
General Map
Google Map
MSN Map
OSM Map
General Map
Google Map
MSN Map
Please wait while loading the map...
Population in 2022: 80,598 (98% urban, 2% rural). Population change since 2000: +46.4%Males: 38,842 Females: 41,756
March 2022 cost of living index in Rancho Cordova: 102.5 (near average, U.S. average is 100) Percentage of residents living in poverty in 2022: 11.9%for White Non-Hispanic residents , 18.6% for Black residents , 11.5% for Hispanic or Latino residents , 5.1% for American Indian residents , 8.6% for Native Hawaiian and other Pacific Islander residents , 12.1% for other race residents , 12.0% for two or more races residents )
Profiles of local businesses
Business Search - 14 Million verified businesses
Data:
Median household income ($)
Median household income (% change since 2000)
Household income diversity
Ratio of average income to average house value (%)
Ratio of average income to average rent
Median household income ($) - White
Median household income ($) - Black or African American
Median household income ($) - Asian
Median household income ($) - Hispanic or Latino
Median household income ($) - American Indian and Alaska Native
Median household income ($) - Multirace
Median household income ($) - Other Race
Median household income for houses/condos with a mortgage ($)
Median household income for apartments without a mortgage ($)
Races - White alone (%)
Races - White alone (% change since 2000)
Races - Black alone (%)
Races - Black alone (% change since 2000)
Races - American Indian alone (%)
Races - American Indian alone (% change since 2000)
Races - Asian alone (%)
Races - Asian alone (% change since 2000)
Races - Hispanic (%)
Races - Hispanic (% change since 2000)
Races - Native Hawaiian and Other Pacific Islander alone (%)
Races - Native Hawaiian and Other Pacific Islander alone (% change since 2000)
Races - Two or more races (%)
Races - Two or more races (% change since 2000)
Races - Other race alone (%)
Races - Other race alone (% change since 2000)
Racial diversity
Unemployment (%)
Unemployment (% change since 2000)
Unemployment (%) - White
Unemployment (%) - Black or African American
Unemployment (%) - Asian
Unemployment (%) - Hispanic or Latino
Unemployment (%) - American Indian and Alaska Native
Unemployment (%) - Multirace
Unemployment (%) - Other Race
Population density (people per square mile)
Population - Males (%)
Population - Females (%)
Population - Males (%) - White
Population - Males (%) - Black or African American
Population - Males (%) - Asian
Population - Males (%) - Hispanic or Latino
Population - Males (%) - American Indian and Alaska Native
Population - Males (%) - Multirace
Population - Males (%) - Other Race
Population - Females (%) - White
Population - Females (%) - Black or African American
Population - Females (%) - Asian
Population - Females (%) - Hispanic or Latino
Population - Females (%) - American Indian and Alaska Native
Population - Females (%) - Multirace
Population - Females (%) - Other Race
Coronavirus confirmed cases (Jun 03, 2024)
Deaths caused by coronavirus (Jun 03, 2024)
Coronavirus confirmed cases (per 100k population) (Jun 03, 2024)
Deaths caused by coronavirus (per 100k population) (Jun 03, 2024)
Daily increase in number of cases (Jun 03, 2024)
Weekly increase in number of cases (Jun 03, 2024)
Cases doubled (in days) (Jun 03, 2024)
Hospitalized patients (Apr 18, 2022)
Negative test results (Apr 18, 2022)
Total test results (Apr 18, 2022)
COVID Vaccine doses distributed (per 100k population) (Sep 19, 2023)
COVID Vaccine doses administered (per 100k population) (Sep 19, 2023)
COVID Vaccine doses distributed (Sep 19, 2023)
COVID Vaccine doses administered (Sep 19, 2023)
Likely homosexual households (%)
Likely homosexual households (% change since 2000)
Likely homosexual households - Lesbian couples (%)
Likely homosexual households - Lesbian couples (% change since 2000)
Likely homosexual households - Gay men (%)
Likely homosexual households - Gay men (% change since 2000)
Cost of living index
Median gross rent ($)
Median contract rent ($)
Median monthly housing costs ($)
Median house or condo value ($)
Median house or condo value ($ change since 2000)
Mean house or condo value by units in structure - 1, detached ($)
Mean house or condo value by units in structure - 1, attached ($)
Mean house or condo value by units in structure - 2 ($)
Mean house or condo value by units in structure by units in structure - 3 or 4 ($)
Mean house or condo value by units in structure - 5 or more ($)
Mean house or condo value by units in structure - Boat, RV, van, etc. ($)
Mean house or condo value by units in structure - Mobile home ($)
Median house or condo value ($) - White
Median house or condo value ($) - Black or African American
Median house or condo value ($) - Asian
Median house or condo value ($) - Hispanic or Latino
Median house or condo value ($) - American Indian and Alaska Native
Median house or condo value ($) - Multirace
Median house or condo value ($) - Other Race
Median resident age
Resident age diversity
Median resident age - Males
Median resident age - Females
Median resident age - White
Median resident age - Black or African American
Median resident age - Asian
Median resident age - Hispanic or Latino
Median resident age - American Indian and Alaska Native
Median resident age - Multirace
Median resident age - Other Race
Median resident age - Males - White
Median resident age - Males - Black or African American
Median resident age - Males - Asian
Median resident age - Males - Hispanic or Latino
Median resident age - Males - American Indian and Alaska Native
Median resident age - Males - Multirace
Median resident age - Males - Other Race
Median resident age - Females - White
Median resident age - Females - Black or African American
Median resident age - Females - Asian
Median resident age - Females - Hispanic or Latino
Median resident age - Females - American Indian and Alaska Native
Median resident age - Females - Multirace
Median resident age - Females - Other Race
Commute - mean travel time to work (minutes)
Travel time to work - Less than 5 minutes (%)
Travel time to work - Less than 5 minutes (% change since 2000)
Travel time to work - 5 to 9 minutes (%)
Travel time to work - 5 to 9 minutes (% change since 2000)
Travel time to work - 10 to 19 minutes (%)
Travel time to work - 10 to 19 minutes (% change since 2000)
Travel time to work - 20 to 29 minutes (%)
Travel time to work - 20 to 29 minutes (% change since 2000)
Travel time to work - 30 to 39 minutes (%)
Travel time to work - 30 to 39 minutes (% change since 2000)
Travel time to work - 40 to 59 minutes (%)
Travel time to work - 40 to 59 minutes (% change since 2000)
Travel time to work - 60 to 89 minutes (%)
Travel time to work - 60 to 89 minutes (% change since 2000)
Travel time to work - 90 or more minutes (%)
Travel time to work - 90 or more minutes (% change since 2000)
Marital status - Never married (%)
Marital status - Now married (%)
Marital status - Separated (%)
Marital status - Widowed (%)
Marital status - Divorced (%)
Median family income ($)
Median family income (% change since 2000)
Median non-family income ($)
Median non-family income (% change since 2000)
Median per capita income ($)
Median per capita income (% change since 2000)
Median family income ($) - White
Median family income ($) - Black or African American
Median family income ($) - Asian
Median family income ($) - Hispanic or Latino
Median family income ($) - American Indian and Alaska Native
Median family income ($) - Multirace
Median family income ($) - Other Race
Median year house/condo built
Median year apartment built
Year house built - Built 2005 or later (%)
Year house built - Built 2000 to 2004 (%)
Year house built - Built 1990 to 1999 (%)
Year house built - Built 1980 to 1989 (%)
Year house built - Built 1970 to 1979 (%)
Year house built - Built 1960 to 1969 (%)
Year house built - Built 1950 to 1959 (%)
Year house built - Built 1940 to 1949 (%)
Year house built - Built 1939 or earlier (%)
Average household size
Household density (households per square mile)
Average household size - White
Average household size - Black or African American
Average household size - Asian
Average household size - Hispanic or Latino
Average household size - American Indian and Alaska Native
Average household size - Multirace
Average household size - Other Race
Occupied housing units (%)
Vacant housing units (%)
Owner occupied housing units (%)
Renter occupied housing units (%)
Vacancy status - For rent (%)
Vacancy status - For sale only (%)
Vacancy status - Rented or sold, not occupied (%)
Vacancy status - For seasonal, recreational, or occasional use (%)
Vacancy status - For migrant workers (%)
Vacancy status - Other vacant (%)
Residents with income below the poverty level (%)
Residents with income below 50% of the poverty level (%)
Children below poverty level (%)
Poor families by family type - Married-couple family (%)
Poor families by family type - Male, no wife present (%)
Poor families by family type - Female, no husband present (%)
Poverty status for native-born residents (%)
Poverty status for foreign-born residents (%)
Poverty among high school graduates not in families (%)
Poverty among people who did not graduate high school not in families (%)
Residents with income below the poverty level (%) - White
Residents with income below the poverty level (%) - Black or African American
Residents with income below the poverty level (%) - Asian
Residents with income below the poverty level (%) - Hispanic or Latino
Residents with income below the poverty level (%) - American Indian and Alaska Native
Residents with income below the poverty level (%) - Multirace
Residents with income below the poverty level (%) - Other Race
Air pollution - Air Quality Index (AQI)
Air pollution - CO
Air pollution - NO2
Air pollution - SO2
Air pollution - Ozone
Air pollution - PM10
Air pollution - PM25
Air pollution - Pb
Crime - Murders per 100,000 population
Crime - Rapes per 100,000 population
Crime - Robberies per 100,000 population
Crime - Assaults per 100,000 population
Crime - Burglaries per 100,000 population
Crime - Thefts per 100,000 population
Crime - Auto thefts per 100,000 population
Crime - Arson per 100,000 population
Crime - City-data.com crime index
Crime - Violent crime index
Crime - Property crime index
Crime - Murders per 100,000 population (5 year average)
Crime - Rapes per 100,000 population (5 year average)
Crime - Robberies per 100,000 population (5 year average)
Crime - Assaults per 100,000 population (5 year average)
Crime - Burglaries per 100,000 population (5 year average)
Crime - Thefts per 100,000 population (5 year average)
Crime - Auto thefts per 100,000 population (5 year average)
Crime - Arson per 100,000 population (5 year average)
Crime - City-data.com crime index (5 year average)
Crime - Violent crime index (5 year average)
Crime - Property crime index (5 year average)
1996 Presidential Elections Results (%) - Democratic Party (Clinton)
1996 Presidential Elections Results (%) - Republican Party (Dole)
1996 Presidential Elections Results (%) - Other
2000 Presidential Elections Results (%) - Democratic Party (Gore)
2000 Presidential Elections Results (%) - Republican Party (Bush)
2000 Presidential Elections Results (%) - Other
2004 Presidential Elections Results (%) - Democratic Party (Kerry)
2004 Presidential Elections Results (%) - Republican Party (Bush)
2004 Presidential Elections Results (%) - Other
2008 Presidential Elections Results (%) - Democratic Party (Obama)
2008 Presidential Elections Results (%) - Republican Party (McCain)
2008 Presidential Elections Results (%) - Other
2012 Presidential Elections Results (%) - Democratic Party (Obama)
2012 Presidential Elections Results (%) - Republican Party (Romney)
2012 Presidential Elections Results (%) - Other
2016 Presidential Elections Results (%) - Democratic Party (Clinton)
2016 Presidential Elections Results (%) - Republican Party (Trump)
2016 Presidential Elections Results (%) - Other
2020 Presidential Elections Results (%) - Democratic Party (Biden)
2020 Presidential Elections Results (%) - Republican Party (Trump)
2020 Presidential Elections Results (%) - Other
Ancestries Reported - Arab (%)
Ancestries Reported - Czech (%)
Ancestries Reported - Danish (%)
Ancestries Reported - Dutch (%)
Ancestries Reported - English (%)
Ancestries Reported - French (%)
Ancestries Reported - French Canadian (%)
Ancestries Reported - German (%)
Ancestries Reported - Greek (%)
Ancestries Reported - Hungarian (%)
Ancestries Reported - Irish (%)
Ancestries Reported - Italian (%)
Ancestries Reported - Lithuanian (%)
Ancestries Reported - Norwegian (%)
Ancestries Reported - Polish (%)
Ancestries Reported - Portuguese (%)
Ancestries Reported - Russian (%)
Ancestries Reported - Scotch-Irish (%)
Ancestries Reported - Scottish (%)
Ancestries Reported - Slovak (%)
Ancestries Reported - Subsaharan African (%)
Ancestries Reported - Swedish (%)
Ancestries Reported - Swiss (%)
Ancestries Reported - Ukrainian (%)
Ancestries Reported - United States (%)
Ancestries Reported - Welsh (%)
Ancestries Reported - West Indian (%)
Ancestries Reported - Other (%)
Educational Attainment - No schooling completed (%)
Educational Attainment - Less than high school (%)
Educational Attainment - High school or equivalent (%)
Educational Attainment - Less than 1 year of college (%)
Educational Attainment - 1 or more years of college (%)
Educational Attainment - Associate degree (%)
Educational Attainment - Bachelor's degree (%)
Educational Attainment - Master's degree (%)
Educational Attainment - Professional school degree (%)
Educational Attainment - Doctorate degree (%)
School Enrollment - Nursery, preschool (%)
School Enrollment - Kindergarten (%)
School Enrollment - Grade 1 to 4 (%)
School Enrollment - Grade 5 to 8 (%)
School Enrollment - Grade 9 to 12 (%)
School Enrollment - College undergrad (%)
School Enrollment - Graduate or professional (%)
School Enrollment - Not enrolled in school (%)
School enrollment - Public schools (%)
School enrollment - Private schools (%)
School enrollment - Not enrolled (%)
Median number of rooms in houses and condos
Median number of rooms in apartments
Housing units lacking complete plumbing facilities (%)
Housing units lacking complete kitchen facilities (%)
Density of houses
Urban houses (%)
Rural houses (%)
Households with people 60 years and over (%)
Households with people 65 years and over (%)
Households with people 75 years and over (%)
Households with one or more nonrelatives (%)
Households with no nonrelatives (%)
Population in households (%)
Family households (%)
Nonfamily households (%)
Population in families (%)
Family households with own children (%)
Median number of bedrooms in owner occupied houses
Mean number of bedrooms in owner occupied houses
Median number of bedrooms in renter occupied houses
Mean number of bedrooms in renter occupied houses
Median number of vehichles in owner occupied houses
Mean number of vehichles in owner occupied houses
Median number of vehichles in renter occupied houses
Mean number of vehichles in renter occupied houses
Mortgage status - with mortgage (%)
Mortgage status - with second mortgage (%)
Mortgage status - with home equity loan (%)
Mortgage status - with both second mortgage and home equity loan (%)
Mortgage status - without a mortgage (%)
Average family size
Average family size - White
Average family size - Black or African American
Average family size - Asian
Average family size - Hispanic or Latino
Average family size - American Indian and Alaska Native
Average family size - Multirace
Average family size - Other Race
Geographical mobility - Same house 1 year ago (%)
Geographical mobility - Moved within same county (%)
Geographical mobility - Moved from different county within same state (%)
Geographical mobility - Moved from different state (%)
Geographical mobility - Moved from abroad (%)
Place of birth - Born in state of residence (%)
Place of birth - Born in other state (%)
Place of birth - Native, outside of US (%)
Place of birth - Foreign born (%)
Housing units in structures - 1, detached (%)
Housing units in structures - 1, attached (%)
Housing units in structures - 2 (%)
Housing units in structures - 3 or 4 (%)
Housing units in structures - 5 to 9 (%)
Housing units in structures - 10 to 19 (%)
Housing units in structures - 20 to 49 (%)
Housing units in structures - 50 or more (%)
Housing units in structures - Mobile home (%)
Housing units in structures - Boat, RV, van, etc. (%)
House/condo owner moved in on average (years ago)
Renter moved in on average (years ago)
Year householder moved into unit - Moved in 1999 to March 2000 (%)
Year householder moved into unit - Moved in 1995 to 1998 (%)
Year householder moved into unit - Moved in 1990 to 1994 (%)
Year householder moved into unit - Moved in 1980 to 1989 (%)
Year householder moved into unit - Moved in 1970 to 1979 (%)
Year householder moved into unit - Moved in 1969 or earlier (%)
Means of transportation to work - Drove car alone (%)
Means of transportation to work - Carpooled (%)
Means of transportation to work - Public transportation (%)
Means of transportation to work - Bus or trolley bus (%)
Means of transportation to work - Streetcar or trolley car (%)
Means of transportation to work - Subway or elevated (%)
Means of transportation to work - Railroad (%)
Means of transportation to work - Ferryboat (%)
Means of transportation to work - Taxicab (%)
Means of transportation to work - Motorcycle (%)
Means of transportation to work - Bicycle (%)
Means of transportation to work - Walked (%)
Means of transportation to work - Other means (%)
Working at home (%)
Industry diversity
Most Common Industries - Agriculture, forestry, fishing and hunting, and mining (%)
Most Common Industries - Agriculture, forestry, fishing and hunting (%)
Most Common Industries - Mining, quarrying, and oil and gas extraction (%)
Most Common Industries - Construction (%)
Most Common Industries - Manufacturing (%)
Most Common Industries - Wholesale trade (%)
Most Common Industries - Retail trade (%)
Most Common Industries - Transportation and warehousing, and utilities (%)
Most Common Industries - Transportation and warehousing (%)
Most Common Industries - Utilities (%)
Most Common Industries - Information (%)
Most Common Industries - Finance and insurance, and real estate and rental and leasing (%)
Most Common Industries - Finance and insurance (%)
Most Common Industries - Real estate and rental and leasing (%)
Most Common Industries - Professional, scientific, and management, and administrative and waste management services (%)
Most Common Industries - Professional, scientific, and technical services (%)
Most Common Industries - Management of companies and enterprises (%)
Most Common Industries - Administrative and support and waste management services (%)
Most Common Industries - Educational services, and health care and social assistance (%)
Most Common Industries - Educational services (%)
Most Common Industries - Health care and social assistance (%)
Most Common Industries - Arts, entertainment, and recreation, and accommodation and food services (%)
Most Common Industries - Arts, entertainment, and recreation (%)
Most Common Industries - Accommodation and food services (%)
Most Common Industries - Other services, except public administration (%)
Most Common Industries - Public administration (%)
Occupation diversity
Most Common Occupations - Management, business, science, and arts occupations (%)
Most Common Occupations - Management, business, and financial occupations (%)
Most Common Occupations - Management occupations (%)
Most Common Occupations - Business and financial operations occupations (%)
Most Common Occupations - Computer, engineering, and science occupations (%)
Most Common Occupations - Computer and mathematical occupations (%)
Most Common Occupations - Architecture and engineering occupations (%)
Most Common Occupations - Life, physical, and social science occupations (%)
Most Common Occupations - Education, legal, community service, arts, and media occupations (%)
Most Common Occupations - Community and social service occupations (%)
Most Common Occupations - Legal occupations (%)
Most Common Occupations - Education, training, and library occupations (%)
Most Common Occupations - Arts, design, entertainment, sports, and media occupations (%)
Most Common Occupations - Healthcare practitioners and technical occupations (%)
Most Common Occupations - Health diagnosing and treating practitioners and other technical occupations (%)
Most Common Occupations - Health technologists and technicians (%)
Most Common Occupations - Service occupations (%)
Most Common Occupations - Healthcare support occupations (%)
Most Common Occupations - Protective service occupations (%)
Most Common Occupations - Fire fighting and prevention, and other protective service workers including supervisors (%)
Most Common Occupations - Law enforcement workers including supervisors (%)
Most Common Occupations - Food preparation and serving related occupations (%)
Most Common Occupations - Building and grounds cleaning and maintenance occupations (%)
Most Common Occupations - Personal care and service occupations (%)
Most Common Occupations - Sales and office occupations (%)
Most Common Occupations - Sales and related occupations (%)
Most Common Occupations - Office and administrative support occupations (%)
Most Common Occupations - Natural resources, construction, and maintenance occupations (%)
Most Common Occupations - Farming, fishing, and forestry occupations (%)
Most Common Occupations - Construction and extraction occupations (%)
Most Common Occupations - Installation, maintenance, and repair occupations (%)
Most Common Occupations - Production, transportation, and material moving occupations (%)
Most Common Occupations - Production occupations (%)
Most Common Occupations - Transportation occupations (%)
Most Common Occupations - Material moving occupations (%)
People in Group quarters - Institutionalized population (%)
People in Group quarters - Correctional institutions (%)
People in Group quarters - Federal prisons and detention centers (%)
People in Group quarters - Halfway houses (%)
People in Group quarters - Local jails and other confinement facilities (including police lockups) (%)
People in Group quarters - Military disciplinary barracks (%)
People in Group quarters - State prisons (%)
People in Group quarters - Other types of correctional institutions (%)
People in Group quarters - Nursing homes (%)
People in Group quarters - Hospitals/wards, hospices, and schools for the handicapped (%)
People in Group quarters - Hospitals/wards and hospices for chronically ill (%)
People in Group quarters - Hospices or homes for chronically ill (%)
People in Group quarters - Military hospitals or wards for chronically ill (%)
People in Group quarters - Other hospitals or wards for chronically ill (%)
People in Group quarters - Hospitals or wards for drug/alcohol abuse (%)
People in Group quarters - Mental (Psychiatric) hospitals or wards (%)
People in Group quarters - Schools, hospitals, or wards for the mentally retarded (%)
People in Group quarters - Schools, hospitals, or wards for the physically handicapped (%)
People in Group quarters - Institutions for the deaf (%)
People in Group quarters - Institutions for the blind (%)
People in Group quarters - Orthopedic wards and institutions for the physically handicapped (%)
People in Group quarters - Wards in general hospitals for patients who have no usual home elsewhere (%)
People in Group quarters - Wards in military hospitals for patients who have no usual home elsewhere (%)
People in Group quarters - Juvenile institutions (%)
People in Group quarters - Long-term care (%)
People in Group quarters - Homes for abused, dependent, and neglected children (%)
People in Group quarters - Residential treatment centers for emotionally disturbed children (%)
People in Group quarters - Training schools for juvenile delinquents (%)
People in Group quarters - Short-term care, detention or diagnostic centers for delinquent children (%)
People in Group quarters - Type of juvenile institution unknown (%)
People in Group quarters - Noninstitutionalized population (%)
People in Group quarters - College dormitories (includes college quarters off campus) (%)
People in Group quarters - Military quarters (%)
People in Group quarters - On base (%)
People in Group quarters - Barracks, unaccompanied personnel housing (UPH), (Enlisted/Officer), ;and similar group living quarters for military personnel (%)
People in Group quarters - Transient quarters for temporary residents (%)
People in Group quarters - Military ships (%)
People in Group quarters - Group homes (%)
People in Group quarters - Homes or halfway houses for drug/alcohol abuse (%)
People in Group quarters - Homes for the mentally ill (%)
People in Group quarters - Homes for the mentally retarded (%)
People in Group quarters - Homes for the physically handicapped (%)
People in Group quarters - Other group homes (%)
People in Group quarters - Religious group quarters (%)
People in Group quarters - Dormitories (%)
People in Group quarters - Agriculture workers' dormitories on farms (%)
People in Group quarters - Job Corps and vocational training facilities (%)
People in Group quarters - Other workers' dormitories (%)
People in Group quarters - Crews of maritime vessels (%)
People in Group quarters - Other nonhousehold living situations (%)
People in Group quarters - Other noninstitutional group quarters (%)
Residents speaking English at home (%)
Residents speaking English at home - Born in the United States (%)
Residents speaking English at home - Native, born elsewhere (%)
Residents speaking English at home - Foreign born (%)
Residents speaking Spanish at home (%)
Residents speaking Spanish at home - Born in the United States (%)
Residents speaking Spanish at home - Native, born elsewhere (%)
Residents speaking Spanish at home - Foreign born (%)
Residents speaking other language at home (%)
Residents speaking other language at home - Born in the United States (%)
Residents speaking other language at home - Native, born elsewhere (%)
Residents speaking other language at home - Foreign born (%)
Class of Workers - Employee of private company (%)
Class of Workers - Self-employed in own incorporated business (%)
Class of Workers - Private not-for-profit wage and salary workers (%)
Class of Workers - Local government workers (%)
Class of Workers - State government workers (%)
Class of Workers - Federal government workers (%)
Class of Workers - Self-employed workers in own not incorporated business and Unpaid family workers (%)
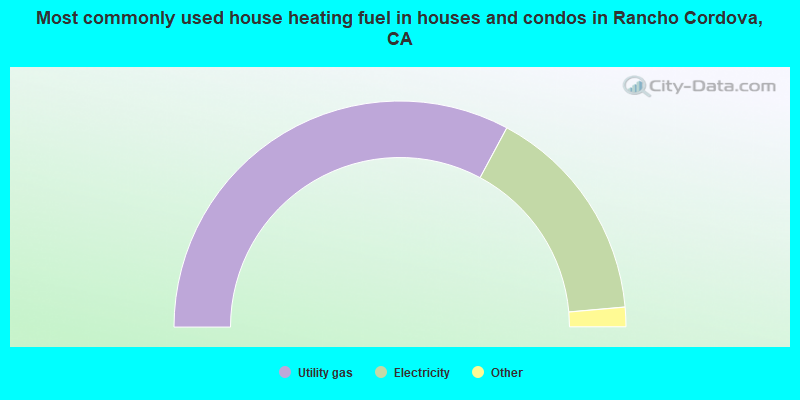
House heating fuel used in houses and condos - Utility gas (%)
House heating fuel used in houses and condos - Bottled, tank, or LP gas (%)
House heating fuel used in houses and condos - Electricity (%)
House heating fuel used in houses and condos - Fuel oil, kerosene, etc. (%)
House heating fuel used in houses and condos - Coal or coke (%)
House heating fuel used in houses and condos - Wood (%)
House heating fuel used in houses and condos - Solar energy (%)
House heating fuel used in houses and condos - Other fuel (%)
House heating fuel used in houses and condos - No fuel used (%)
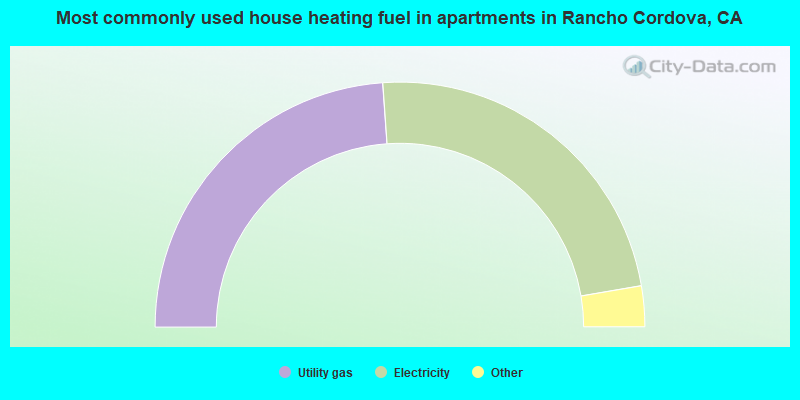
House heating fuel used in apartments - Utility gas (%)
House heating fuel used in apartments - Bottled, tank, or LP gas (%)
House heating fuel used in apartments - Electricity (%)
House heating fuel used in apartments - Fuel oil, kerosene, etc. (%)
House heating fuel used in apartments - Coal or coke (%)
House heating fuel used in apartments - Wood (%)
House heating fuel used in apartments - Solar energy (%)
House heating fuel used in apartments - Other fuel (%)
House heating fuel used in apartments - No fuel used (%)
Armed forces status - In Armed Forces (%)
Armed forces status - Civilian (%)
Armed forces status - Civilian - Veteran (%)
Armed forces status - Civilian - Nonveteran (%)
Fatal accidents locations in years 2005-2021
Fatal accidents locations in 2005
Fatal accidents locations in 2006
Fatal accidents locations in 2007
Fatal accidents locations in 2008
Fatal accidents locations in 2009
Fatal accidents locations in 2010
Fatal accidents locations in 2011
Fatal accidents locations in 2012
Fatal accidents locations in 2013
Fatal accidents locations in 2014
Fatal accidents locations in 2015
Fatal accidents locations in 2016
Fatal accidents locations in 2017
Fatal accidents locations in 2018
Fatal accidents locations in 2019
Fatal accidents locations in 2020
Fatal accidents locations in 2021
Alcohol use - People drinking some alcohol every month (%)
Alcohol use - People not drinking at all (%)
Alcohol use - Average days/month drinking alcohol
Alcohol use - Average drinks/week
Alcohol use - Average days/year people drink much
Audiometry - Average condition of hearing (%)
Audiometry - People that can hear a whisper from across a quiet room (%)
Audiometry - People that can hear normal voice from across a quiet room (%)
Audiometry - Ears ringing, roaring, buzzing (%)
Audiometry - Had a job exposure to loud noise (%)
Audiometry - Had off-work exposure to loud noise (%)
Blood Pressure & Cholesterol - Has high blood pressure (%)
Blood Pressure & Cholesterol - Checking blood pressure at home (%)
Blood Pressure & Cholesterol - Frequently checking blood cholesterol (%)
Blood Pressure & Cholesterol - Has high cholesterol level (%)
Consumer Behavior - Money monthly spent on food at supermarket/grocery store
Consumer Behavior - Money monthly spent on food at other stores
Consumer Behavior - Money monthly spent on eating out
Consumer Behavior - Money monthly spent on carryout/delivered foods
Consumer Behavior - Income spent on food at supermarket/grocery store (%)
Consumer Behavior - Income spent on food at other stores (%)
Consumer Behavior - Income spent on eating out (%)
Consumer Behavior - Income spent on carryout/delivered foods (%)
Current Health Status - General health condition (%)
Current Health Status - Blood donors (%)
Current Health Status - Has blood ever tested for HIV virus (%)
Current Health Status - Left-handed people (%)
Dermatology - People using sunscreen (%)
Diabetes - Diabetics (%)
Diabetes - Had a blood test for high blood sugar (%)
Diabetes - People taking insulin (%)
Diet Behavior & Nutrition - Diet health (%)
Diet Behavior & Nutrition - Milk product consumption (# of products/month)
Diet Behavior & Nutrition - Meals not home prepared (#/week)
Diet Behavior & Nutrition - Meals from fast food or pizza place (#/week)
Diet Behavior & Nutrition - Ready-to-eat foods (#/month)
Diet Behavior & Nutrition - Frozen meals/pizza (#/month)
Drug Use - People that ever used marijuana or hashish (%)
Drug Use - Ever used hard drugs (%)
Drug Use - Ever used any form of cocaine (%)
Drug Use - Ever used heroin (%)
Drug Use - Ever used methamphetamine (%)
Health Insurance - People covered by health insurance (%)
Kidney Conditions-Urology - Avg. # of times urinating at night
Medical Conditions - People with asthma (%)
Medical Conditions - People with anemia (%)
Medical Conditions - People with psoriasis (%)
Medical Conditions - People with overweight (%)
Medical Conditions - Elderly people having difficulties in thinking or remembering (%)
Medical Conditions - People who ever received blood transfusion (%)
Medical Conditions - People having trouble seeing even with glass/contacts (%)
Medical Conditions - People with arthritis (%)
Medical Conditions - People with gout (%)
Medical Conditions - People with congestive heart failure (%)
Medical Conditions - People with coronary heart disease (%)
Medical Conditions - People with angina pectoris (%)
Medical Conditions - People who ever had heart attack (%)
Medical Conditions - People who ever had stroke (%)
Medical Conditions - People with emphysema (%)
Medical Conditions - People with thyroid problem (%)
Medical Conditions - People with chronic bronchitis (%)
Medical Conditions - People with any liver condition (%)
Medical Conditions - People who ever had cancer or malignancy (%)
Mental Health - People who have little interest in doing things (%)
Mental Health - People feeling down, depressed, or hopeless (%)
Mental Health - People who have trouble sleeping or sleeping too much (%)
Mental Health - People feeling tired or having little energy (%)
Mental Health - People with poor appetite or overeating (%)
Mental Health - People feeling bad about themself (%)
Mental Health - People who have trouble concentrating on things (%)
Mental Health - People moving or speaking slowly or too fast (%)
Mental Health - People having thoughts they would be better off dead (%)
Oral Health - Average years since last visit a dentist
Oral Health - People embarrassed because of mouth (%)
Oral Health - People with gum disease (%)
Oral Health - General health of teeth and gums (%)
Oral Health - Average days a week using dental floss/device
Oral Health - Average days a week using mouthwash for dental problem
Oral Health - Average number of teeth
Pesticide Use - Households using pesticides to control insects (%)
Pesticide Use - Households using pesticides to kill weeds (%)
Physical Activity - People doing vigorous-intensity work activities (%)
Physical Activity - People doing moderate-intensity work activities (%)
Physical Activity - People walking or bicycling (%)
Physical Activity - People doing vigorous-intensity recreational activities (%)
Physical Activity - People doing moderate-intensity recreational activities (%)
Physical Activity - Average hours a day doing sedentary activities
Physical Activity - Average hours a day watching TV or videos
Physical Activity - Average hours a day using computer
Physical Functioning - People having limitations keeping them from working (%)
Physical Functioning - People limited in amount of work they can do (%)
Physical Functioning - People that need special equipment to walk (%)
Physical Functioning - People experiencing confusion/memory problems (%)
Physical Functioning - People requiring special healthcare equipment (%)
Prescription Medications - Average number of prescription medicines taking
Preventive Aspirin Use - Adults 40+ taking low-dose aspirin (%)
Reproductive Health - Vaginal deliveries (%)
Reproductive Health - Cesarean deliveries (%)
Reproductive Health - Deliveries resulted in a live birth (%)
Reproductive Health - Pregnancies resulted in a delivery (%)
Reproductive Health - Women breastfeeding newborns (%)
Reproductive Health - Women that had a hysterectomy (%)
Reproductive Health - Women that had both ovaries removed (%)
Reproductive Health - Women that have ever taken birth control pills (%)
Reproductive Health - Women taking birth control pills (%)
Reproductive Health - Women that have ever used Depo-Provera or injectables (%)
Reproductive Health - Women that have ever used female hormones (%)
Sexual Behavior - People 18+ that ever had sex (vaginal, anal, or oral) (%)
Sexual Behavior - Males 18+ that ever had vaginal sex with a woman (%)
Sexual Behavior - Males 18+ that ever performed oral sex on a woman (%)
Sexual Behavior - Males 18+ that ever had anal sex with a woman (%)
Sexual Behavior - Males 18+ that ever had any sex with a man (%)
Sexual Behavior - Females 18+ that ever had vaginal sex with a man (%)
Sexual Behavior - Females 18+ that ever performed oral sex on a man (%)
Sexual Behavior - Females 18+ that ever had anal sex with a man (%)
Sexual Behavior - Females 18+ that ever had any kind of sex with a woman (%)
Sexual Behavior - Average age people first had sex
Sexual Behavior - Average number of female sex partners in lifetime (males 18+)
Sexual Behavior - Average number of female vaginal sex partners in lifetime (males 18+)
Sexual Behavior - Average age people first performed oral sex on a woman (18+)
Sexual Behavior - Average number of woman performed oral sex on in lifetime (18+)
Sexual Behavior - Average number of male sex partners in lifetime (males 18+)
Sexual Behavior - Average number of male anal sex partners in lifetime (males 18+)
Sexual Behavior - Average age people first performed oral sex on a man (18+)
Sexual Behavior - Average number of male oral sex partners in lifetime (18+)
Sexual Behavior - People using protection when performing oral sex (%)
Sexual Behavior - Average number of times people have vaginal or anal sex a year
Sexual Behavior - People having sex without condom (%)
Sexual Behavior - Average number of male sex partners in lifetime (females 18+)
Sexual Behavior - Average number of male vaginal sex partners in lifetime (females 18+)
Sexual Behavior - Average number of female sex partners in lifetime (females 18+)
Sexual Behavior - Circumcised males 18+ (%)
Sleep Disorders - Average hours sleeping at night
Sleep Disorders - People that has trouble sleeping (%)
Smoking-Cigarette Use - People smoking cigarettes (%)
Taste & Smell - People 40+ having problems with smell (%)
Taste & Smell - People 40+ having problems with taste (%)
Taste & Smell - People 40+ that ever had wisdom teeth removed (%)
Taste & Smell - People 40+ that ever had tonsils teeth removed (%)
Taste & Smell - People 40+ that ever had a loss of consciousness because of a head injury (%)
Taste & Smell - People 40+ that ever had a broken nose or other serious injury to face or skull (%)
Taste & Smell - People 40+ that ever had two or more sinus infections (%)
Weight - Average height (inches)
Weight - Average weight (pounds)
Weight - Average BMI
Weight - People that are obese (%)
Weight - People that ever were obese (%)
Weight - People trying to lose weight (%)
39,838 49.4% White alone 16,284 20.2% Hispanic 12,481 15.5% Asian alone 5,087 6.3% Black alone 4,326 5.4% Two or more races 1,562 1.9% Native Hawaiian and Other 674 0.8% American Indian alone 342 0.4% Other race alone
The City-Data.com crime index weighs serious crimes and violent crimes more heavily. Higher means more crime, U.S. average is 246.1. It adjusts for the number of visitors and daily workers commuting into cities.
- means the value is smaller than the state average.
- means the value is about the same as the state average.
- means the value is bigger than the state average.
- means the value is much bigger than the state average.
Crime rate in Rancho Cordova detailed stats: murders, rapes, robberies, assaults, burglaries, thefts, arson Officers per 1,000 residents here:
0.01California average:
1.98
Latest news from Rancho Cordova, CA collected exclusively by city-data.com from local newspapers, TV, and radio stations
Ancestries: American (6.0%), Armenian (4.9%), Ukrainian (4.0%), English (3.1%), German (2.8%), Russian (2.5%).
Current Local Time:
Land area: 22.5 square miles.
Population density: 3,580 people per square mile (average).
19,337 residents are foreign born (12.0% Asia , 5.9% Latin America , 5.0% Europe ).
This place:
24.4%California:
26.5%
Median real estate property taxes paid for housing units with mortgages in 2022: $5,073 (1.0%)Median real estate property taxes paid for housing units with no mortgage in 2022: $2,420 (0.7%)
Nearest city with pop. 200,000+: Sacramento, CA
Nearest city with pop. 1,000,000+: Los Angeles, CA
Nearest cities:
Latitude: 38.59 N, Longitude: 121.30 W
Daytime population change due to commuting: +8,066 (+10.0%)Workers who live and work in this place: 16,663 (43.4%)
Single-family new house construction building permits:
2022: 618 buildings , average cost: $301,1002021: 552 buildings , average cost: $310,1002020: 572 buildings , average cost: $287,5002019: 561 buildings , average cost: $279,0002018: 217 buildings , average cost: $291,0002017: 217 buildings , average cost: $287,4002016: 326 buildings , average cost: $294,4002015: 403 buildings , average cost: $271,6002014: 166 buildings , average cost: $303,9002013: 329 buildings , average cost: $290,6002012: 215 buildings , average cost: $254,2002011: 148 buildings , average cost: $270,6002010: 187 buildings , average cost: $260,6002009: 305 buildings , average cost: $226,7002008: 377 buildings , average cost: $179,7002007: 573 buildings , average cost: $252,5002006: 509 buildings , average cost: $270,7002005: 1633 buildings , average cost: $230,0002004: 454 buildings , average cost: $188,100Unemployment in December 2023:
Most common occupations in Rancho Cordova, CA (%)
Both Males Females
Other office and administrative support workers, including supervisors (7.9%)
Building and grounds cleaning and maintenance occupations (4.7%)
Other management occupations, except farmers and farm managers (4.0%)
Computer specialists (4.0%)
Other sales and related occupations, including supervisors (3.4%)
Retail sales workers, except cashiers (3.0%)
Information and record clerks, except customer service representatives (3.0%)
Building and grounds cleaning and maintenance occupations (6.3%)
Computer specialists (5.6%)
Other management occupations, except farmers and farm managers (4.5%)
Other sales and related occupations, including supervisors (4.3%)
Electrical equipment mechanics and other installation, maintenance, and repair workers, including supervisors (3.9%)
Material recording, scheduling, dispatching, and distributing workers (3.9%)
Other production occupations, including supervisors (3.8%)
Other office and administrative support workers, including supervisors (12.8%)
Secretaries and administrative assistants (5.9%)
Information and record clerks, except customer service representatives (4.7%)
Other management occupations, except farmers and farm managers (3.6%)
Customer service representatives (3.4%)
Bookkeeping, accounting, and auditing clerks (3.0%)
Building and grounds cleaning and maintenance occupations (3.0%)
Earthquake activity:
Rancho Cordova-area historical earthquake activity is significantly above California state average. It is 7697% greater than the overall U.S. average. On 4/18/1906 at 13:12:21, a magnitude 7.9 (7.9 UK, Class: Major, Intensity: VIII - XII) earthquake occurred 100.9 miles away from Rancho Cordova center, causing $524,000,000 total damage On 10/18/1989 at 00:04:15, a magnitude 7.1 (6.5 MB, 7.1 MS, 6.9 MW, 7.0 ML) earthquake occurred 105.2 miles away from the city center, causing 62 deaths ( 62 shaking deaths) and 3757 injuries, causing $1,305,032,704 total damage On 10/3/1915 at 06:52:48, a magnitude 7.6 (7.6 UK) earthquake occurred 242.0 miles away from Rancho Cordova center On 7/21/1952 at 11:52:14, a magnitude 7.7 (7.7 UK) earthquake occurred 278.7 miles away from the city center, causing $50,000,000 total damage On 12/21/1932 at 06:10:09, a magnitude 7.2 (7.2 UK) earthquake occurred 173.9 miles away from Rancho Cordova center On 1/31/1922 at 13:17:28, a magnitude 7.6 (7.6 UK) earthquake occurred 269.7 miles away from the city center Magnitude types: body-wave magnitude (MB), local magnitude (ML), surface-wave magnitude (MS), moment magnitude (MW) Natural disasters: The number of natural disasters in Sacramento County (18) is near the US average (15).Major Disasters (Presidential) Declared: 11Emergencies Declared: 3Floods: 13, Winter Storms: 6, Storms: 5, Mudslides: 4, Landslides: 3, Drought: 1, Earthquake: 1, Heavy Rain: 1, Hurricane: 1, Tornado: 1, Wind: 1, Other: 1 (Note: some incidents may be assigned to more than one category). Main business address for: THERMOGENESIS CORP LABORATORY APPARATUS & FURNITURE ), GENCORP INC FABRICATED RUBBER PRODUCTS, NEC ).
Hospitals and medical centers in Rancho Cordova: CASA COLOMA HLTH CARE CENTER (10410 COLOMA RD)
SUNSET DIALYSIS CENTER (3071 GOLD CANAL DRIVE)
ACCENTCARE HOME HEALTH OF CALIFORNIA, INC (2880 SUNRISE BLVD SUITE 218)
Amtrak station: RANCHO CORDOVA (10369 FOLSOM BLVD.) - Bus Station
.
Services: fully wheelchair accessible, free short-term parking, public transit connection.
Colleges/Universities in Rancho Cordova: Heald College-Rancho Cordova Full-time enrollment: 1,444; Location: 2910 Prospect Park Dr; Private, for-profit; Website: www.heald.edu)
ITT Technical Institute-Rancho Cordova Full-time enrollment: 574; Location: 10863 Gold Center Dr; Private, for-profit; Website: www.itt-tech.edu)
San Joaquin Valley College-Rancho Cordova Full-time enrollment: 216; Location: 11050 Olson Dr Ste 100; Private, for-profit; Website: www.sjvc.edu)
National Career Education Full-time enrollment: 104; Location: 11080 White Rock Rd., Suite 100; Private, for-profit; Website: www.nceschool.com)
Colleges/universities with over 2000 students nearest to Rancho Cordova:
American River College (about 6 miles; Sacramento, CA ; Full-time enrollment: 20,452)
California State University-Sacramento (about 8 miles; Sacramento, CA ; FT enrollment: 22,234)
Folsom Lake College (about 11 miles; Folsom, CA ; FT enrollment: 5,308)
Sacramento City College (about 11 miles; Sacramento, CA ; FT enrollment: 15,963)
Cosumnes River College (about 12 miles; Sacramento, CA ; FT enrollment: 9,327)
University of Phoenix-Sacramento Valley Campus (about 13 miles; Sacramento, CA ; FT enrollment: 2,855)
Universal Technical Institute of Northern California Inc (about 14 miles; Sacramento, CA ; FT enrollment: 3,193)
Public high schools in Rancho Cordova:
Private high school in Rancho Cordova: IHS CHRISTIAN SCHOOL Students: 104, Location: 11111 MORGAN RIVER CT, Grades: 1-12)
Biggest public elementary/middle schools in Rancho Cordova: MILLS MIDDLE Students: 785, Location: 10439 COLOMA RD., Grades: 6-8)W. E. MITCHELL MIDDLE Students: 735, Location: 2100 ZINFANDEL DR., Grades: 6-8)WHITE ROCK ELEMENTARY Students: 274, Location: 10487 WHITE ROCK RD., Grades: KG-6)RANCHO CORDOVA ELEMENTARY Students: 270, Location: 2562 CHASSELLA WAY, Grades: KG-6)WILLIAMSON ELEMENTARY Students: 222, Location: 2275 BENITA WAY, Grades: KG-5)CORDOVA MEADOWS ELEMENTARY Students: 217, Location: 2550 LA LOMA DR., Grades: KG-5)NAVIGATOR ELEMENTARY Students: 205, Location: 10679 BEAR HOLLOW DR., Grades: KG-5)CORDOVA GARDENS ELEMENTARY Students: 203, Location: 2400 DAWES ST., Grades: KG-6)CORDOVA VILLA ELEMENTARY Students: 193, Location: 10359 S. WHITE ROCK RD., Grades: KG-5)PETER J. SHIELDS ELEMENTARY Students: 143, Location: 10434 GEORGETOWN DR., Grades: KG-5)Private elementary/middle schools in Rancho Cordova: ST JOHN VIANNEY Students: 229, Location: 10499 COLOMA RD, Grades: KG-8)
CCHAT CENTER-SACRAMENTO Students: 54, Location: 11100 COLOMA RD, Grades: PK-1)
See full list of schools located in Rancho Cordova User-submitted facts and corrections:
add to private schools in Rancho Cordova: First Covenant Preschool, 10933 Progress Court, Rancho Cordova, 95670 www.firstcov.org 916-861-2240
Notable locations in Rancho Cordova: (A) , Mather Golf Course (B) , First Responder Emergency Medical Services (C) , California Governor Office of Emergency Services Fire and Rescue (D) , Sacramento County Office of Education (E) , Rancho Cordova Community Library (F) , Sacramento County Airport System Fire Department Station 97 (G) , Sacramento Metropolitan Fire District Station 66 (H) , Sacramento Metropolitan Fire District Station 61 (I) , Rancho Cordova Police Station (J) , Rancho Cordova City Hall (K) , California State Office of Emergency Services (L) . Display/hide their locations on the map
Shopping Centers: (1) , Rancho Plaza Shopping Center (2) , Zinfandel Square Shopping Center (3) , Plaza Shopping Center (4) , Mills Center Shopping Center (5) , Folsom-Mather Shopping Center (6) , Farmers Center Shopping Center (7) , Cordova Village Shopping Center (8) . Display/hide their locations on the map
Main business address in Rancho Cordova: (A) . Display/hide its location on the map
Churches in Rancho Cordova include: (A) , Center of Praise Church (B) , Cordova Lutheran Church (C) , Mount Zion Church of God in Christ (D) , Union Gospel Mission Womens Ministries (E) , Church of Christ (F) , Cordova Baptist Church (G) , Cordova Neighborhood Church (H) , Cordova Presbyterian Church (I) . Display/hide their locations on the map
Cemetery: (1) . Display/hide its location on the map
Reservoir: (A) . Display/hide its location on the map
Parks in Rancho Cordova include: (1) , Lower Sunrise Recreational Area (2) , Goethe Park (3) , Countryside Park (4) , Mills Park (5) , Whiterock Park (6) , Ahlstron Park (7) , Community Park Number 2 (8) , Hogan Community Park (9) . Display/hide their locations on the map
Hotels: (1) , Best Western The Venetian Ct (11269 Point East Drive) (2) , Amerisuites Rancho Cordova (10744 Gold Center Dr) (3) , Best Western Heritage Inn at Rancho Cordova (11269 Point East Drive) (4) , AmeriSuites Sacramento / Rancho Cordova (10744 Gold Center Drive) (5) . Display/hide their approximate locations on the map
Birthplace of: Ross Clifton - Martial artist.
Sacramento County has a predicted average indoor radon screening level less than 2 pCi/L (pico curies per liter) - Low Potential Drinking water stations with addresses in Rancho Cordova and their reported violations in the past:
PRAIRIE CITY SVRA (Population served: 18,000, Groundwater):
Past monitoring violations:
One minor monitoring violation
Drinking water stations with addresses in Rancho Cordova that have no violations reported:
CORDOVA SHOOTING CENTER (Population served: 50, Primary Water Source Type: Groundwater)
Average household size: This place:
2.8 peopleCalifornia:
2.9 people
Percentage of family households: This place:
67.2%Whole state:
68.7%
Percentage of households with unmarried partners: This place:
8.3%Whole state:
7.2%
Likely homosexual households (counted as self-reported same-sex unmarried-partner households)
Lesbian couples: 0.5% of all households Gay men: 0.3% of all households
People in group quarters in Rancho Cordova in 2010:
143 people in nursing facilities/skilled-nursing facilities
96 people in group homes intended for adults
43 people in workers' group living quarters and job corps centers
17 people in other noninstitutional facilities
14 people in residential treatment centers for adults
12 people in residential treatment centers for juveniles (non-correctional)
People in group quarters in Rancho Cordova in 2000:
138 people in nursing homes
138 people in other noninstitutional group quarters
30 people in homes or halfway houses for drug/alcohol abuse
25 people in homes for the mentally retarded
23 people in hospitals/wards and hospices for chronically ill
23 people in hospices or homes for chronically ill
21 people in other nonhousehold living situations
20 people in homes for the mentally ill
17 people in other group homes
15 people in short-term care, detention or diagnostic centers for delinquent children
4 people in homes for the physically handicapped
Banks with most branches in Rancho Cordova (2011 data):
U.S. Bank National Association: Rancho Cordova Branch, Folsom Boulevard Safeway Branch, Rancho Cordova Zinfandel Branch. Info updated 2012/01/30: Bank assets: $330,470.8 mil, Deposits: $236,091.5 mil, headquarters in Cincinnati, OH, positive income , 3121 total offices , Holding Company: U.S. Bancorp
Bank of America, National Association: Cordova Plaza Branch at 10607 Folson Boulevard, branch established on 1956/12/21; Gold River Marketplace Branch at 2155 Golden Centre Lane, branch established on 1993/12/08. Info updated 2009/11/18: Bank assets: $1,451,969.3 mil, Deposits: $1,077,176.8 mil, headquarters in Charlotte, NC, positive income , 5782 total offices , Holding Company: Bank Of America Corporation
First Bank: Rancho Cordova Branch at 2880 Sunrise Boulevard, branch established on 1997/07/21. Info updated 2007/12/04: Bank assets: $6,579.8 mil, Deposits: $5,800.6 mil, headquarters in Creve Coeur, MO, negative income in the last year , Commercial Lending Specialization, 148 total offices , Holding Company: First Banks, Inc.
Five Star Bank: Rancho Cordova Branch at 3100 Zinfandel Drive, branch established on 2006/04/24. Info updated 2006/11/03: Bank assets: $439.6 mil, Deposits: $389.1 mil, headquarters in Rocklin, CA, positive income , Commercial Lending Specialization, 5 total offices , Holding Company: Five Star Bancorp
American River Bank: Zinfandel Loan Operation at 3100 Zinfandel Drive, Suite 450, branch established on 2010/12/01. Info updated 2006/11/03: Bank assets: $581.6 mil, Deposits: $467.4 mil, headquarters in Sacramento, CA, positive income , Commercial Lending Specialization, 12 total offices , Holding Company: American River Bankshares
Exchange Bank: Rancho Cordova Branch at 3320 Data Drive, Suite 300, branch established on 2004/07/01. Info updated 2010/02/16: Bank assets: $1,575.4 mil, Deposits: $1,350.9 mil, headquarters in Santa Rosa, CA, positive income , Commercial Lending Specialization, 21 total offices , Holding Company: Frank P. Doyle Trust, Article Ix
Wells Fargo Bank, National Association: Gold River Branch at 2010 Gold Field Drive, branch established on 1955/02/28. Info updated 2011/04/05: Bank assets: $1,161,490.0 mil, Deposits: $905,653.0 mil, headquarters in Sioux Falls, SD, positive income , 6395 total offices , Holding Company: Wells Fargo & Company
Bank of Sacramento: Rancho Cordova Bbc Branch at 2882 Prospect Park Drive, Suite 240, branch established on 2005/03/13. Info updated 2006/04/19: Bank assets: $406.9 mil, Deposits: $343.7 mil, headquarters in Sacramento, CA, positive income , Commercial Lending Specialization, 4 total offices , Holding Company: Greater Sacramento Bancorp
Westamerica Bank: Rancho Cordova Branch at 2893 Sunrise Boulevard, Suite 106, branch established on 1994/10/31. Info updated 2011/06/21: Bank assets: $4,998.1 mil, Deposits: $4,253.2 mil, headquarters in San Rafael, CA, positive income , Commercial Lending Specialization, 98 total offices , Holding Company: Westamerica Bancorporation
For population 15 years and over in Rancho Cordova:
Never married: 34.0%Now married: 48.7%Separated: 2.1%Widowed: 5.2%Divorced: 10.0% For population 25 years and over in Rancho Cordova:
High school or higher: 92.9%Bachelor's degree or higher: 33.0%Graduate or professional degree: 10.2%Unemployed: 4.5%Mean travel time to work (commute): 21.3 minutes
Education Gini index (Inequality in education) Here:
10.0California average:
15.5
Religion statistics for Rancho Cordova, CA (based on Sacramento County data)
Religion Adherents Congregations Catholic 229,725 45 Evangelical Protestant 157,621 493 Other 86,390 183 Mainline Protestant 33,989 105 Black Protestant 12,585 38 Orthodox 5,675 12 None 892,803 -
Source: Clifford Grammich, Kirk Hadaway, Richard Houseal, Dale E.Jones, Alexei Krindatch, Richie Stanley and Richard H.Taylor. 2012. 2010 U.S.Religion Census: Religious Congregations & Membership Study. Association of Statisticians of American Religious Bodies. Jones, Dale E., et al. 2002. Congregations and Membership in the United States 2000. Nashville, TN: Glenmary Research Center. Graphs represent county-level data
Food Environment Statistics: Number of grocery stores : 255This county :
1.85 / 10,000 pop.State :
2.14 / 10,000 pop.
Number of supercenters and club stores : 10Sacramento County :
0.07 / 10,000 pop.State :
0.04 / 10,000 pop.
Number of convenience stores (no gas) : 86Sacramento County :
0.62 / 10,000 pop.State :
0.62 / 10,000 pop.
Number of convenience stores (with gas) : 233This county :
1.69 / 10,000 pop.State :
1.49 / 10,000 pop.
Number of full-service restaurants : 922Sacramento County :
6.68 / 10,000 pop.State :
7.42 / 10,000 pop.
Adult diabetes rate : Sacramento County :
7.8%California :
7.3%
Adult obesity rate : Sacramento County :
25.0%State :
21.3%
Low-income preschool obesity rate : Sacramento County :
15.4%California :
17.9%
Health and Nutrition: Healthy diet rate : Rancho Cordova:
49.8%California:
49.4%
Average overall health of teeth and gums : People feeling badly about themselves : Rancho Cordova:
20.5%California:
20.2%
People not drinking alcohol at all : Rancho Cordova:
11.4%California:
11.2%
Average hours sleeping at night : Overweight people : This city:
31.9%State:
31.5%
General health condition : Here:
56.8%California:
56.4%
Average condition of hearing : More about Health and Nutrition of Rancho Cordova, CA Residents
Local government employment and payroll (March 2022)
Function
Full-time employees
Monthly full-time payroll
Average yearly full-time wage
Part-time employees
Monthly part-time payroll
Other and Unallocable
34 $264,221 $93,254 8 $11,192 Other Government Administration
23 $163,370 $85,237 3 $2,899 Streets and Highways
21 $192,148 $109,799 3 $2,815 Financial Administration
16 $136,963 $102,722 0 $0 Housing and Community Development (Local)
3 $24,295 $97,180 0 $0
Totals for Government
97 $780,997 $96,618 14 $16,906
Rancho Cordova government finances - Expenditure in 2017 (per resident):
Construction - Regular Highways: $17,471,000 ($216.77)
Housing and Community Development: $2,724,000 ($33.80)Central Staff Services: $306,000 ($3.80)Current Operations - Central Staff Services: $20,232,000 ($251.02)
Police Protection: $19,930,000 ($247.28)Regular Highways: $8,643,000 ($107.24)Housing and Community Development: $4,867,000 ($60.39)Sewerage: $3,150,000 ($39.08)Protective Inspection and Regulation - Other: $1,371,000 ($17.01)Financial Administration: $1,209,000 ($15.00)Health - Other: $520,000 ($6.45)Miscellaneous Commercial Activities - Other: $39,000 ($0.48)Parks and Recreation: $5,000 ($0.06)General - Interest on Debt: $561,000 ($6.96)
Intergovernmental to Local - Other - Police Protection: $18,197,000 ($225.77)
Other - General - Other: $5,910,000 ($73.33)Other Capital Outlay - General - Other: $2,160,000 ($26.80)
Rancho Cordova government finances - Revenue in 2017 (per resident):
Charges - Other: $5,831,000 ($72.35)
Sewerage: $3,554,000 ($44.10)Regular Highways: $515,000 ($6.39)Housing and Community Development: $353,000 ($4.38)Miscellaneous Commercial Activities: $13,000 ($0.16)Federal Intergovernmental - Other: $5,341,000 ($66.27)
Housing and Community Development: $478,000 ($5.93)Sewerage: $26,000 ($0.32)Local Intergovernmental - Sewerage: $773,000 ($9.59)
Other: $573,000 ($7.11)Miscellaneous - Fines and Forfeits: $1,360,000 ($16.87)
Interest Earnings: $1,319,000 ($16.37)Rents: $636,000 ($7.89)General Revenue - Other: $19,000 ($0.24)State Intergovernmental - Sewerage: $1,751,000 ($21.73)
Highways: $1,400,000 ($17.37)Other: $537,000 ($6.66)General Local Government Support: $98,000 ($1.22)Tax - General Sales and Gross Receipts: $24,582,000 ($305.00)
Property: $14,485,000 ($179.72)Other: $14,102,000 ($174.97)Public Utilities Sales: $5,692,000 ($70.62)Other Selective Sales: $3,866,000 ($47.97)Other License: $2,708,000 ($33.60)Documentary and Stock Transfer: $557,000 ($6.91)Occupation and Business License - Other: $547,000 ($6.79)
Rancho Cordova government finances - Debt in 2017 (per resident):
Long Term Debt - Beginning Outstanding - Unspecified Public Purpose: $17,962,000 ($222.86)
Outstanding Unspecified Public Purpose: $17,839,000 ($221.33)Retired Unspecified Public Purpose: $124,000 ($1.54)
Rancho Cordova government finances - Cash and Securities in 2017 (per resident):
Bond Funds - Cash and Securities: $10,018,000 ($124.30)
Other Funds - Cash and Securities: $120,857,000 ($1499.50)
Sinking Funds - Cash and Securities: $73,000 ($0.91)
5.68% of this county's 2021 resident taxpayers lived in other counties in 2020 ($67,729 average adjusted gross income )
Here:
5.68%California average:
5.19%
0.01% of residents moved from foreign countries ($150 average AGI )Sacramento County:
0.01%California average:
0.03%
Top counties from which taxpayers relocated into this county between 2020 and 2021:
6.10% of this county's 2020 resident taxpayers moved to other counties in 2021 ($74,281 average adjusted gross income )
Here:
6.10%California average:
6.14%
0.01% of residents moved to foreign countries ($109 average AGI )Sacramento County:
0.01%California average:
0.02%
Top counties to which taxpayers relocated from this county between 2020 and 2021:
Businesses in Rancho Cordova, CA
Name Count Name Count
7-Eleven 2 Kincaid 1 99 Cents Only Stores 1 Kmart 1 Applebee's 1 Kohl's 1 Arby's 1 La Quinta 1 AutoZone 1 La-Z-Boy 1 Baskin-Robbins 2 Lane Furniture 2 Blockbuster 1 Little Caesars Pizza 1 Budget Car Rental 1 Lowe's 1 Burger King 1 Marriott 3 CVS 1 MasterBrand Cabinets 5 Carl\s Jr. 3 McDonald's 6 Circle K 1 Motel 6 2 Costco 1 Nike 1 Crossland Economy Studios 1 Payless 1 Curves 1 Penske 1 Decora Cabinetry 2 PetSmart 1 Dennys 1 Pizza Hut 1 Discount Tire 1 Quiznos 1 El Pollo Loco 1 RadioShack 1 Extended Stay America 1 Red Roof Inn 1 FedEx 7 Rite Aid 1 Firestone Complete Auto Care 1 Safeway 1 GNC 1 Sprint Nextel 1 GameStop 1 Staples 1 H&R Block 1 Starbucks 7 Haworth 1 Subway 7 Hawthorn 1 T-Mobile 3 Hilton 1 Taco Bell 3 Holiday Inn 1 Target 1 Home Depot 1 U-Haul 2 Honda 1 UPS 14 Hyatt 1 Vons 1 IHOP 1 Walgreens 1 Jamba Juice 1 Walmart 1 Jones New York 1 Wendy's 1 KFC 1
Strongest AM radio stations in Rancho Cordova:
KSTE (650 AM; 25 kW; RANCHO CORDOVA, CA; Owner: AMFM RADIO LICENSES, L.L.C.)
KHTK (1140 AM; 50 kW; SACRAMENTO, CA; Owner: INFINITY RADIO SUBSIDIARY OPERATIONS INC.)
KFIA (710 AM; 25 kW; CARMICHAEL, CA; Owner: VISTA BROADCASTING INC.)
KTKZ (1380 AM; 5 kW; SACRAMENTO, CA; Owner: VISTA BROADCASTING, INC.)
KFBK (1530 AM; 50 kW; SACRAMENTO, CA; Owner: AMFM RADIO LICENSES, L.L.C.)
KSMH (1620 AM; 10 kW; WEST SACRAMENTO, CA; Owner: IHR EDUCATIONAL BROADCASTING)
KLIB (1110 AM; 10 kW; ROSEVILLE, CA; Owner: WAY BROADCASTING, INC.)
KFSG (1690 AM; 10 kW; ROSEVILLE, CA; Owner: WAY BROADCASTING, INC.)
KIID (1470 AM; 5 kW; SACRAMENTO, CA; Owner: ABC, INC.)
KEBR (1210 AM; 5 kW; ROCKLIN, CA; Owner: FAMILY STATIONS, INC.)
KCTC (1320 AM; 5 kW; SACRAMENTO, CA; Owner: ENTERCOM SACRAMENTO LICENSE, LLC)
KAHI (950 AM; 10 kW; AUBURN, CA; Owner: IHR EDUCATIONAL BROADCASTING)
KCBC (770 AM; 50 kW; RIVERBANK, CA; Owner: KIERTRON, INC.)
Strongest FM radio stations in Rancho Cordova:
KEDR (88.1 FM; SACRAMENTO, CA; Owner: FAMILY STATIONS, INC.)
KXCL (103.9 FM; YUBA CITY, CA; Owner: HARLAN COMMUNICATIONS, INC.)
KSEG (96.9 FM; SACRAMENTO, CA; Owner: ENTERCOM SACRAMENTO LICENSE, LLC)
KRXQ (98.5 FM; SACRAMENTO, CA; Owner: ENTERCOM SACRAMENTO LICENSE, LLC)
KNCI (105.1 FM; SACRAMENTO, CA; Owner: INFINITY RADIO SUBSIDIARY OPERATIONS INC.)
KYDS (91.5 FM; SACRAMENTO, CA; Owner: SAN JUAN UNIFIED SCHOOL DISTRICT)
K211DF (90.1 FM; FOOTHILL FARMS, CA; Owner: YOUR CHRISTIAN COMPANION NETWORK, INC.)
KXPR (90.9 FM; SACRAMENTO, CA; Owner: CALIFORNIA STATE UNIVERSITY)
KXOA (93.7 FM; ROSEVILLE, CA; Owner: INFINITY RADIO SUBSIDIARY OPERATIONS INC.)
K256AG (99.1 FM; CLARKSVILLE, CA; Owner: EDUCATIONAL MEDIA FOUNDATION)
KWOD (106.5 FM; SACRAMENTO, CA; Owner: ENTERCOM SACRAMENTO LICENSE, LLC)
KGBY (92.5 FM; SACRAMENTO, CA; Owner: AMFM RADIO LICENSES, L.L.C.)
KBMB (103.5 FM; SACRAMENTO, CA; Owner: DIAMOND RADIO, INC.)
KKSF-FM1 (103.7 FM; PLEASANTON, ETC., CA; Owner: AMFM RADIO LICENSES, L.L.C.)
KYMX (96.1 FM; SACRAMENTO, CA; Owner: INFINITY RADIO OPERATIONS INC.)
KBLX-FM2 (102.9 FM; PLEASANTON, CA; Owner: ICBC BROADCAST HOLDINGS -CA, INC.)
KSOL-FM3 (98.9 FM; PLEASANTON, CA; Owner: TMS LICENSE CALIFORNIA, INC)
KFRC-FM3 (99.7 FM; WALNUT CREEK, CA; Owner: INFINITY KFRC-FM, INC.)
KZBR-FM1 (95.7 FM; WALNUT CREEK, CA; Owner: BONNEVILLE HOLDING COMPANY)
KDND (107.9 FM; SACRAMENTO, CA; Owner: ENTERCOM SACRAMENTO LICENSE, LLC)
TV broadcast stations around Rancho Cordova:
KMMK-LP (Channel 14; SACRAMENTO, CA; Owner: CABALLERO TELEVISION TEXAS, L.L.C.)
KEZT-CA (Channel 23; SACRAMENTO, CA; Owner: TELEFUTURA SACRAMENTO LLC)
KCSO-LP (Channel 33; SACRAMENTO, CA; Owner: SAINTE 51, L.P.)
K22FR (Channel 22; SACRAMENTO, CA; Owner: NATIONAL MINORITY T.V., INC.)
KSPX (Channel 29; SACRAMENTO, CA; Owner: PAXSON SACRAMENTO LICENSE, INC.)
KTXL (Channel 40; SACRAMENTO, CA; Owner: CHANNEL 40, INC.)
KQCA (Channel 58; STOCKTON, CA; Owner: KCRA HEARST-ARGYLE TELEVISION, INC.)
KVIE (Channel 6; SACRAMENTO, CA; Owner: KVIE, INC.)
KCRA-TV (Channel 3; SACRAMENTO, CA; Owner: KCRA HEARST-ARGYLE TELEVISION, INC.)
KMAX-TV (Channel 31; SACRAMENTO, CA; Owner: UPN STATIONS GROUP INC.)
KOVR (Channel 13; STOCKTON, CA; Owner: SCI - SACRAMENTO LICENSEE, LLC)
KXTV (Channel 10; SACRAMENTO, CA; Owner: KXTV, INC.)
KUVS (Channel 19; MODESTO, CA; Owner: KUVS LICENSE PARTNERSHIP, G.P.)
K69FB (Channel 69; SACRAMENTO, CA; Owner: TRINITY BROADCASTING NETWORK)
KRJR-LP (Channel 47; SACRAMENTO, CA; Owner: WORD OF GOD FELLOWSHIP, INC.)
K17EH (Channel 17; EUREKA, CA; Owner: MS COMMUNICATIONS, LLC)
KSAO-LP (Channel 49; SACRAMENTO, CA; Owner: GARY M. COCOLA FAMILY TRUST, GARY M. COCOLA TRUSTEE)
KBTV-LP (Channel 8; SACRAMENTO, CA; Owner: INCISOR COMMUNICATIONS, L.L.C.)
K27EU (Channel 27; SACRAMENTO, CA; Owner: ABUNDANT LIFE BROADCASTING, INC.)
KMUM-CA (Channel 15; SACRAMENTO, CA; Owner: CABALLERO TELEVISION TEXAS, L.L.C.)
K61DW (Channel 61; SACRAMENTO, CA; Owner: DR. W. R. PORTEE)
KSTV-LP (Channel 60; SACRAMENTO, CA; Owner: GARY M. COCOLA FAMILY TRUST, GARY M. COCOLA TRUSTEE)
K27FX (Channel 27; EUREKA, CA; Owner: MS COMMUNICATIONS, LLC)
KGTN-LP (Channel 62; PLACERVILLE, CA; Owner: PRAISE THE LORD STUDIO CHAPEL)
National Bridge Inventory (NBI) Statistics 42 Number of bridges459ft / 140m Total length1,979,323 Total average daily traffic114,202 Total average daily truck traffic
New bridges - historical statistics
1 1920-1929 4 1940-1949 1 1950-1959 9 1960-1969 18 1970-1979 1 1980-1989 1 1990-1999 4 2000-2009 3 2010-2019
See full National Bridge Inventory statistics for Rancho Cordova, CA
Home Mortgage Disclosure Act Aggregated Statistics For Year 2009(Based on 14 full tracts) A) FHA, FSA/RHS & VA B) Conventional C) Refinancings D) Home Improvement Loans E) Loans on Dwellings For 5+ Families F) Non-occupant Loans on G) Loans On Manufactured Number Average Value Number Average Value Number Average Value Number Average Value Number Average Value Number Average Value Number Average Value
LOANS ORIGINATED 456 $189,904 272 $153,963 567 $188,961 26 $83,962 2 $2,435,500 125 $127,824 1 $28,000 APPLICATIONS APPROVED, NOT ACCEPTED 30 $184,800 31 $154,194 57 $211,333 10 $27,500 0 $0 18 $134,667 0 $0 APPLICATIONS DENIED 77 $201,740 58 $135,448 250 $196,736 42 $38,452 0 $0 28 $111,036 8 $38,750 APPLICATIONS WITHDRAWN 74 $200,324 49 $151,571 189 $201,529 23 $84,261 0 $0 29 $130,483 1 $77,000 FILES CLOSED FOR INCOMPLETENESS 9 $174,222 8 $148,875 26 $205,615 2 $108,500 0 $0 4 $202,750 0 $0
Aggregated Statistics For Year 2008(Based on 14 full tracts) A) FHA, FSA/RHS & VA B) Conventional C) Refinancings D) Home Improvement Loans E) Loans on Dwellings For 5+ Families F) Non-occupant Loans on G) Loans On Manufactured Number Average Value Number Average Value Number Average Value Number Average Value Number Average Value Number Average Value Number Average Value
LOANS ORIGINATED 320 $210,378 441 $163,034 366 $175,743 74 $62,716 4 $3,612,000 148 $134,304 20 $52,450 APPLICATIONS APPROVED, NOT ACCEPTED 34 $196,059 72 $179,528 98 $181,286 18 $46,000 1 $5,188,000 28 $159,393 13 $51,154 APPLICATIONS DENIED 67 $225,224 159 $183,057 414 $225,176 88 $68,545 2 $2,947,500 59 $156,983 21 $58,619 APPLICATIONS WITHDRAWN 66 $208,197 100 $177,070 169 $211,645 15 $95,200 0 $0 38 $149,763 2 $69,000 FILES CLOSED FOR INCOMPLETENESS 11 $196,818 17 $158,529 33 $242,636 5 $104,200 0 $0 9 $203,556 0 $0
Aggregated Statistics For Year 2007(Based on 14 full tracts) A) FHA, FSA/RHS & VA B) Conventional C) Refinancings D) Home Improvement Loans E) Loans on Dwellings For 5+ Families F) Non-occupant Loans on G) Loans On Manufactured Number Average Value Number Average Value Number Average Value Number Average Value Number Average Value Number Average Value Number Average Value
LOANS ORIGINATED 11 $270,545 538 $213,615 990 $205,043 169 $105,651 8 $3,987,875 166 $195,349 27 $56,074 APPLICATIONS APPROVED, NOT ACCEPTED 2 $259,500 132 $203,924 290 $215,969 41 $136,098 0 $0 41 $212,537 12 $71,417 APPLICATIONS DENIED 5 $243,400 258 $224,128 972 $257,960 146 $123,774 1 $182,000 110 $248,145 21 $48,619 APPLICATIONS WITHDRAWN 11 $283,182 159 $237,415 375 $242,464 40 $132,400 1 $2,000,000 51 $228,765 1 $47,000 FILES CLOSED FOR INCOMPLETENESS 1 $155,000 16 $216,188 134 $258,336 10 $153,900 0 $0 13 $203,077 0 $0
Aggregated Statistics For Year 2006(Based on 14 full tracts) A) FHA, FSA/RHS & VA B) Conventional C) Refinancings D) Home Improvement Loans E) Loans on Dwellings For 5+ Families F) Non-occupant Loans on G) Loans On Manufactured Number Average Value Number Average Value Number Average Value Number Average Value Number Average Value Number Average Value Number Average Value
LOANS ORIGINATED 7 $302,571 1,111 $215,706 1,904 $217,694 332 $109,611 9 $4,846,111 346 $216,884 23 $62,217 APPLICATIONS APPROVED, NOT ACCEPTED 0 $0 232 $221,461 477 $231,384 78 $274,936 0 $0 74 $391,324 8 $69,000 APPLICATIONS DENIED 1 $255,000 443 $212,321 1,070 $240,535 301 $122,870 2 $230,000 118 $241,288 27 $73,222 APPLICATIONS WITHDRAWN 2 $271,500 253 $236,696 788 $247,671 89 $176,449 1 $54,000 69 $230,014 4 $173,500 FILES CLOSED FOR INCOMPLETENESS 0 $0 49 $241,837 184 $269,326 15 $133,000 0 $0 17 $248,176 0 $0
Aggregated Statistics For Year 2005(Based on 14 full tracts) A) FHA, FSA/RHS & VA B) Conventional C) Refinancings D) Home Improvement Loans E) Loans on Dwellings For 5+ Families F) Non-occupant Loans on G) Loans On Manufactured Number Average Value Number Average Value Number Average Value Number Average Value Number Average Value Number Average Value Number Average Value
LOANS ORIGINATED 32 $239,875 1,980 $215,549 2,723 $222,403 459 $125,793 17 $2,850,647 491 $217,943 37 $56,000 APPLICATIONS APPROVED, NOT ACCEPTED 0 $0 330 $212,406 392 $223,339 72 $121,083 0 $0 69 $210,652 19 $69,632 APPLICATIONS DENIED 0 $0 484 $209,205 1,125 $232,158 307 $127,726 0 $0 114 $219,009 31 $104,129 APPLICATIONS WITHDRAWN 3 $253,667 279 $212,065 976 $229,534 201 $179,627 2 $10,485,000 81 $199,642 6 $122,167 FILES CLOSED FOR INCOMPLETENESS 0 $0 79 $237,582 259 $244,467 15 $97,067 0 $0 10 $262,300 0 $0
Aggregated Statistics For Year 2004(Based on 14 full tracts) A) FHA, FSA/RHS & VA B) Conventional C) Refinancings D) Home Improvement Loans E) Loans on Dwellings For 5+ Families F) Non-occupant Loans on G) Loans On Manufactured Number Average Value Number Average Value Number Average Value Number Average Value Number Average Value Number Average Value Number Average Value
LOANS ORIGINATED 42 $229,762 1,831 $188,999 2,781 $187,635 381 $108,257 10 $2,135,400 447 $197,148 29 $53,931 APPLICATIONS APPROVED, NOT ACCEPTED 4 $224,500 311 $182,042 447 $189,993 46 $95,087 1 $297,000 69 $185,623 25 $61,400 APPLICATIONS DENIED 5 $208,600 443 $183,614 1,135 $186,577 253 $96,047 0 $0 133 $198,060 36 $68,250 APPLICATIONS WITHDRAWN 12 $229,833 250 $205,320 906 $187,960 89 $113,382 2 $1,725,000 64 $183,922 1 $73,000 FILES CLOSED FOR INCOMPLETENESS 1 $208,000 62 $201,984 356 $187,576 19 $69,053 0 $0 18 $179,444 0 $0
Aggregated Statistics For Year 2003(Based on 14 full tracts) A) FHA, FSA/RHS & VA B) Conventional C) Refinancings D) Home Improvement Loans E) Loans on Dwellings For 5+ Families F) Non-occupant Loans on Number Average Value Number Average Value Number Average Value Number Average Value Number Average Value Number Average Value
LOANS ORIGINATED 247 $194,822 1,431 $169,575 3,739 $144,707 223 $44,520 14 $3,030,500 525 $136,495 APPLICATIONS APPROVED, NOT ACCEPTED 20 $196,350 268 $169,119 551 $152,521 53 $47,755 1 $1,178,000 72 $144,056 APPLICATIONS DENIED 14 $206,357 269 $161,119 1,206 $148,958 207 $40,493 2 $15,616,000 89 $135,944 APPLICATIONS WITHDRAWN 34 $198,971 283 $186,473 1,004 $152,171 46 $47,652 0 $0 47 $160,660 FILES CLOSED FOR INCOMPLETENESS 2 $160,500 68 $227,191 135 $152,052 14 $63,643 0 $0 15 $125,600
Aggregated Statistics For Year 2002(Based on 4 full tracts) A) FHA, FSA/RHS & VA B) Conventional C) Refinancings D) Home Improvement Loans E) Loans on Dwellings For 5+ Families F) Non-occupant Loans on Number Average Value Number Average Value Number Average Value Number Average Value Number Average Value Number Average Value
LOANS ORIGINATED 337 $181,837 580 $161,740 856 $131,070 75 $36,093 10 $1,626,900 110 $110,500 APPLICATIONS APPROVED, NOT ACCEPTED 8 $142,750 104 $163,846 109 $127,697 25 $32,080 0 $0 7 $118,429 APPLICATIONS DENIED 20 $194,300 64 $149,172 280 $132,404 85 $31,553 1 $475,000 16 $94,562 APPLICATIONS WITHDRAWN 46 $192,739 130 $189,308 227 $144,868 16 $38,000 0 $0 11 $168,000 FILES CLOSED FOR INCOMPLETENESS 5 $136,400 21 $183,714 59 $143,458 0 $0 0 $0 1 $189,000
Aggregated Statistics For Year 2001(Based on 4 full tracts) A) FHA, FSA/RHS & VA B) Conventional C) Refinancings D) Home Improvement Loans E) Loans on Dwellings For 5+ Families F) Non-occupant Loans on Number Average Value Number Average Value Number Average Value Number Average Value Number Average Value Number Average Value
LOANS ORIGINATED 249 $145,229 351 $129,222 579 $106,822 36 $26,917 2 $1,825,500 98 $98,551 APPLICATIONS APPROVED, NOT ACCEPTED 12 $137,917 30 $134,933 50 $109,180 10 $45,500 0 $0 8 $91,500 APPLICATIONS DENIED 13 $158,923 55 $130,018 228 $107,136 27 $27,185 0 $0 4 $104,750 APPLICATIONS WITHDRAWN 28 $168,393 90 $191,500 182 $114,022 15 $26,933 1 $500,000 8 $94,000 FILES CLOSED FOR INCOMPLETENESS 3 $122,000 11 $124,727 31 $91,645 3 $31,667 1 $850,000 7 $103,000
Aggregated Statistics For Year 2000(Based on 4 full tracts) A) FHA, FSA/RHS & VA B) Conventional C) Refinancings D) Home Improvement Loans E) Loans on Dwellings For 5+ Families F) Non-occupant Loans on Number Average Value Number Average Value Number Average Value Number Average Value Number Average Value Number Average Value
LOANS ORIGINATED 216 $122,796 225 $110,836 109 $70,716 24 $24,583 3 $5,361,333 30 $86,467 APPLICATIONS APPROVED, NOT ACCEPTED 21 $130,762 31 $114,065 22 $82,682 21 $23,048 0 $0 6 $105,667 APPLICATIONS DENIED 16 $122,250 69 $100,087 87 $79,736 35 $26,029 0 $0 6 $106,667 APPLICATIONS WITHDRAWN 88 $151,364 86 $160,547 42 $58,690 7 $56,429 1 $292,000 2 $112,500 FILES CLOSED FOR INCOMPLETENESS 4 $102,750 5 $158,600 13 $100,154 1 $29,000 0 $0 2 $82,000
Aggregated Statistics For Year 1999(Based on 8 full and 1 partial tracts) A) FHA, FSA/RHS & VA B) Conventional C) Refinancings D) Home Improvement Loans E) Loans on Dwellings For 5+ Families F) Non-occupant Loans on Number Average Value Number Average Value Number Average Value Number Average Value Number Average Value Number Average Value
LOANS ORIGINATED 313 $101,274 332 $92,123 574 $83,519 81 $24,287 21 $1,171,649 126 $72,085 APPLICATIONS APPROVED, NOT ACCEPTED 10 $91,706 32 $104,629 130 $86,927 70 $20,740 2 $749,330 14 $76,540 APPLICATIONS DENIED 24 $103,548 73 $74,140 351 $77,568 116 $25,816 4 $97,478 38 $84,718 APPLICATIONS WITHDRAWN 26 $117,688 45 $111,999 197 $83,528 9 $19,150 3 $3,766,437 16 $65,341 FILES CLOSED FOR INCOMPLETENESS 5 $96,036 11 $95,214 67 $94,727 2 $29,565 3 $1,329,467 8 $68,834
Detailed mortgage data for all 14 tracts in Rancho Cordova, CA
Private Mortgage Insurance Companies Aggregated Statistics For Year 2009(Based on 12 full tracts) A) Conventional B) Refinancings C) Non-occupant Loans on Number Average Value Number Average Value Number Average Value
LOANS ORIGINATED 55 $190,691 10 $206,800 0 $0 APPLICATIONS APPROVED, NOT ACCEPTED 21 $200,810 9 $221,556 2 $189,000 APPLICATIONS DENIED 12 $193,500 2 $230,000 0 $0 APPLICATIONS WITHDRAWN 8 $191,625 2 $187,500 0 $0 FILES CLOSED FOR INCOMPLETENESS 1 $190,000 0 $0 0 $0
Aggregated Statistics For Year 2008(Based on 14 full tracts) A) Conventional B) Refinancings C) Non-occupant Loans on Number Average Value Number Average Value Number Average Value
LOANS ORIGINATED 151 $217,742 35 $246,514 6 $214,333 APPLICATIONS APPROVED, NOT ACCEPTED 45 $233,644 32 $270,250 2 $300,000 APPLICATIONS DENIED 15 $201,667 9 $229,222 7 $238,429 APPLICATIONS WITHDRAWN 4 $226,750 1 $269,000 0 $0 FILES CLOSED FOR INCOMPLETENESS 1 $257,000 2 $237,500 0 $0
Aggregated Statistics For Year 2007(Based on 14 full tracts) A) Conventional B) Refinancings C) Non-occupant Loans on Number Average Value Number Average Value Number Average Value
LOANS ORIGINATED 146 $274,664 71 $297,535 10 $305,600 APPLICATIONS APPROVED, NOT ACCEPTED 12 $296,083 25 $295,400 1 $414,000 APPLICATIONS DENIED 4 $247,750 2 $266,000 1 $305,000 APPLICATIONS WITHDRAWN 9 $285,778 7 $304,143 1 $414,000 FILES CLOSED FOR INCOMPLETENESS 0 $0 0 $0 0 $0
Aggregated Statistics For Year 2006(Based on 13 full tracts) A) Conventional B) Refinancings C) Non-occupant Loans on Number Average Value Number Average Value Number Average Value
LOANS ORIGINATED 24 $313,125 37 $322,351 7 $274,857 APPLICATIONS APPROVED, NOT ACCEPTED 7 $320,143 12 $314,833 3 $271,333 APPLICATIONS DENIED 2 $274,000 1 $384,000 2 $274,000 APPLICATIONS WITHDRAWN 2 $287,000 5 $276,000 2 $287,000 FILES CLOSED FOR INCOMPLETENESS 0 $0 0 $0 0 $0
Aggregated Statistics For Year 2005(Based on 14 full tracts) A) Conventional B) Refinancings C) Non-occupant Loans on Number Average Value Number Average Value Number Average Value
LOANS ORIGINATED 50 $285,400 58 $284,621 10 $247,400 APPLICATIONS APPROVED, NOT ACCEPTED 15 $321,933 13 $254,308 4 $384,000 APPLICATIONS DENIED 0 $0 1 $315,000 0 $0 APPLICATIONS WITHDRAWN 5 $338,000 5 $264,800 0 $0 FILES CLOSED FOR INCOMPLETENESS 0 $0 0 $0 0 $0
Aggregated Statistics For Year 2004(Based on 14 full tracts) A) Conventional B) Refinancings C) Non-occupant Loans on Number Average Value Number Average Value Number Average Value
LOANS ORIGINATED 124 $254,532 58 $233,207 10 $241,300 APPLICATIONS APPROVED, NOT ACCEPTED 37 $252,081 45 $218,244 6 $221,000 APPLICATIONS DENIED 4 $277,500 1 $217,000 0 $0 APPLICATIONS WITHDRAWN 5 $194,600 2 $166,500 1 $234,000 FILES CLOSED FOR INCOMPLETENESS 1 $177,000 3 $221,000 1 $177,000
Aggregated Statistics For Year 2003(Based on 14 full tracts) A) Conventional B) Refinancings C) Non-occupant Loans on Number Average Value Number Average Value Number Average Value
LOANS ORIGINATED 227 $207,366 184 $186,918 22 $179,818 APPLICATIONS APPROVED, NOT ACCEPTED 49 $224,694 58 $180,310 6 $136,667 APPLICATIONS DENIED 3 $223,000 4 $197,500 1 $204,000 APPLICATIONS WITHDRAWN 7 $224,286 6 $164,167 2 $208,000 FILES CLOSED FOR INCOMPLETENESS 1 $209,000 3 $172,000 0 $0
Aggregated Statistics For Year 2002(Based on 4 full tracts) A) Conventional B) Refinancings C) Non-occupant Loans on Number Average Value Number Average Value Number Average Value
LOANS ORIGINATED 121 $207,405 63 $171,286 4 $151,000 APPLICATIONS APPROVED, NOT ACCEPTED 21 $200,238 19 $157,158 0 $0 APPLICATIONS DENIED 0 $0 1 $137,000 1 $137,000 APPLICATIONS WITHDRAWN 6 $216,667 2 $139,500 2 $122,000 FILES CLOSED FOR INCOMPLETENESS 1 $201,000 1 $251,000 0 $0
Aggregated Statistics For Year 2001(Based on 4 full tracts) A) Conventional B) Refinancings C) Non-occupant Loans on Number Average Value Number Average Value Number Average Value
LOANS ORIGINATED 103 $174,990 50 $136,020 6 $95,500 APPLICATIONS APPROVED, NOT ACCEPTED 14 $168,857 13 $138,231 2 $121,500 APPLICATIONS DENIED 0 $0 2 $113,000 2 $113,000 APPLICATIONS WITHDRAWN 0 $0 2 $199,500 0 $0 FILES CLOSED FOR INCOMPLETENESS 0 $0 0 $0 0 $0
Aggregated Statistics For Year 2000(Based on 4 full tracts) A) Conventional B) Refinancings C) Non-occupant Loans on Number Average Value Number Average Value Number Average Value
LOANS ORIGINATED 45 $128,333 9 $97,111 1 $106,000 APPLICATIONS APPROVED, NOT ACCEPTED 8 $109,875 1 $138,000 0 $0 APPLICATIONS DENIED 3 $122,000 0 $0 0 $0 APPLICATIONS WITHDRAWN 2 $116,000 0 $0 0 $0 FILES CLOSED FOR INCOMPLETENESS 0 $0 0 $0 0 $0
Aggregated Statistics For Year 1999(Based on 7 full and 1 partial tracts) A) Conventional B) Refinancings C) Non-occupant Loans on Number Average Value Number Average Value Number Average Value
LOANS ORIGINATED 62 $110,044 71 $120,346 15 $76,699 APPLICATIONS APPROVED, NOT ACCEPTED 9 $130,671 15 $116,114 8 $97,812 APPLICATIONS DENIED 2 $90,845 0 $0 0 $0 APPLICATIONS WITHDRAWN 1 $81,140 3 $113,650 1 $84,000 FILES CLOSED FOR INCOMPLETENESS 0 $0 0 $0 0 $0
Fire-safe hotels and motels in Rancho Cordova, California:
Holiday Inn Rancho Cordova, 11269 Pt East Dr, Rancho Cordova, California 95742 Phone: (916) 635-4040, Fax: (916) 635-7198
Sacramento Marriott Rancho Cordova, 11211 Pt East Dr, Rancho Cordova, California 95742 Phone: (916) 638-1100, Fax: (916) 635-8356
Best Western Plus Rancho Cordova Inn, 10713 White Rock Rd, Rancho Cordova, California 95670 Phone: (916) 631-7500, Fax: (916) 635-0301
Economy Inns Of America, 12249 Folsom Blvd, Rancho Cordova, California 95670 Phone: (916) 351-1213
DoubleTree Suites by Hilton Sacramento-Rancho Cordova, 11260 Pt East Dr, Rancho Cordova, California 95742 Phone: (916) 638-4141, Fax: (916) 638-1045
La Quinta Inn & Suites-Rancho Cordova, 11131 Folsom Blvd, Rancho Cordova, California 95670 Phone: (916) 638-1111, Fax: (916) 635-3297
Red Roof Inn-Rancho Cordova - East Sac, 10800 Olson Dr, Rancho Cordova, California 95670 Phone: (916) 638-2500, Fax: (916) 638-2672
Days Inn & Suites Rancho Cordova, 3240 Mather Field Rd, Rancho Cordova, California 95670 Phone: (916) 363-3344, Fax: (916) 363-1988
6 other hotels and motels
All 14 fire-safe hotels and motels in Rancho Cordova, California
Most common first names in Rancho Cordova, CA among deceased individuals Name Count Lived (average)
Robert 170 70.8 years William 154 75.7 years John 148 71.8 years James 141 69.1 years Mary 135 75.8 years Charles 108 72.9 years George 81 72.2 years Dorothy 73 76.3 years Helen 72 80.8 years Richard 65 66.7 years
Most common last names in Rancho Cordova, CA among deceased individuals Last name Count Lived (average)
Smith 79 72.9 years Johnson 67 73.2 years Williams 43 68.9 years Jones 41 76.5 years Brown 38 68.4 years Miller 36 72.0 years Wilson 32 79.0 years Martin 27 76.1 years Anderson 27 72.1 years Thompson 27 76.6 years
Rancho Cordova compared to California state average:
Unemployed percentage significantly below state average. Black race population percentage above state average. Length of stay since moving in significantly below state average. House age below state average. Rancho Cordova on our top lists :
#7 on the list of "Top 101 cities with the highest maximum monthly sunshine amount (population 50,000+)"
#11 on the list of "Top 101 cities with largest percentage of males in industries: construction (population 50,000+)"
#12 on the list of "Top 101 cities with largest percentage of females in occupations: business and financial operations occupations (population 50,000+)"
#18 on the list of "Top 101 cities with the most residents born in Armenia (population 500+)"
#22 on the list of "Top 101 cities with the largest city-data.com crime index increase from 2011 to 2012 (population 50,000+)"
#27 on the list of "Top 101 cities with largest percentage of females in industries: finance and insurance (population 50,000+)"
#27 on the list of "Top 101 cities with the largest sunshine amount differences during a year (population 50,000+)"
#34 on the list of "Top 101 cities with the most residents born in Belarus (population 500+)"
#36 on the list of "Top 101 cities with largest percentage of males in occupations: community and social service occupations (population 50,000+)"
#37 on the list of "Top 101 cities with largest percentage of males in occupations: personal care and service occupations (population 50,000+)"
#38 on the list of "Top 101 cities with largest percentage of males in occupations: fire fighting and prevention workers including supervisors (population 50,000+)"
#40 on the list of "Top 101 cities with largest percentage of females in industries: public administration (population 50,000+)"
#41 on the list of "Top 101 cities with largest percentage of females in occupations: personal care and service occupations (population 50,000+)"
#45 on the list of "Top 101 cities with largest percentage of females in industries: construction (population 50,000+)"
#47 on the list of "Top 101 cities with the most residents born in Ukraine (population 500+)"
#47 on the list of "Top 101 cities with the most residents born in Other Eastern Asia (population 500+)"
#49 on the list of "Top 101 cities with largest percentage of males in occupations: construction and extraction occupations (population 50,000+)"
#53 on the list of "Top 100 most racially diverse cities (pop. 50,000+)"
#56 on the list of "Top 101 cities with the highest number of days clear of clouds (population 50,000+)"
#56 on the list of "Top 101 cities with the lowest number of days clear of clouds (population 50,000+)"
#12 on the list of "Top 101 counties with the highest percentage of residents that drank alcohol in the past 30 days"
#18 on the list of "Top 101 counties with the highest ground withdrawal of fresh water for public supply"
#19 on the list of "Top 101 counties with the highest total withdrawal of fresh water for public supply"
#23 on the list of "Top 101 counties with the most Other adherents"
#25 on the list of "Top 101 counties with the most Other congregations (pop. 50,000+)"
Top Patent Applicants
Christopher J. Kasten (17)
Mostafa Naguib Abdulla (15)
Kamal Sinha (14)
Berkat S. Tung (14)
Nicholas Hendrickson (10)
Paul J. Thadikaran (10)
Dmitri Yudanov (9)
Hiu-Fai R. Chan (8)
Dustin Kurt Adler (7)
Nikos Kaburlasos (7)
Total of 300 patent applications in 2008-2024.

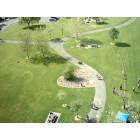


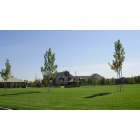
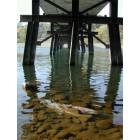
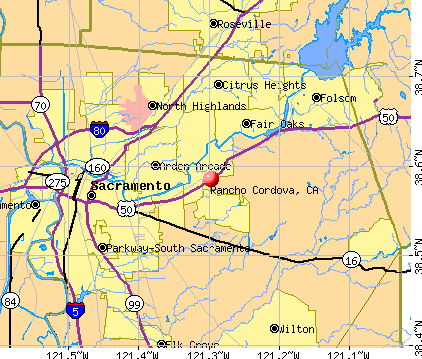


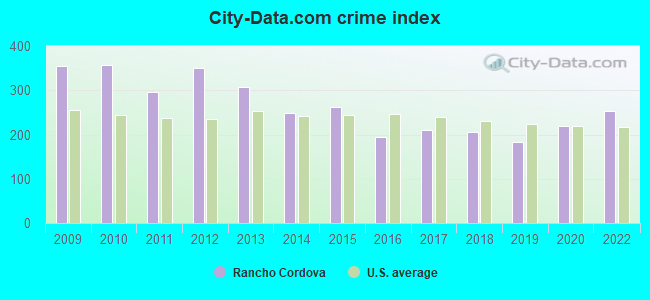
 Recent articles from our blog. Our writers, many of them Ph.D. graduates or candidates, create easy-to-read articles on a wide variety of topics.

 (9.5 miles
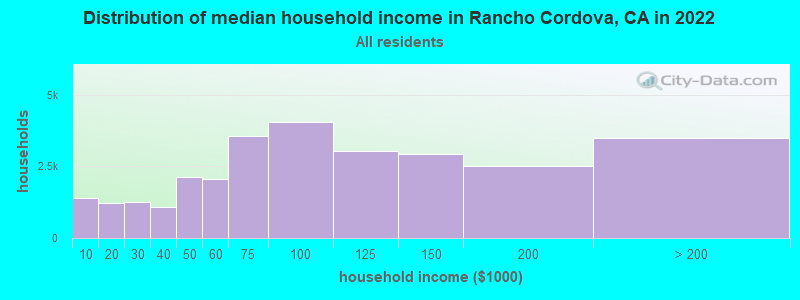
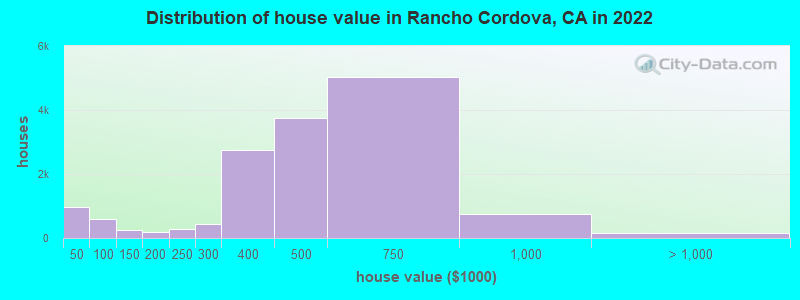

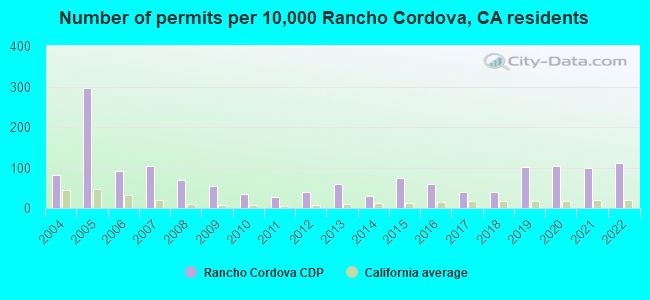
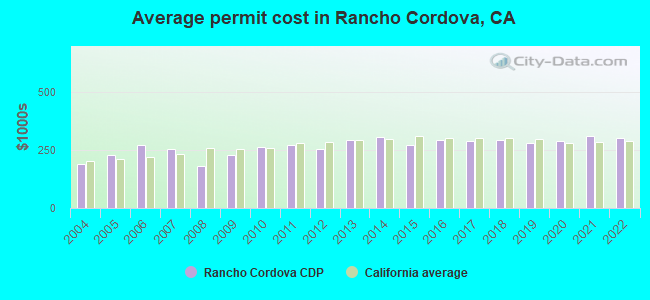
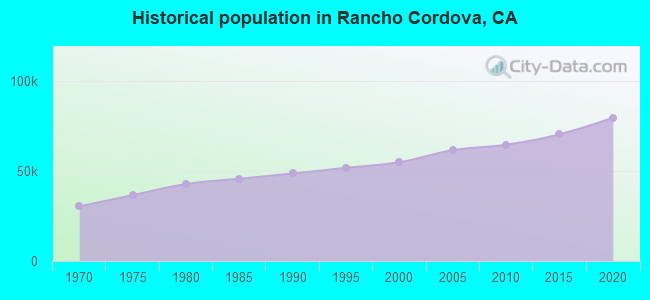
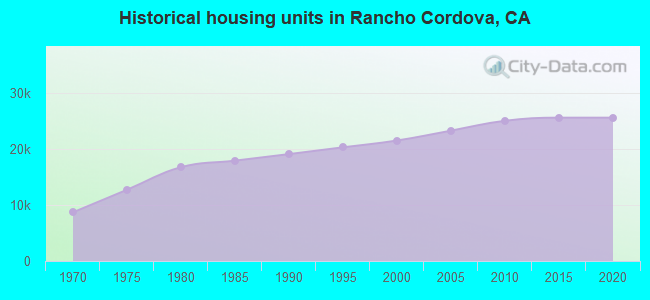
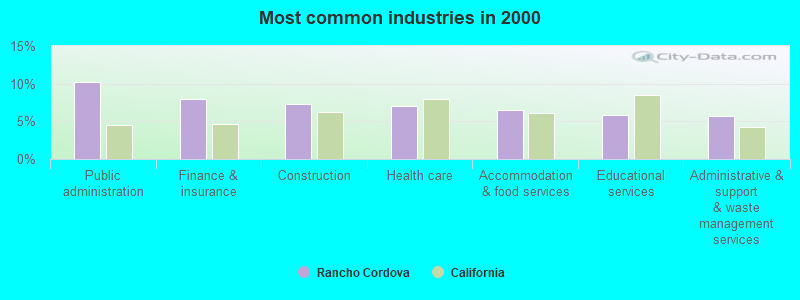
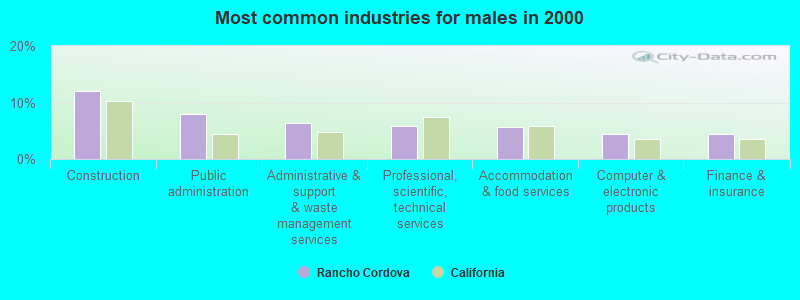
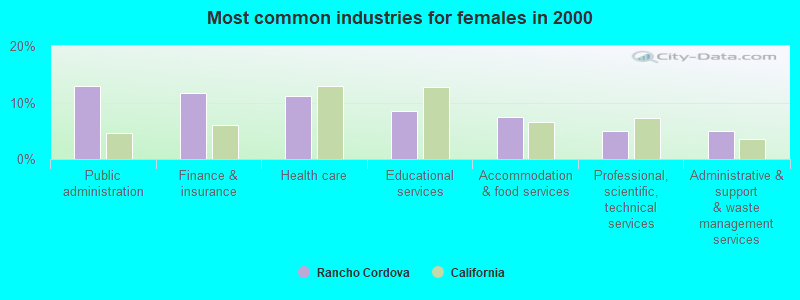
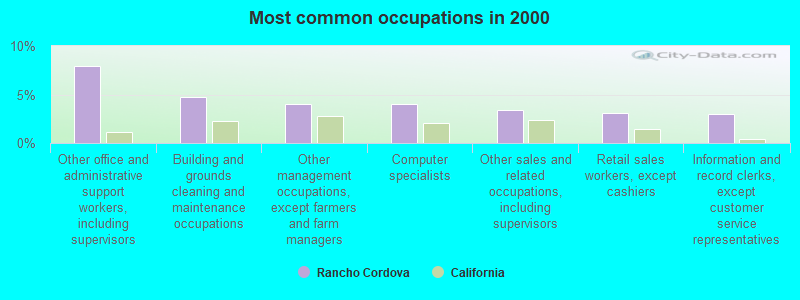
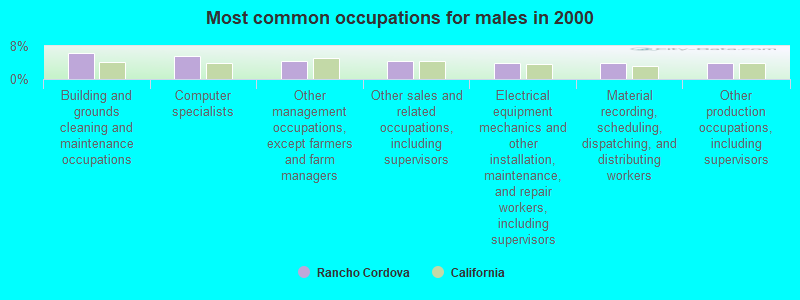
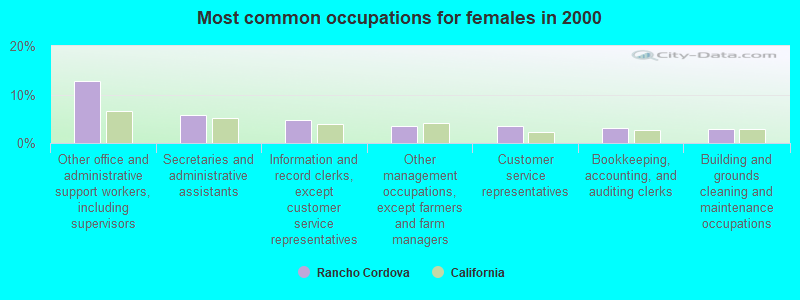


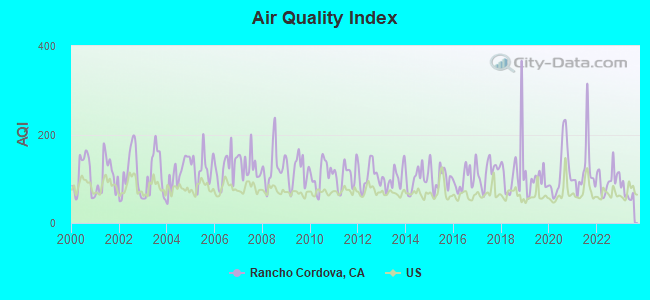
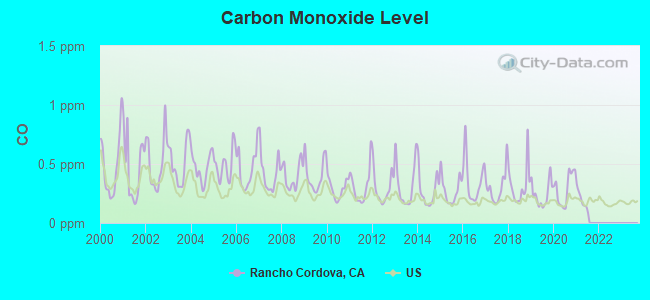

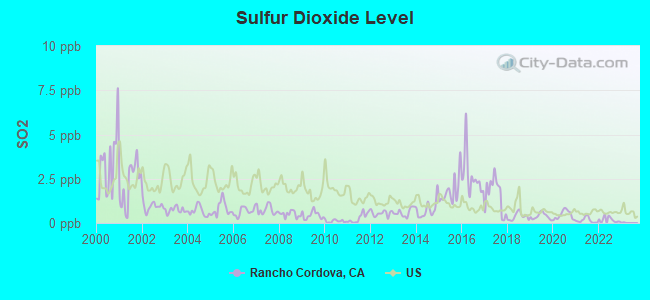
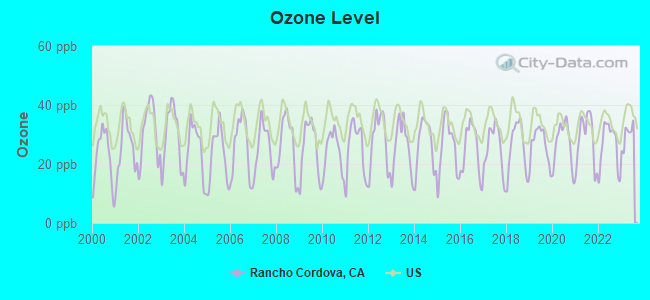
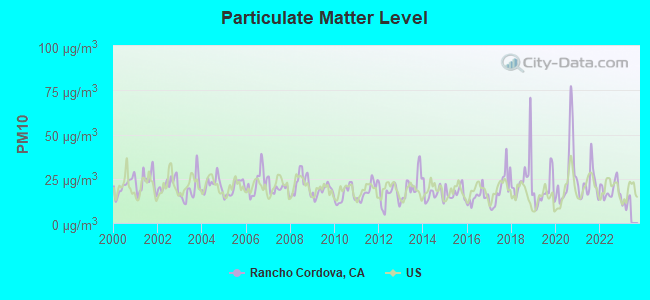
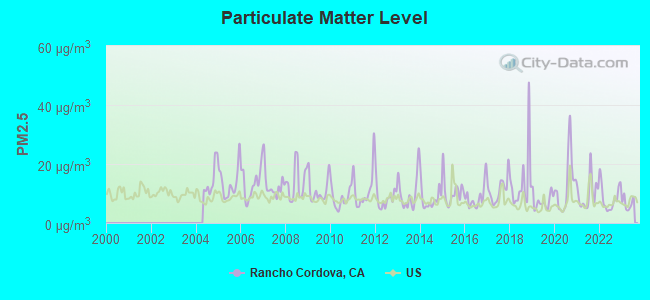
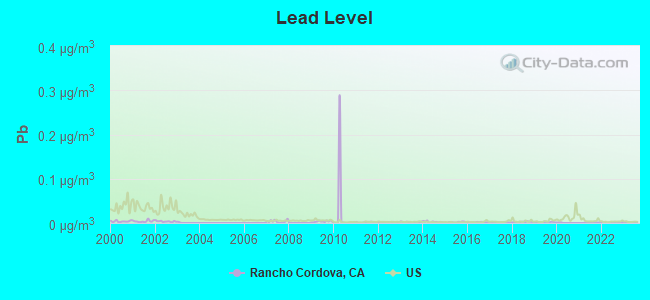

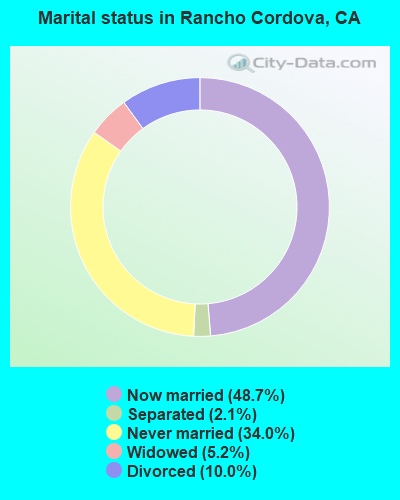
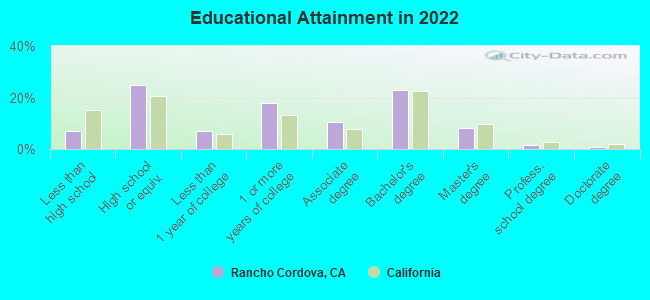
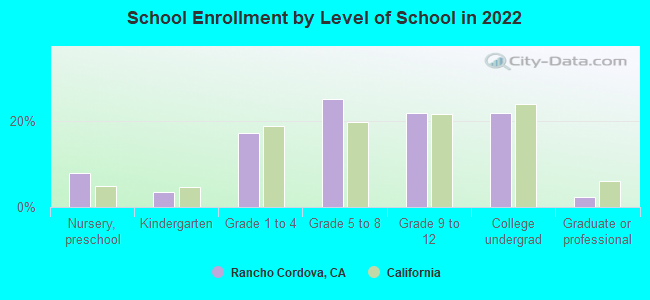
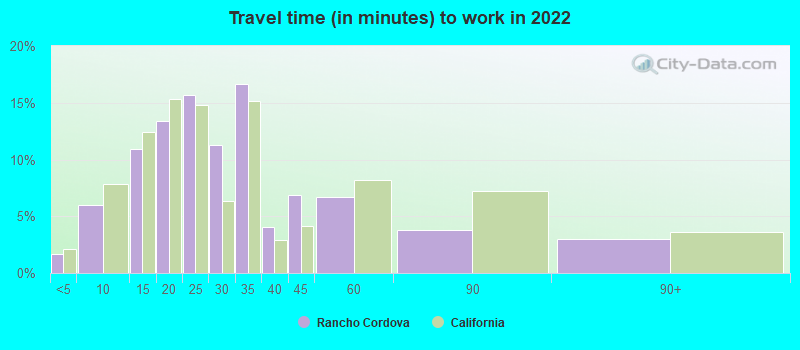
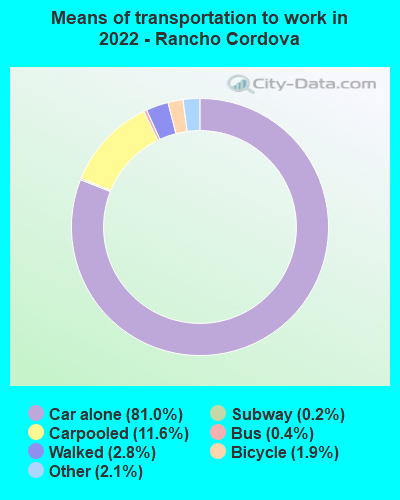
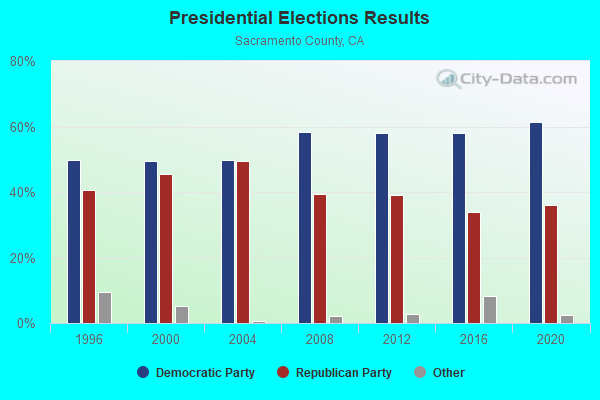
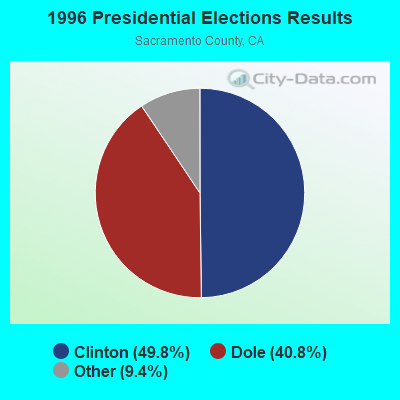
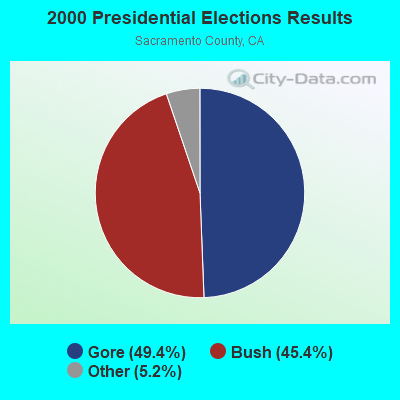
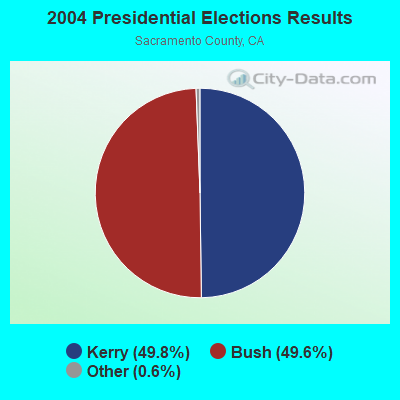
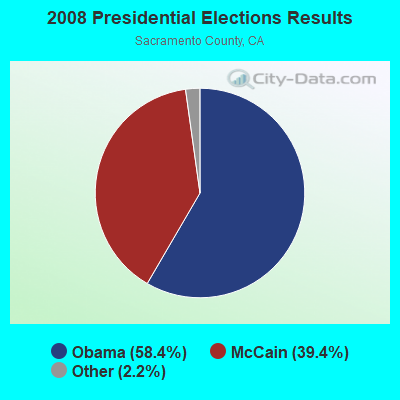
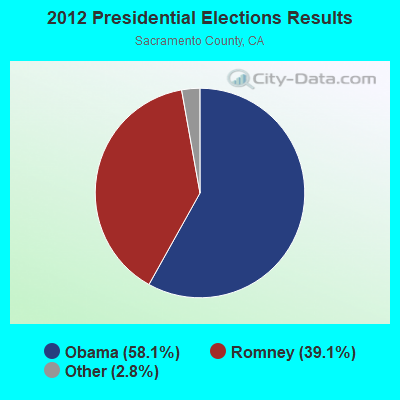
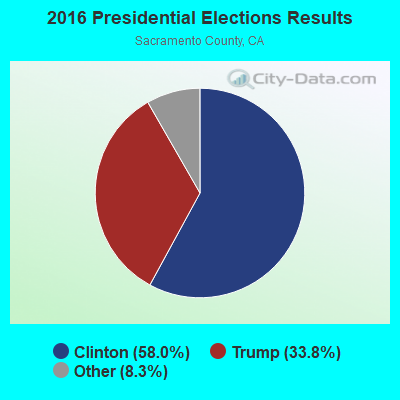
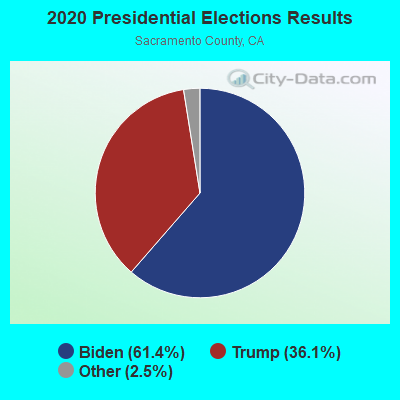
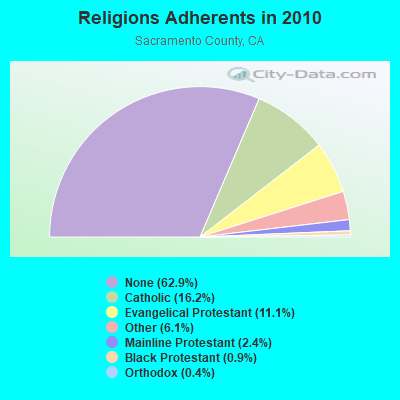
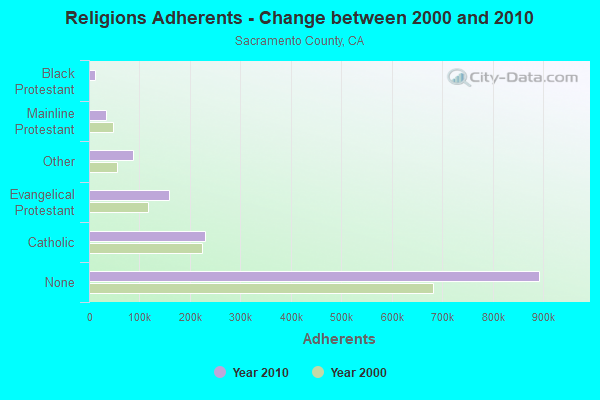

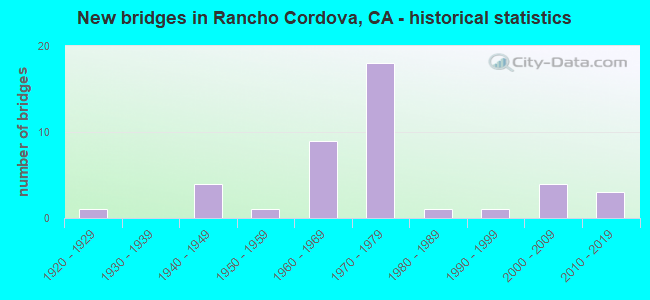
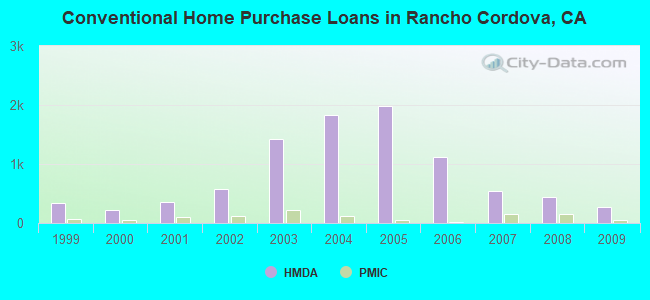
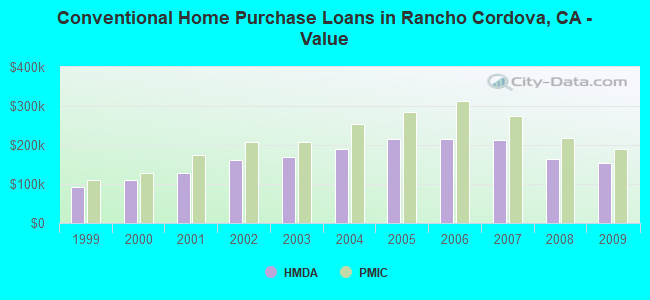
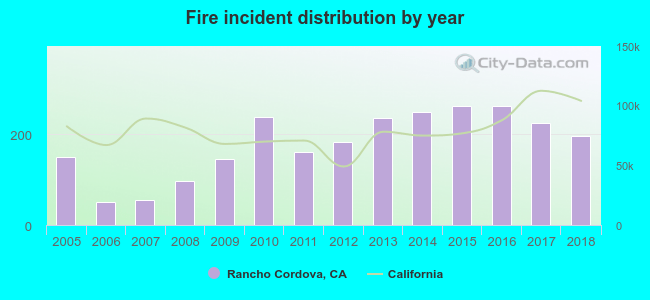 Based on the data from the years 2005 - 2018 the average number of fire incidents per year is 179. The highest number of fires - 263 took place in 2015, and the least - 50 in 2006. The data has a growing trend.
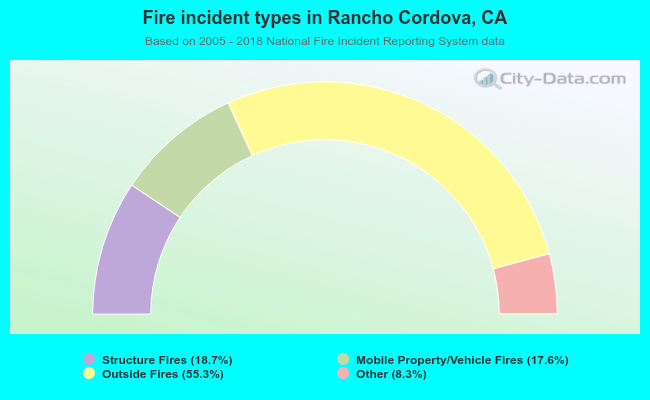 When looking into fire subcategories, the most incidents belonged to: Outside Fires (55.3%), and Structure Fires (18.7%).