Percentage of residents living in poverty in 2022: 8.6%
(6.1% for White Non-Hispanic residents, 25.6% for Black residents, 11.0% for Hispanic or Latino residents, 8.4% for other race residents, 32.2% for two or more races residents)
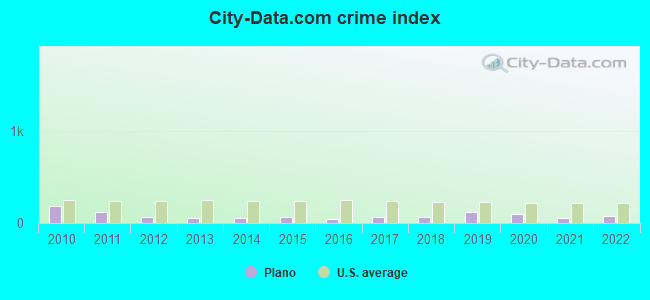
The City-Data.com crime index weighs serious crimes and violent crimes more heavily. Higher means more crime, U.S. average is 246.1. It adjusts for the number of visitors and daily workers commuting into cities.
Latest news from Plano, IL collected exclusively by city-data.com from local newspapers, TV, and radio stations
Ancestries: German (10.8%), Irish (5.6%), American (4.2%), English (3.6%), Swedish (2.8%), Norwegian (2.7%).
Current Local Time: CST time zone
Incorporated on 02/02/1884
Elevation: 650 feet
Land area: 3.51 square miles.
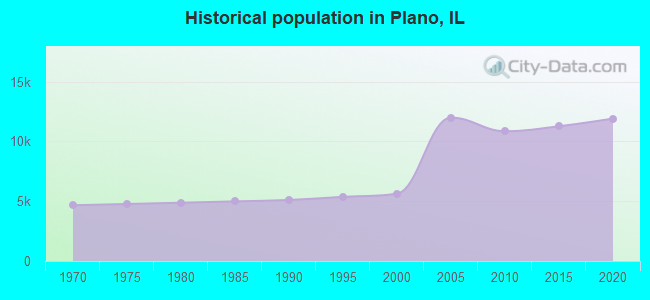
Population density: 3,550 people per square mile (average).
1,340 residents are foreign born (8.4% Latin America, 2.3% Europe).
This city:
11.7%
Illinois:
14.1%
Median real estate property taxes paid for housing units with mortgages in 2022: $5,718 (2.6%) Median real estate property taxes paid for housing units with no mortgage in 2022: $3,924 (1.8%)
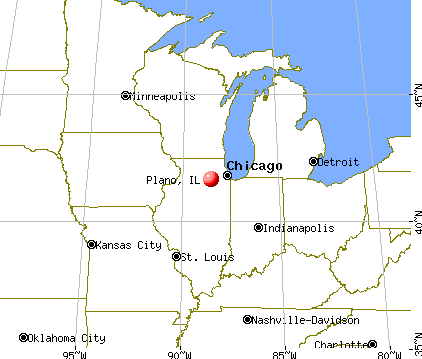
Nearest city with pop. 50,000+: Aurora, IL (14.0 miles , pop. 142,990).
Nearest city with pop. 200,000+: Chicago, IL (45.9 miles , pop. 2,896,016).
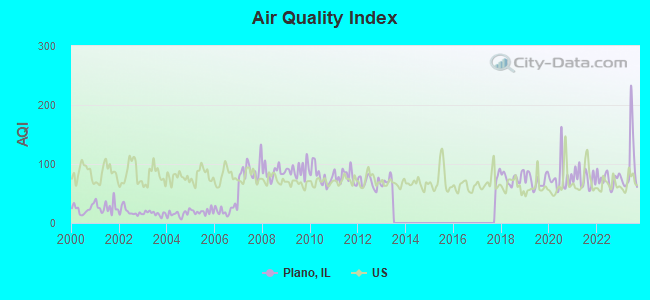
Air Quality Index (AQI) level in 2023 was 97.7. This is worse than average.
City:
97.7
U.S.:
72.6
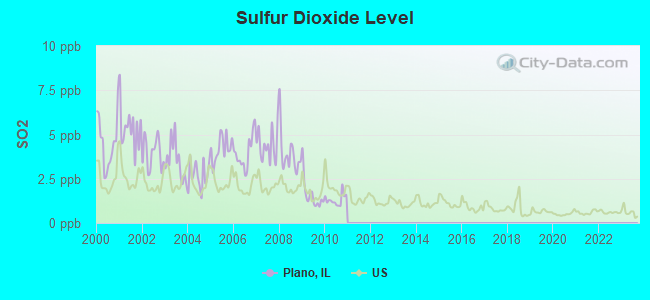
Sulfur Dioxide (SO2) [ppb] level in 2010 was 1.31. This is about average.Closest monitor was 21.5 miles away from the city center.
City:
1.31
U.S.:
1.51
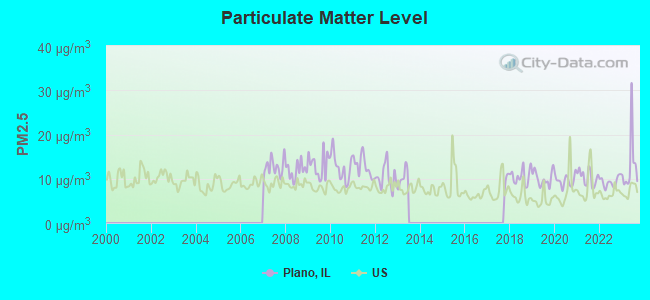
Particulate Matter (PM2.5) [µg/m3] level in 2023 was 12.9. This is significantly worse than average.Closest monitor was 13.6 miles away from the city center.
City:
12.9
U.S.:
8.1
Tornado activity:
Plano-area historical tornado activity is near Illinois state average. It is 56% greater than the overall U.S. average.
On 8/28/1990, a category F5 (max. wind speeds 261-318 mph) tornado 9.7 miles away from the Plano city center killed 29 peopleand injured 350 peopleand causedbetween $50,000 and $500,000 in damages.
On 6/13/1976, a category F4 (max. wind speeds 207-260 mph) tornado 27.7 miles away from the city center killed 2 peopleand injured 23 peopleand causedbetween $500,000 and $5,000,000 in damages.
Earthquake activity:
Plano-area historical earthquake activity is significantly above Illinois state average. It is 64% greater than the overall U.S. average.
On 4/18/2008 at 09:36:59, a magnitude 5.4 (5.1 MB, 4.8 MS, 5.4 MW, 5.2 MW, Class: Moderate, Intensity: VI - VII) earthquake occurred 224.8 miles away from Plano center On 6/10/1987 at 23:48:54, a magnitude 5.1 (4.9 MB, 4.4 MS, 4.6 MS, 5.1 LG) earthquake occurred 199.6 miles away from the city center On 4/18/2008 at 09:36:59, a magnitude 5.2 (5.2 MW, Depth: 8.9 mi) earthquake occurred 224.8 miles away from the city center On 6/28/2004 at 06:10:52, a magnitude 4.2 (4.2 MW, Depth: 6.2 mi, Class: Light, Intensity: IV - V) earthquake occurred 23.5 miles away from Plano center On 6/18/2002 at 17:37:15, a magnitude 5.0 (4.3 MB, 4.6 MW, 5.0 LG) earthquake occurred 257.4 miles away from Plano center On 2/10/2010 at 09:59:35, a magnitude 3.8 (3.8 MW, Depth: 6.2 mi, Class: Light, Intensity: II - III) earthquake occurred 21.2 miles away from the city center Magnitude types: regional Lg-wave magnitude (LG), body-wave magnitude (MB), surface-wave magnitude (MS), moment magnitude (MW)
Natural disasters:
The number of natural disasters in Kendall County (12) is smaller than the US average (15). Major Disasters (Presidential) Declared: 6 Emergencies Declared: 5
Causes of natural disasters: Floods: 5, Storms: 5, Snows: 2, Blizzard: 1, Hurricane: 1, Snowstorm: 1, Tornado: 1, Wind: 1, Winter Storm: 1, Other: 1 (Note: some incidents may be assigned to more than one category).
Hospitals and medical centers near Plano:
SANDWICH REHABILITATION AND HCC (Nursing Home, about 4 miles away; SANDWICH, IL)
YORKVILLE DIALYSIS CENTER, LLC (Dialysis Facility, about 4 miles away; YORKVILLE, IL)
HILLSIDE REHAB AND CARE CENTER (Nursing Home, about 5 miles away; YORKVILLE, IL)
VALLEY WEST COMMUNITY HOSPITAL Critical Access Hospitals (about 5 miles away; SANDWICH, IL)
FMC - SANDWICH DIALYSIS, LLC (Dialysis Facility, about 5 miles away; SANDWICH, IL)
WILLOW CREST NURSING PAVILION (Nursing Home, about 5 miles away; SANDWICH, IL)
COUNTRYSIDE CARE CENTRE (Nursing Home, about 11 miles away; AURORA, IL)
Amtrak station:
PLANO (MAIN ST. WEST OF CENTER ST.)
Colleges/universities with over 2000 students nearest to Plano:
Waubonsee Community College (about 11 miles; Sugar Grove, IL; Full-time enrollment: 7,698)
Aurora University (about 12 miles; Aurora, IL; FT enrollment: 4,596)
Joliet Junior College (about 22 miles; Joliet, IL; FT enrollment: 11,401)
North Central College (about 22 miles; Naperville, IL; FT enrollment: 2,860)
Northern Illinois University (about 23 miles; Dekalb, IL; FT enrollment: 18,126)
Lewis University (about 24 miles; Romeoville, IL; FT enrollment: 5,739)
Benedictine University (about 25 miles; Lisle, IL; FT enrollment: 5,694)
Public high schools in Plano:
PLANO HIGH SCHOOL(Students: 613, Location: 704 W ABE ST, Grades: 9-12)
FLEX PROGRAM (Location: 704 W ABE ST, Grades: 9-12)
PLANO COMMUNITY LIBRARY DISTRICT (Operating income: $1,139,976; Location: 15 WEST NORTH STREET; 40,374 books; 2,313 audio materials; 2,873 video materials; 2 local licensed databases; 17 state licensed databases; 1 other licensed databases; 83 print serial subscriptions)
User-submitted facts and corrections:
Plano Library's address has changed to 15 W. North Street, Plano, IL 60545. There is also a new webpage for them at www.plano.lib.il.us
Tourist attractions: Farnsworth House (Museums; 14520 River Road), Farnsworth House Visitor Center (Museums; 14520 River Road).
Hotels: Harvester Motel (821 West US Highway 34), Arbors B & B (209 West Charles Street).
Birthplace of: Israel A. Smith - Politician.
Kendall County has a predicted average indoor radon screening level greater than 4 pCi/L (pico curies per liter) - Highest Potential
Drinking water stations with addresses in Plano and their reported violations in the past:
FOX RANCH TAVERN (Population served: 25, Groundwater):
Past health violations:
MCL, Monthly (TCR) - In JUL-2011, Contaminant: Coliform. Follow-up actions: St Violation/Reminder Notice (JUL-27-2011), St Formal NOV issued (JUL-27-2011)
MCL, Monthly (TCR) - Between OCT-2010 and DEC-2010, Contaminant: Coliform. Follow-up actions: St Compliance achieved (DEC-27-2010), St Site Visit (enforcement) (JAN-04-2011), St Public Notif requested (JAN-04-2011), St Violation/Reminder Notice (JAN-04-2011)
MCL, Monthly (TCR) - Between JUL-2010 and SEP-2010, Contaminant: Coliform. Follow-up actions: St Formal NOV issued (JUL-06-2010), St Tech Assistance Visit (SEP-17-2010), St Site Visit (enforcement) (SEP-17-2010), St Tech Assistance Visit (OCT-22-2010), St Site Visit (enforcement) (OCT-22-2010), St Compliance achieved (NOV-03-2010)
MCL, Monthly (TCR) - Between APR-2008 and JUN-2008, Contaminant: Coliform. Follow-up actions: St Formal NOV issued (MAY-02-2008), St Compliance achieved (FEB-05-2009)
MCL, Monthly (TCR) - Between JUL-2006 and SEP-2006, Contaminant: Coliform. Follow-up actions: St Site Visit (enforcement) (OCT-24-2006), St Compliance achieved (NOV-14-2006)
Past monitoring violations:
Monitoring, Repeat Major (TCR) - Between JAN-2009 and DEC-2009, Contaminant: Coliform (TCR). Follow-up actions: St Tech Assistance Visit (JAN-28-2010), St Site Visit (enforcement) (MAR-08-2010), St Compliance achieved (MAR-10-2010)
3 routine major monitoring violations
One minor monitoring violation
Drinking water stations with addresses in Plano that have no violations reported:
WATER WAGON (Population served: 25,Primary Water Source Type: Purch groundwater)
Average household size:
This city:
3.1 people
Illinois:
2.6 people
Percentage of family households:
This city:
74.8%
Whole state:
65.8%
Percentage of households with unmarried partners:
This city:
8.8%
Whole state:
6.3%
Likely homosexual households (counted as self-reported same-sex unmarried-partner households)
Lesbian couples: 0.4% of all households
Gay men: 0.3% of all households
4 people in other noninstitutional facilities in 2010
Banks with branches in Plano (2011 data):
Citizens First National Bank: Plano Branch at 11500 E. Route 34, branch established on 2005/10/14. Info updated 2007/05/29: Bank assets: $1,031.8 mil, Deposits: $917.3 mil, headquarters in Princeton, IL, negative income in the last year, Commercial Lending Specialization, 20 total offices, Holding Company: Princeton National Bancorp, Inc.
First National Bank of Omaha: Plano Branch at 505 West Route 34, branch established on 1998/06/18. Info updated 2010/10/13: Bank assets: $13,433.1 mil, Deposits: $10,746.6 mil, headquarters in Omaha, NE, positive income, Commercial Lending Specialization, 102 total offices, Holding Company: Lauritzen Corporation
Old Second National Bank: Plano West Branch at 7050 Burroughs Avenue, branch established on 2006/12/04. Info updated 2008/03/03: Bank assets: $1,939.3 mil, Deposits: $1,741.1 mil, headquarters in Aurora, IL, positive income, Commercial Lending Specialization, 27 total offices, Holding Company: Old Second Bancorp, Inc.
Centrue Bank: Plano Branch at 15 West South Street, branch established on 1995/05/08. Info updated 2007/06/27: Bank assets: $964.9 mil, Deposits: $850.6 mil, headquarters in Streator, IL, negative income in the last year, Commercial Lending Specialization, 28 total offices, Holding Company: Centrue Financial Corporation
BMO Harris Bank National Association: 2005 West Route #34 Branch at 2005 West Route #34, branch established on 1943/10/01. Info updated 2011/07/14: Bank assets: $97,264.0 mil, Deposits: $75,624.6 mil, headquarters in Chicago, IL, positive income, 717 total offices, Holding Company: Bank Of Montreal
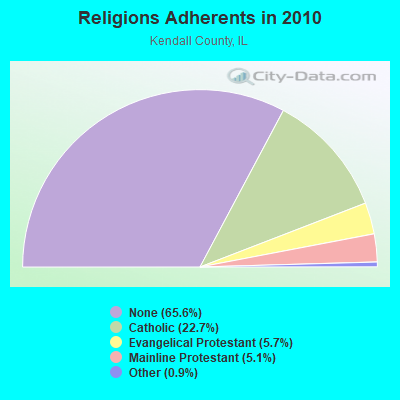
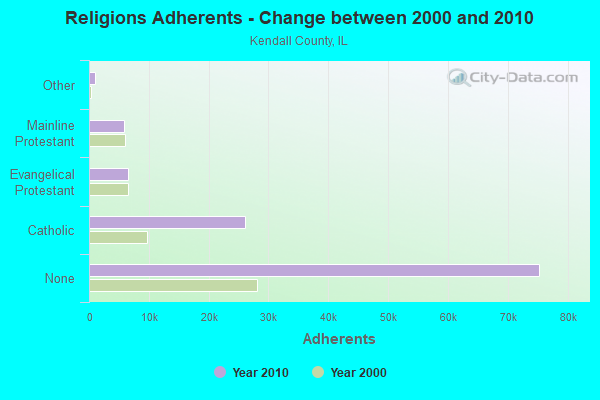
Religion statistics for Plano, IL (based on Kendall County data)
Religion
Adherents
Congregations
Catholic
26,089
4
Evangelical Protestant
6,500
31
Mainline Protestant
5,805
16
Other
1,054
4
Orthodox
-
-
None
75,288
-
Source: Clifford Grammich, Kirk Hadaway, Richard Houseal, Dale E.Jones, Alexei Krindatch, Richie Stanley and Richard H.Taylor. 2012. 2010 U.S.Religion Census: Religious Congregations & Membership Study. Association of Statisticians of American Religious Bodies. Jones, Dale E., et al. 2002. Congregations and Membership in the United States 2000. Nashville, TN: Glenmary Research Center. Graphs represent county-level data
Aircraft: ROBINSON HELICOPTER R44 (Category: Land, Seats: 4, Weight: Up to 12,499 Pounds), Engine: LYCOMING O-540-F1B5 (260 HP) (Reciprocating) N-Number: 3264U, N3264U, N-3264U, Serial Number: 1715, Airworthiness Date: 05/07/2007, Certificate Issue Date: 02/24/2020 Registrant (LLC): Tri-B Air LLC, 12318 River Rd, Plano, IL 60545 Deregistered:Cancel Date: 05/03/2018
Aircraft: BEECH 35 (Category: Land, Seats: 4, Weight: Up to 12,499 Pounds, Speed: 120 mph), Engine: CONT MOTOR E185 SERIES (205 HP) (Reciprocating) N-Number: 3300V, N3300V, N-3300V, Serial Number: D-759, Year manufactured: 1947, Airworthiness Date: 03/17/1960, Certificate Issue Date: 06/28/1989 Registrant (Co-Owned): Glenn D Jacobsen, 308 W Church St, Plano, IL 60545, Other Owners: Laura J Jacobsen
Aircraft: BEECH P35 (Category: Land, Seats: 4, Weight: Up to 12,499 Pounds, Speed: 150 mph), Engine: CONT MOTOR I0-470 SERIES (260 HP) (Reciprocating) N-Number: 351PL, N351PL, N-351PL, Serial Number: D-7302, Year manufactured: 1964, Airworthiness Date: 01/21/1964, Certificate Issue Date: 09/07/2001 Registrant (Individual): Cliff Bender, 12318 River Rd, Plano, IL 60545
Home Mortgage Disclosure Act Aggregated Statistics For Year 2009 (Based on 2 partial tracts)
A) FHA, FSA/RHS & VA Home Purchase Loans
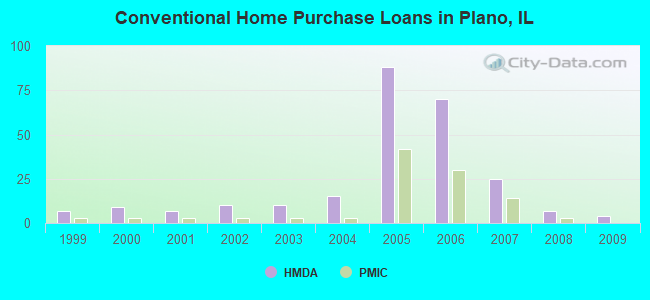
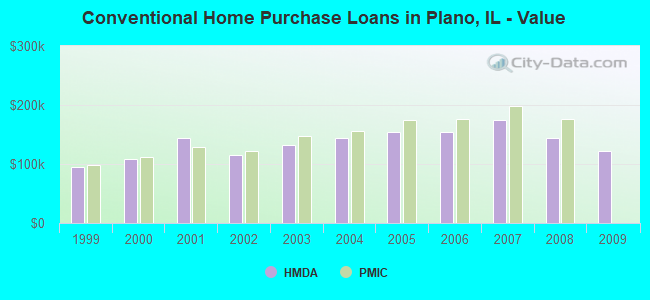
B) Conventional Home Purchase Loans
C) Refinancings
D) Home Improvement Loans
F) Non-occupant Loans on < 5 Family Dwellings (A B C & D)
Number
Average Value
Number
Average Value
Number
Average Value
Number
Average Value
Number
Average Value
LOANS ORIGINATED
12
$131,855
4
$122,650
37
$179,029
0
$0
3
$92,237
APPLICATIONS APPROVED, NOT ACCEPTED
1
$170,550
0
$0
4
$168,160
0
$0
0
$0
APPLICATIONS DENIED
3
$112,433
1
$92,140
14
$174,631
1
$40,910
0
$0
APPLICATIONS WITHDRAWN
1
$127,690
1
$81,130
8
$171,266
0
$0
0
$0
FILES CLOSED FOR INCOMPLETENESS
0
$0
0
$0
2
$214,525
0
$0
0
$0
Aggregated Statistics For Year 2008 (Based on 2 partial tracts)
A) FHA, FSA/RHS & VA Home Purchase Loans
B) Conventional Home Purchase Loans
C) Refinancings
D) Home Improvement Loans
F) Non-occupant Loans on < 5 Family Dwellings (A B C & D)
Number
Average Value
Number
Average Value
Number
Average Value
Number
Average Value
Number
Average Value
LOANS ORIGINATED
9
$174,617
7
$144,139
25
$169,807
2
$64,380
2
$114,980
APPLICATIONS APPROVED, NOT ACCEPTED
0
$0
0
$0
5
$197,508
0
$0
0
$0
APPLICATIONS DENIED
2
$180,240
1
$252,270
21
$182,435
3
$50,810
1
$93,410
APPLICATIONS WITHDRAWN
1
$141,910
1
$161,490
7
$160,821
0
$0
0
$0
FILES CLOSED FOR INCOMPLETENESS
0
$0
0
$0
1
$325,120
0
$0
0
$0
Aggregated Statistics For Year 2007 (Based on 2 partial tracts)
A) FHA, FSA/RHS & VA Home Purchase Loans
B) Conventional Home Purchase Loans
C) Refinancings
D) Home Improvement Loans
F) Non-occupant Loans on < 5 Family Dwellings (A B C & D)
Number
Average Value
Number
Average Value
Number
Average Value
Number
Average Value
Number
Average Value
LOANS ORIGINATED
11
$182,643
25
$174,724
32
$154,309
4
$36,355
4
$130,053
APPLICATIONS APPROVED, NOT ACCEPTED
0
$0
2
$188,520
6
$180,498
1
$80,740
1
$82,690
APPLICATIONS DENIED
2
$183,940
6
$161,683
24
$174,090
5
$71,102
1
$174,830
APPLICATIONS WITHDRAWN
0
$0
2
$153,845
11
$181,049
1
$130,420
1
$81,910
FILES CLOSED FOR INCOMPLETENESS
0
$0
1
$76,650
4
$190,710
0
$0
0
$0
Aggregated Statistics For Year 2006 (Based on 2 partial tracts)
A) FHA, FSA/RHS & VA Home Purchase Loans
B) Conventional Home Purchase Loans
C) Refinancings
D) Home Improvement Loans
F) Non-occupant Loans on < 5 Family Dwellings (A B C & D)
Number
Average Value
Number
Average Value
Number
Average Value
Number
Average Value
Number
Average Value
LOANS ORIGINATED
10
$177,882
70
$154,554
35
$151,624
4
$35,332
5
$112,244
APPLICATIONS APPROVED, NOT ACCEPTED
0
$0
4
$141,498
7
$165,607
1
$123,410
0
$0
APPLICATIONS DENIED
1
$188,570
9
$132,344
24
$150,138
4
$35,528
1
$149,900
APPLICATIONS WITHDRAWN
0
$0
4
$120,118
9
$167,019
0
$0
1
$129,930
FILES CLOSED FOR INCOMPLETENESS
0
$0
1
$186,720
4
$163,072
0
$0
0
$0
Aggregated Statistics For Year 2005 (Based on 2 partial tracts)
A) FHA, FSA/RHS & VA Home Purchase Loans
B) Conventional Home Purchase Loans
C) Refinancings
D) Home Improvement Loans
F) Non-occupant Loans on < 5 Family Dwellings (A B C & D)
Number
Average Value
Number
Average Value
Number
Average Value
Number
Average Value
Number
Average Value
LOANS ORIGINATED
7
$183,334
88
$153,490
27
$149,491
3
$22,303
8
$132,171
APPLICATIONS APPROVED, NOT ACCEPTED
1
$107,720
10
$143,655
3
$134,770
0
$0
1
$116,780
APPLICATIONS DENIED
1
$244,080
9
$148,881
13
$136,495
3
$49,803
1
$68,180
APPLICATIONS WITHDRAWN
0
$0
8
$140,549
7
$181,443
1
$233,470
1
$85,130
FILES CLOSED FOR INCOMPLETENESS
0
$0
1
$210,380
3
$154,347
0
$0
0
$0
Aggregated Statistics For Year 2004 (Based on 2 partial tracts)
A) FHA, FSA/RHS & VA Home Purchase Loans
B) Conventional Home Purchase Loans
C) Refinancings
D) Home Improvement Loans
F) Non-occupant Loans on < 5 Family Dwellings (A B C & D)
Number
Average Value
Number
Average Value
Number
Average Value
Number
Average Value
Number
Average Value
LOANS ORIGINATED
3
$139,867
15
$144,217
26
$139,173
2
$42,420
3
$105,613
APPLICATIONS APPROVED, NOT ACCEPTED
0
$0
3
$136,683
5
$143,742
1
$24,250
0
$0
APPLICATIONS DENIED
0
$0
2
$137,385
9
$148,621
1
$39,840
0
$0
APPLICATIONS WITHDRAWN
0
$0
2
$97,400
9
$159,920
0
$0
0
$0
FILES CLOSED FOR INCOMPLETENESS
0
$0
1
$93,890
4
$123,795
0
$0
0
$0
Aggregated Statistics For Year 2003 (Based on 2 partial tracts)
A) FHA, FSA/RHS & VA Home Purchase Loans
B) Conventional Home Purchase Loans
C) Refinancings
D) Home Improvement Loans
F) Non-occupant Loans on < 5 Family Dwellings (A B C & D)
Number
Average Value
Number
Average Value
Number
Average Value
Number
Average Value
Number
Average Value
LOANS ORIGINATED
2
$151,165
10
$131,529
50
$117,866
1
$41,300
2
$114,690
APPLICATIONS APPROVED, NOT ACCEPTED
0
$0
1
$206,390
5
$134,762
0
$0
1
$110,550
APPLICATIONS DENIED
0
$0
2
$99,980
14
$125,861
2
$18,215
1
$157,690
APPLICATIONS WITHDRAWN
0
$0
1
$200,740
10
$134,529
0
$0
1
$100,610
FILES CLOSED FOR INCOMPLETENESS
0
$0
0
$0
2
$127,010
0
$0
0
$0
Aggregated Statistics For Year 2002 (Based on 2 partial tracts)
A) FHA, FSA/RHS & VA Home Purchase Loans
B) Conventional Home Purchase Loans
C) Refinancings
D) Home Improvement Loans
F) Non-occupant Loans on < 5 Family Dwellings (A B C & D)
Number
Average Value
Number
Average Value
Number
Average Value
Number
Average Value
Number
Average Value
LOANS ORIGINATED
3
$129,803
10
$115,263
37
$123,214
1
$46,270
3
$106,133
APPLICATIONS APPROVED, NOT ACCEPTED
0
$0
1
$111,130
4
$120,265
0
$0
0
$0
APPLICATIONS DENIED
0
$0
1
$107,140
9
$115,517
2
$15,000
0
$0
APPLICATIONS WITHDRAWN
0
$0
1
$77,040
8
$122,408
0
$0
0
$0
FILES CLOSED FOR INCOMPLETENESS
0
$0
0
$0
3
$124,443
0
$0
0
$0
Aggregated Statistics For Year 2001 (Based on 2 partial tracts)
A) FHA, FSA/RHS & VA Home Purchase Loans
B) Conventional Home Purchase Loans
C) Refinancings
D) Home Improvement Loans
F) Non-occupant Loans on < 5 Family Dwellings (A B C & D)
Number
Average Value
Number
Average Value
Number
Average Value
Number
Average Value
Number
Average Value
LOANS ORIGINATED
3
$122,690
7
$144,347
27
$109,427
3
$22,240
1
$139,090
APPLICATIONS APPROVED, NOT ACCEPTED
0
$0
1
$68,080
2
$122,385
0
$0
0
$0
APPLICATIONS DENIED
0
$0
1
$93,500
7
$102,396
1
$9,930
0
$0
APPLICATIONS WITHDRAWN
0
$0
1
$137,240
7
$113,374
1
$9,350
0
$0
FILES CLOSED FOR INCOMPLETENESS
0
$0
0
$0
1
$135,870
0
$0
0
$0
Aggregated Statistics For Year 2000 (Based on 2 partial tracts)
A) FHA, FSA/RHS & VA Home Purchase Loans
B) Conventional Home Purchase Loans
C) Refinancings
D) Home Improvement Loans
F) Non-occupant Loans on < 5 Family Dwellings (A B C & D)
Number
Average Value
Number
Average Value
Number
Average Value
Number
Average Value
Number
Average Value
LOANS ORIGINATED
3
$124,283
9
$108,254
8
$91,520
3
$22,207
2
$61,360
APPLICATIONS APPROVED, NOT ACCEPTED
0
$0
0
$0
1
$107,240
1
$10,030
0
$0
APPLICATIONS DENIED
1
$75,680
1
$137,330
5
$94,420
1
$18,020
0
$0
APPLICATIONS WITHDRAWN
0
$0
1
$108,310
4
$105,825
0
$0
0
$0
FILES CLOSED FOR INCOMPLETENESS
0
$0
0
$0
1
$46,360
0
$0
0
$0
Aggregated Statistics For Year 1999 (Based on 2 partial tracts)
A) FHA, FSA/RHS & VA Home Purchase Loans
B) Conventional Home Purchase Loans
C) Refinancings
D) Home Improvement Loans
F) Non-occupant Loans on < 5 Family Dwellings (A B C & D)
Detailed PMIC statistics for the following Tracts:8905.00
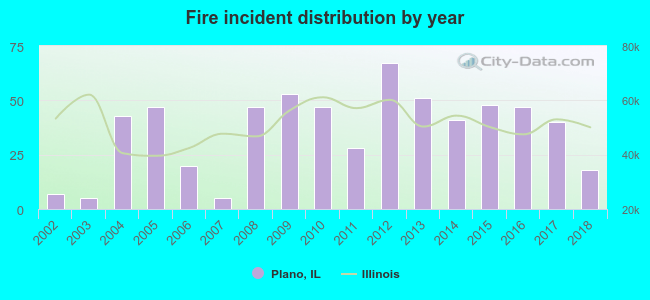
2002 - 2018 National Fire Incident Reporting System (NFIRS) incidents
According to the data from the years 2002 - 2018 the average number of fires per year is 36. The highest number of reported fires - 67 took place in 2012, and the least - 5 in 2003. The data has an increasing trend.
When looking into fire subcategories, the most incidents belonged to: Outside Fires (41.0%), and Structure Fires (39.1%).
Fire incident types reported to NFIRS in Plano, IL
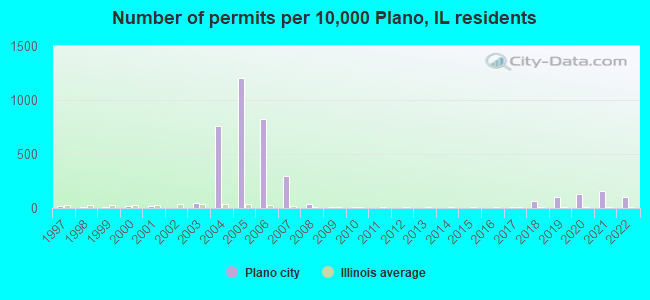
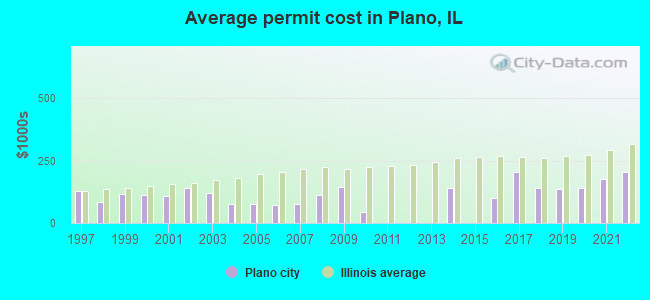
#46 on the list of "Top 101 cities with the lowest cost per building permit(population 5,000+)"
#47 on the list of "Top 101 cities with the most residents born in Middle Africa (population 500+)"
#57 on the list of "Top 101 cities with the highest number of rapes per 100,000 residents, excludes tourist destinations and others with a lot of outsiders visiting based on city industries data (population 5,000+)"
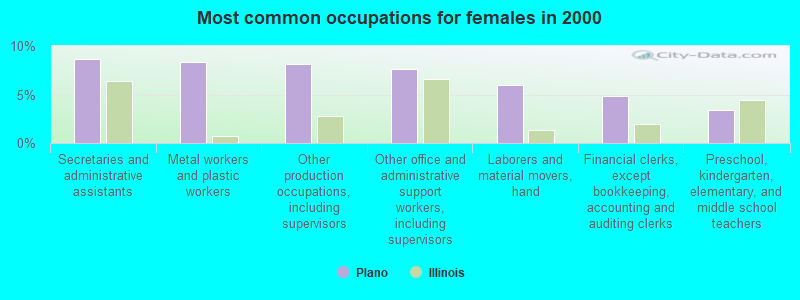
#66 on the list of "Top 101 cities with largest percentage of females in occupations: office and administrative support occupations (population 5,000+)"
#6 on the list of "Top 101 counties with the largest decrease in the number of deaths per 1000 residents 2000-2006 to 2007-2013 (pop. 50,000+)"
#7 on the list of "Top 101 counties with the lowest number of deaths per 1000 residents 2007-2013 (pop. 50,000+)"
#17 on the list of "Top 101 counties with the largest number of children under 18 without health insurance coverage in 2000 (pop. 50,000+)"
#33 on the list of "Top 101 counties with the lowest total withdrawal of fresh water for public supply (pop. 50,000+)"
#35 on the list of "Top 101 counties with the largest number of people without health insurance coverage in 2000 (pop. 50,000+)"


 Recent articles from our blog. Our writers, many of them Ph.D. graduates or candidates, create easy-to-read articles on a wide variety of topics.

 (14.0 miles


 According to the data from the years 2002 - 2018 the average number of fires per year is 36. The highest number of reported fires - 67 took place in 2012, and the least - 5 in 2003. The data has an increasing trend.
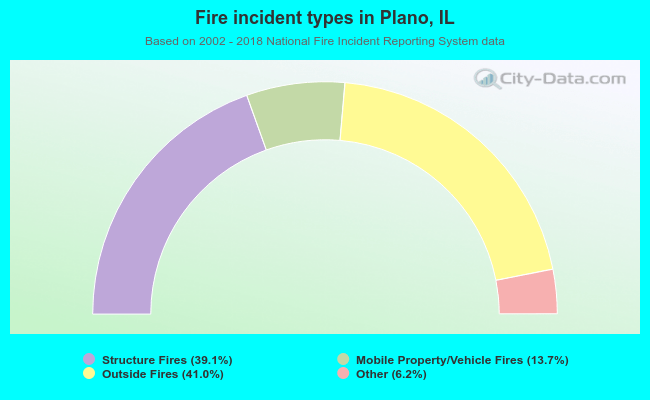 When looking into fire subcategories, the most incidents belonged to: Outside Fires (41.0%), and Structure Fires (39.1%).