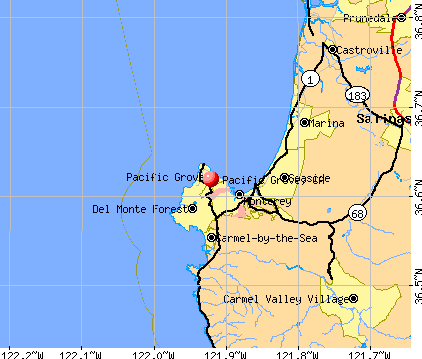
Pacific Grove, California
Pacific Grove: Sunrise at Pacific Grove
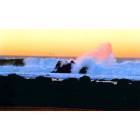
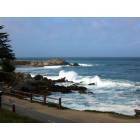
Pacific Grove: pg wave
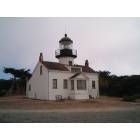
Pacific Grove: Point Pinos Lighthouse
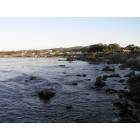
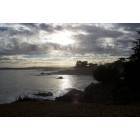
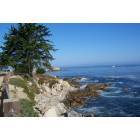
Pacific Grove: Coast views of Pacific Grove_3
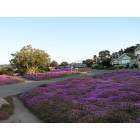
Pacific Grove: Colors of Pacific Grove_2
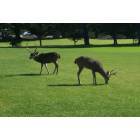
Pacific Grove: Deer that roam through Pacific Grove
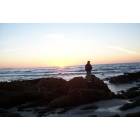
Pacific Grove: Sunset from Pacific Grove shores
Pacific Grove: View from walking trail
Pacific Grove: Pacific Grove CA Surfside Walk
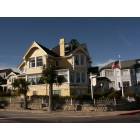
Pacific Grove: Victorian Home overlooking the Pacific
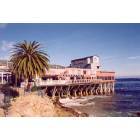
Pacific Grove: Cannery overlooking Monterey Bay
- see
29
more - add
your
Submit your own pictures of this city and show them to the world
- OSM Map
- General Map
- Google Map
- MSN Map
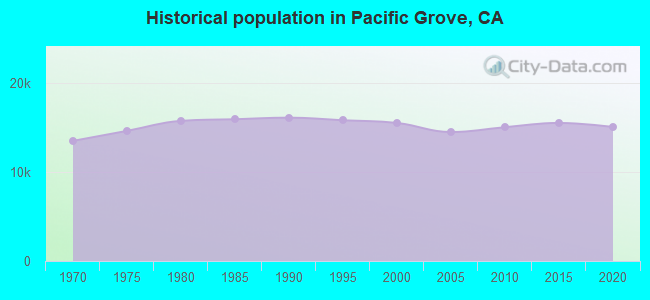
Population change since 2000: -4.7%
 |
| Males: 6,559 | |
| Females: 8,232 |
| Median resident age: | 50.2 years |
| California median age: | 37.9 years |
Zip codes: 93950.
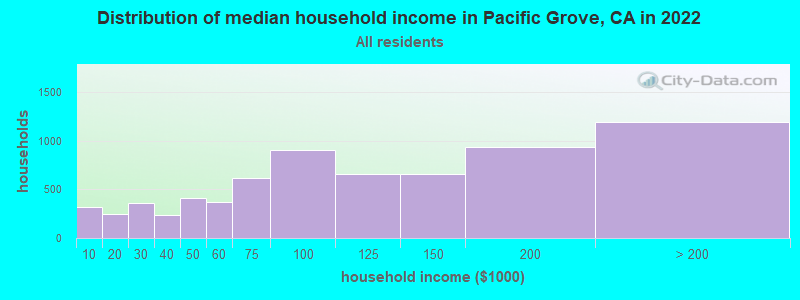
| Pacific Grove: | $104,577 |
| CA: | $91,551 |
Estimated per capita income in 2022: $63,098 (it was $31,277 in 2000)
Pacific Grove city income, earnings, and wages data
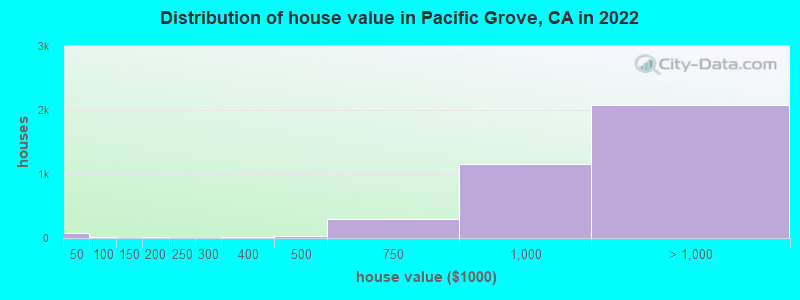
Estimated median house or condo value in 2022: over $1,000,000 (it was $418,000 in 2000)
| Pacific Grove: | over $1,000,000 |
| CA: | $715,900 |
Mean prices in 2022: all housing units: over $1,000,000; detached houses: over $1,000,000; townhouses or other attached units: over $1,000,000; in 2-unit structures: over $1,000,000; in 3-to-4-unit structures: over $1,000,000; in 5-or-more-unit structures: $436,703; mobile homes: $693,169
Median gross rent in 2022: $2,346.
(6.5% for White Non-Hispanic residents, 12.9% for Black residents, 5.2% for Hispanic or Latino residents, 3.0% for other race residents, 16.0% for two or more races residents)
Detailed information about poverty and poor residents in Pacific Grove, CA

Compare current foreclosures near Pacific Grove, CA:
| Photo | Address | Area | Beds / Baths | Price | Details |
|---|---|---|---|---|---|

|
#1
Junipero Ave
Pacific Grove, CA 93950
|
1,640 sq. feet
|
2 baths 3 beds |
show details | |

|
#2
Shell Ave
Pacific Grove, CA 93950
|
1,916 sq. feet
|
2 baths 4 beds |
show details | |

|
#3
2nd St
Pacific Grove, CA 93950
|
998 sq. feet
|
1 baths 2 beds |
show details | |

|
#4
Pine Ave
Pacific Grove, CA 93950
|
900 sq. feet
|
1 baths 2 beds |
show details | |

|
#5
Central Ave
Pacific Grove, CA 93950
|
1,012 sq. feet
|
1 baths 2 beds |
show details | |

|
#6
Lawton Ave
Pacific Grove, CA 93950
|
638 sq. feet
|
1 baths 2 beds |
show details | |

|
#7
Willow St
Pacific Grove, CA 93950
|
1,710 sq. feet
|
1 baths 3 beds |
show details | |

|
#8
17th St
Pacific Grove, CA 93950
|
- sq. feet
|
1 baths 2 beds |
show details | |

|
#9
Pacific Grove Ln Apt 6
Pacific Grove, CA 93950
|
- sq. feet
|
- baths - beds |
show details | |

|
#10
Melrose St
Pacific Grove, CA 93950
|
- sq. feet
|
- baths - beds |
show details |
| Photo | Address | Area | Beds / Baths | Price | Details |
|---|---|---|---|---|---|

|
#11
Lighthouse Ave Apt 212
Pacific Grove, CA 93950
|
- sq. feet
|
- baths - beds |
show details | |

|
#12
Forest Ave Apt A
Pacific Grove, CA 93950
|
- sq. feet
|
- baths - beds |
show details | |

|
#13
Grand Ave
Pacific Grove, CA 93950
|
- sq. feet
|
- baths - beds |
show details | |

|
#14
Gibson Ave
Pacific Grove, CA 93950
|
- sq. feet
|
- baths - beds |
show details | |

|
#15
Pedersen Ct
Pacific Grove, CA 93950
|
- sq. feet
|
- baths - beds |
show details | |

|
#16
Jewell Ave
Pacific Grove, CA 93950
|
- sq. feet
|
- baths - beds |
show details | |

|
#17
Walnut St
Pacific Grove, CA 93950
|
- sq. feet
|
- baths - beds |
show details | |

|
#18
Lighthouse Ave Apt 112
Pacific Grove, CA 93950
|
- sq. feet
|
- baths - beds |
show details | |

|
#19
Via Linda
Castroville, CA 95012
|
1,688 sq. feet
|
3 baths 4 beds |
show details | |

|
#20
Coliseum Ln
Marina, CA 93933
|
1,866 sq. feet
|
3 baths 3 beds |
show details |
| Photo | Address | Area | Beds / Baths | Price | Details |
|---|---|---|---|---|---|

|
#21
La Rancheria
Carmel Valley, CA 93924
|
2,993 sq. feet
|
2 baths 3 beds |
show details | |

|
#22
Preston St
Castroville, CA 95012
|
784 sq. feet
|
1 baths 1 beds |
show details | |

|
#23
Weston Ridge Rd
Carmel, CA 93923
|
590 sq. feet
|
1 baths 1 beds |
show details | |

|
#24
Lemos Ave
Salinas, CA 93901
|
1,152 sq. feet
|
2 baths 3 beds |
show details | |

|
#25
Davis St
Castroville, CA 95012
|
1,388 sq. feet
|
2 baths 4 beds |
show details | |

|
#26
Primavera Way
Salinas, CA 93901
|
1,787 sq. feet
|
2 baths 3 beds |
show details | |

|
#27
Legends Ct
Salinas, CA 93908
|
3,821 sq. feet
|
4 baths 5 beds |
show details | |

|
#28
Yankee Point Dr
Carmel, CA 93923
|
6,317 sq. feet
|
4 baths 5 beds |
show details | |

|
#29
Rancho Fiesta Rd
Carmel Valley, CA 93924
|
936 sq. feet
|
1 baths 2 beds |
show details | |

|
#30
Mescal St
Seaside, CA 93955
|
1,800 sq. feet
|
2 baths 3 beds |
show details |
| Photo | Address | Area | Beds / Baths | Price | Details |
|---|---|---|---|---|---|

|
#31
Center St Apt 2
Carmel, CA 93923
|
1,017 sq. feet
|
2 baths 2 beds |
show details | |

|
#32
Elinore Pl
Carmel, CA 93923
|
2,707 sq. feet
|
2 baths 3 beds |
show details | |

|
#33
Belavida Rd
Monterey, CA 93940
|
5,790 sq. feet
|
5 baths 5 beds |
show details | |

|
#34
Ocean Ter
Marina, CA 93933
|
2,360 sq. feet
|
2 baths 4 beds |
show details | |

|
#35
Pine Way
Carmel, CA 93923
|
1,723 sq. feet
|
2 baths 3 beds |
show details | |

|
#36
Hillcrest Ave
Marina, CA 93933
|
1,903 sq. feet
|
2 baths 3 beds |
show details | |

|
#37
Granada St
Seaside, CA 93955
|
1,784 sq. feet
|
2 baths 3 beds |
show details | |

|
#38
Valley View Ave
Carmel, CA 93923
|
3,282 sq. feet
|
4 baths 3 beds |
show details | |

|
#39
Fulton Way
Salinas, CA 93907
|
1,248 sq. feet
|
2 baths 3 beds |
show details | |

|
#40
Mescal St
Seaside, CA 93955
|
1,747 sq. feet
|
2 baths 3 beds |
show details |
| Photo | Address | Area | Beds / Baths | Price | Details |
|---|---|---|---|---|---|

|
#41
Ancon St
Seaside, CA 93955
|
1,668 sq. feet
|
2 baths 3 beds |
show details | |

|
#42
Highland St
Seaside, CA 93955
|
1,616 sq. feet
|
2 baths 3 beds |
show details | |

|
#43
W Alisal St
Salinas, CA 93901
|
2,122 sq. feet
|
1 baths 3 beds |
show details | |

|
#44
La Mirada Ct
Salinas, CA 93901
|
2,013 sq. feet
|
2 baths 3 beds |
show details | |

|
#45
Stonegate
Salinas, CA 93908
|
1,394 sq. feet
|
2 baths 3 beds |
show details | |

|
#46
Century Oak Rd
Salinas, CA 93907
|
2,026 sq. feet
|
2 baths 4 beds |
show details | |

|
#47
Zinfandel Way
Salinas, CA 93906
|
1,774 sq. feet
|
2 baths 3 beds |
show details | |

|
#48
Saint Edwards Dr
Salinas, CA 93905
|
1,121 sq. feet
|
2 baths 3 beds |
show details | |

|
#49
Circle Pl
Salinas, CA 93905
|
1,256 sq. feet
|
2 baths 4 beds |
show details | |

|
Check over 1 million property listings on Foreclosure.com!
|
browse all offers | |||


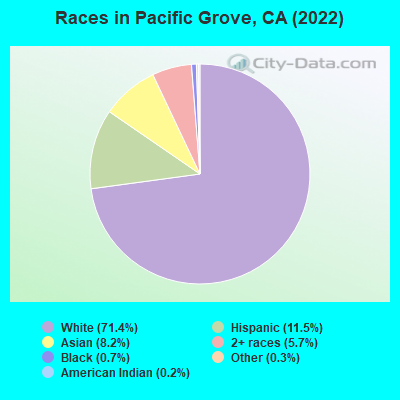
- 10,66071.4%White alone
- 1,71211.5%Hispanic
- 1,2198.2%Asian alone
- 8495.7%Two or more races
- 1020.7%Black alone
- 470.3%Other race alone
- 340.2%American Indian alone
- 40.03%Native Hawaiian and Other
Pacific Islander alone
According to our research of California and other state lists, there were 12 registered sex offenders living in Pacific Grove, California as of June 03, 2024.
The ratio of all residents to sex offenders in Pacific Grove is 1,311 to 1.
The ratio of registered sex offenders to all residents in this city is lower than the state average.
Type |
2009 |
2010 |
2011 |
2012 |
2013 |
2014 |
2015 |
2016 |
2017 |
2018 |
2019 |
2020 |
2021 |
2022 |
|---|---|---|---|---|---|---|---|---|---|---|---|---|---|---|
| Murders (per 100,000) | 1 (6.9) | 1 (6.6) | 0 (0.0) | 0 (0.0) | 0 (0.0) | 0 (0.0) | 0 (0.0) | 0 (0.0) | 0 (0.0) | 0 (0.0) | 0 (0.0) | 0 (0.0) | 0 (0.0) | 0 (0.0) |
| Rapes (per 100,000) | 6 (41.4) | 2 (13.3) | 0 (0.0) | 4 (25.9) | 2 (12.9) | 6 (38.4) | 1 (6.4) | 5 (31.7) | 8 (50.9) | 9 (57.0) | 1 (6.4) | 11 (71.2) | 2 (13.1) | 0 (0.0) |
| Robberies (per 100,000) | 3 (20.7) | 2 (13.3) | 3 (19.7) | 7 (45.3) | 7 (45.1) | 1 (6.4) | 3 (19.1) | 2 (12.7) | 0 (0.0) | 2 (12.7) | 1 (6.4) | 3 (19.4) | 1 (6.5) | 1 (6.7) |
| Assaults (per 100,000) | 13 (89.6) | 12 (79.8) | 21 (138.0) | 16 (103.6) | 13 (83.8) | 23 (147.3) | 3 (19.1) | 2 (12.7) | 8 (50.9) | 12 (76.0) | 12 (76.9) | 13 (84.1) | 20 (130.5) | 12 (80.5) |
| Burglaries (per 100,000) | 120 (827.5) | 123 (817.8) | 104 (683.4) | 97 (628.4) | 84 (541.3) | 49 (313.9) | 51 (324.1) | 47 (297.6) | 55 (350.0) | 44 (278.7) | 27 (173.0) | 24 (155.3) | 63 (411.2) | 13 (87.2) |
| Thefts (per 100,000) | 315 (2,172) | 270 (1,795) | 184 (1,209) | 147 (952.3) | 207 (1,334) | 229 (1,467) | 219 (1,392) | 249 (1,576) | 249 (1,584) | 252 (1,596) | 136 (871.5) | 191 (1,236) | 175 (1,142) | 100 (671.1) |
| Auto thefts (per 100,000) | 14 (96.5) | 8 (53.2) | 9 (59.1) | 5 (32.4) | 17 (109.6) | 23 (147.3) | 18 (114.4) | 22 (139.3) | 20 (127.3) | 16 (101.3) | 6 (38.4) | 8 (51.8) | 9 (58.7) | 3 (20.1) |
| Arson (per 100,000) | 2 (13.8) | 2 (13.3) | 3 (19.7) | 1 (6.5) | 5 (32.2) | 3 (19.2) | 0 (0.0) | 2 (12.7) | 0 (0.0) | 0 (0.0) | 0 (0.0) | 0 (0.0) | 0 (0.0) | 0 (0.0) |
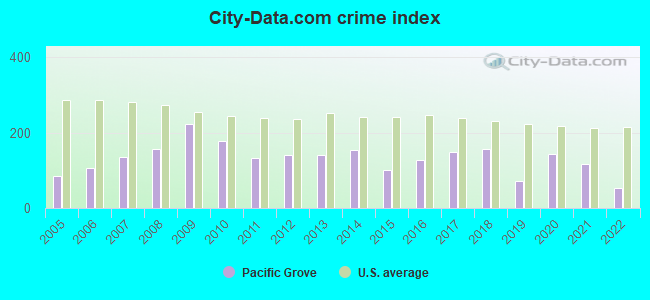
| City-Data.com crime index | 223.6 | 177.2 | 134.4 | 139.7 | 140.6 | 154.6 | 102.1 | 126.7 | 149.0 | 156.1 | 72.5 | 144.1 | 117.7 | 52.7 |
The City-Data.com crime index weighs serious crimes and violent crimes more heavily. Higher means more crime, U.S. average is 246.1. It adjusts for the number of visitors and daily workers commuting into cities.
Crime rate in Pacific Grove detailed stats: murders, rapes, robberies, assaults, burglaries, thefts, arson
Full-time law enforcement employees in 2021, including police officers: 31 (19 officers - 13 male; 6 female).
| Officers per 1,000 residents here: | 1.24 |
| California average: | 2.30 |
 Recent articles from our blog. Our writers, many of them Ph.D. graduates or candidates, create easy-to-read articles on a wide variety of topics.

 | Attending HS in Pacific Grove (9 replies) |
| Seaside towns with housing for $1.5M or less? (10 replies) |
| Best eats in Pacific Grove/Monterey/Carmel Area (3 replies) |
| Looking for a place to stay to cut trip in half (28 replies) |
| Living in Monterey: COL, Crime, Elitism & Racial relations (27 replies) |
| Rental inventory in Pacific Grove/Carmel (3 replies) |
Latest news from Pacific Grove, CA collected exclusively by city-data.com from local newspapers, TV, and radio stations
Ancestries: American (8.1%), English (7.3%), Irish (7.1%), German (6.9%), European (4.3%), Italian (4.0%).
Current Local Time: PST time zone
Elevation: 125 feet
Land area: 2.87 square miles.
Population density: 5,145 people per square mile (average).
1,975 residents are foreign born (5.5% Asia, 3.9% Europe, 2.6% Latin America).
| This city: | 13.2% |
| California: | 26.5% |
Median real estate property taxes paid for housing units with mortgages in 2022: $7,085 (0.6%)
Median real estate property taxes paid for housing units with no mortgage in 2022: $5,154 (0.4%)
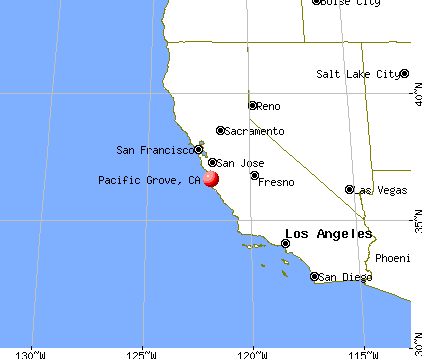
Nearest city with pop. 50,000+: Salinas, CA  (16.1 miles , pop. 151,060).
Nearest city with pop. 200,000+: San Jose, CA (47.5 miles , pop. 894,943).
Nearest city with pop. 1,000,000+: Los Angeles, CA (265.8 miles , pop. 3,694,820).
Nearest cities:
), ), Latitude: 36.62 N, Longitude: 121.92 W
Daytime population change due to commuting: -1,741 (-11.7%)
Workers who live and work in this city: 2,569 (37.1%)
Area code commonly used in this area: 831
Property values in Pacific Grove, CA
Pacific Grove tourist attractions:
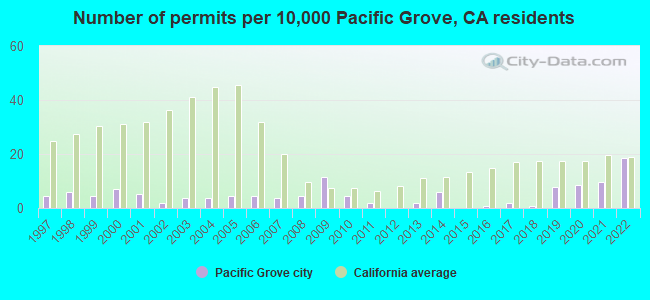
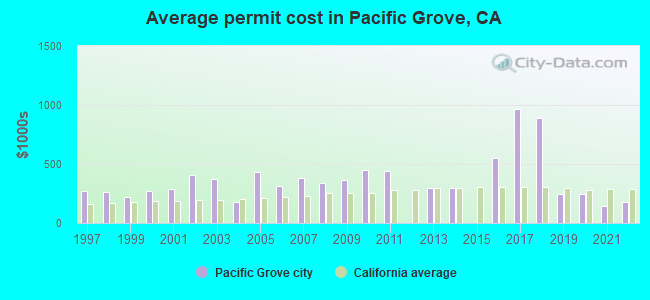
Single-family new house construction building permits:
- 2022: 29 buildings, average cost: $176,200
- 2021: 15 buildings, average cost: $142,100
- 2020: 13 buildings, average cost: $249,500
- 2019: 12 buildings, average cost: $249,500
- 2018: 1 building, cost: $890,000
- 2017: 3 buildings, average cost: $966,700
- 2016: 1 building, cost: $550,600
- 2014: 9 buildings, average cost: $296,600
- 2013: 3 buildings, average cost: $300,000
- 2011: 3 buildings, average cost: $442,800
- 2010: 7 buildings, average cost: $446,100
- 2009: 18 buildings, average cost: $363,000
- 2008: 7 buildings, average cost: $337,200
- 2007: 6 buildings, average cost: $382,200
- 2006: 7 buildings, average cost: $315,700
- 2005: 7 buildings, average cost: $431,000
- 2004: 6 buildings, average cost: $177,000
- 2003: 6 buildings, average cost: $376,200
- 2002: 3 buildings, average cost: $403,300
- 2001: 8 buildings, average cost: $289,400
- 2000: 11 buildings, average cost: $271,800
- 1999: 7 buildings, average cost: $218,300
- 1998: 9 buildings, average cost: $262,100
- 1997: 7 buildings, average cost: $269,700
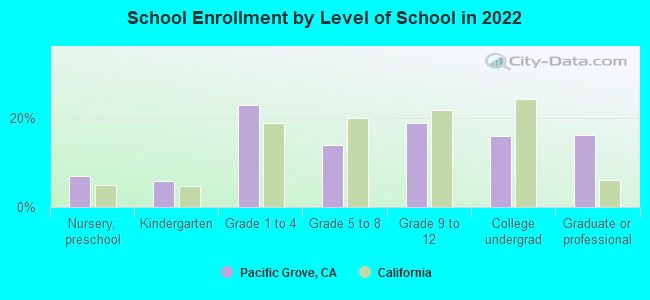
| Here: | 8.6% |
| California: | 5.1% |
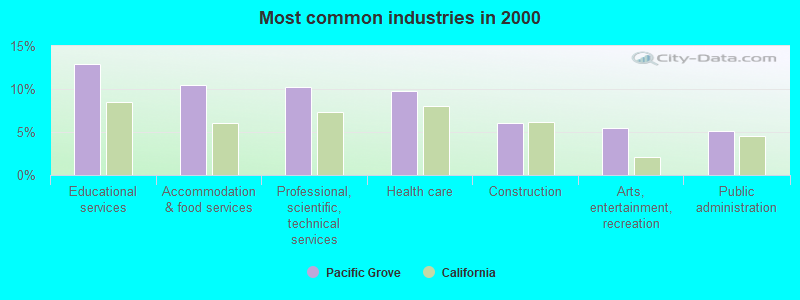
- Educational services (13.0%)
- Accommodation & food services (10.5%)
- Professional, scientific, technical services (10.2%)
- Health care (9.8%)
- Construction (6.0%)
- Arts, entertainment, recreation (5.5%)
- Public administration (5.1%)
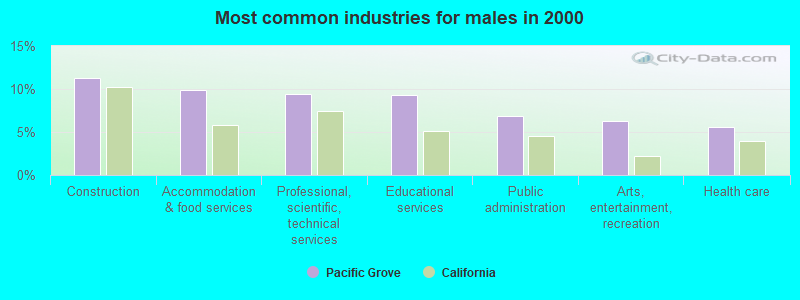
- Construction (11.3%)
- Accommodation & food services (9.9%)
- Professional, scientific, technical services (9.4%)
- Educational services (9.3%)
- Public administration (6.9%)
- Arts, entertainment, recreation (6.3%)
- Health care (5.6%)
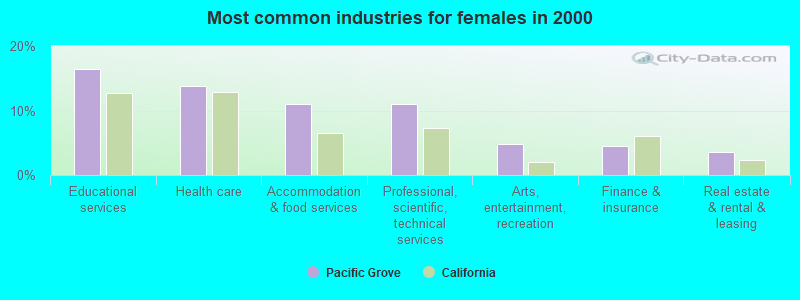
- Educational services (16.4%)
- Health care (13.8%)
- Accommodation & food services (11.1%)
- Professional, scientific, technical services (11.0%)
- Arts, entertainment, recreation (4.8%)
- Finance & insurance (4.5%)
- Real estate & rental & leasing (3.5%)
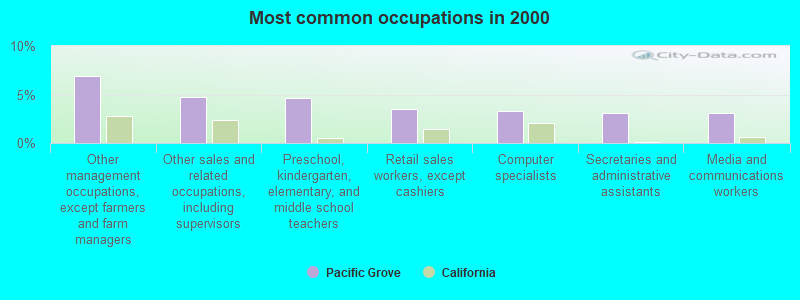
- Other management occupations, except farmers and farm managers (6.9%)
- Other sales and related occupations, including supervisors (4.8%)
- Preschool, kindergarten, elementary, and middle school teachers (4.6%)
- Retail sales workers, except cashiers (3.5%)
- Computer specialists (3.3%)
- Secretaries and administrative assistants (3.1%)
- Media and communications workers (3.1%)
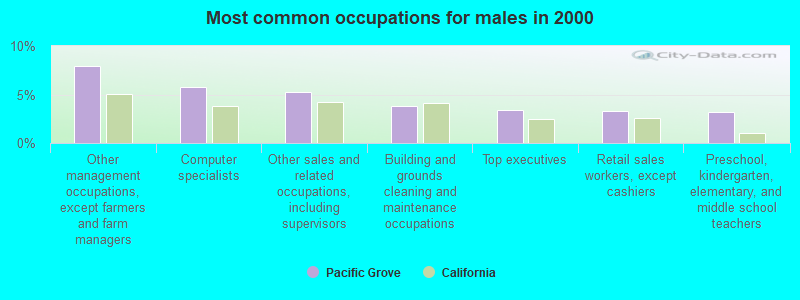
- Other management occupations, except farmers and farm managers (7.9%)
- Computer specialists (5.7%)
- Other sales and related occupations, including supervisors (5.2%)
- Building and grounds cleaning and maintenance occupations (3.8%)
- Top executives (3.4%)
- Retail sales workers, except cashiers (3.3%)
- Preschool, kindergarten, elementary, and middle school teachers (3.1%)
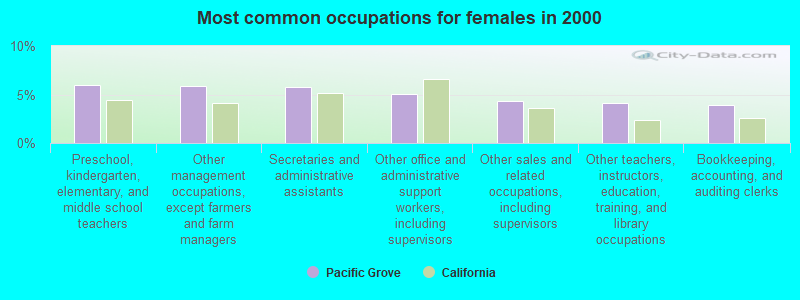
- Preschool, kindergarten, elementary, and middle school teachers (6.0%)
- Other management occupations, except farmers and farm managers (5.9%)
- Secretaries and administrative assistants (5.8%)
- Other office and administrative support workers, including supervisors (5.0%)
- Other sales and related occupations, including supervisors (4.4%)
- Other teachers, instructors, education, training, and library occupations (4.1%)
- Bookkeeping, accounting, and auditing clerks (3.9%)
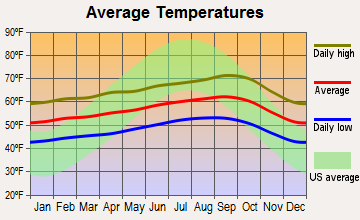
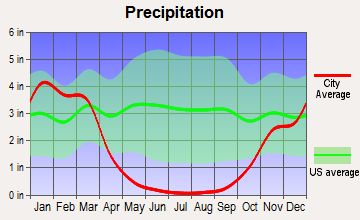
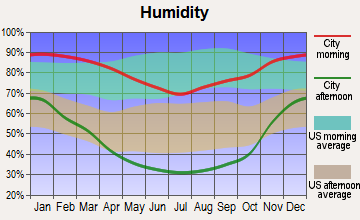
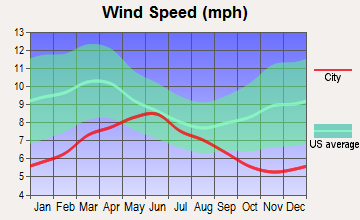
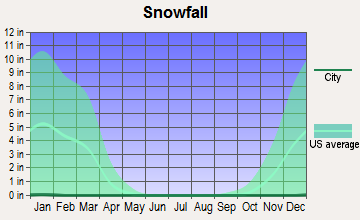
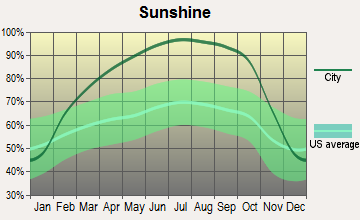
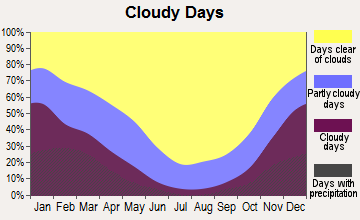
Average climate in Pacific Grove, California
Based on data reported by over 4,000 weather stations
|
|

(lower is better)
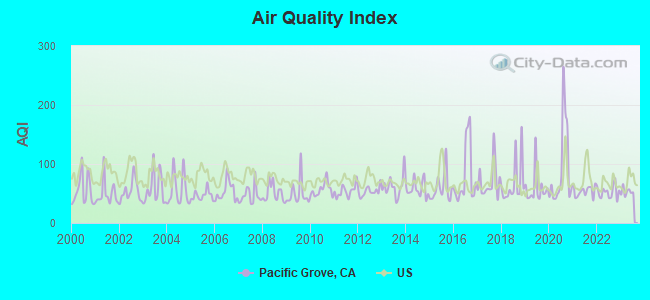
Air Quality Index (AQI) level in 2023 was 53.0. This is better than average.
| City: | 53.0 |
| U.S.: | 72.6 |
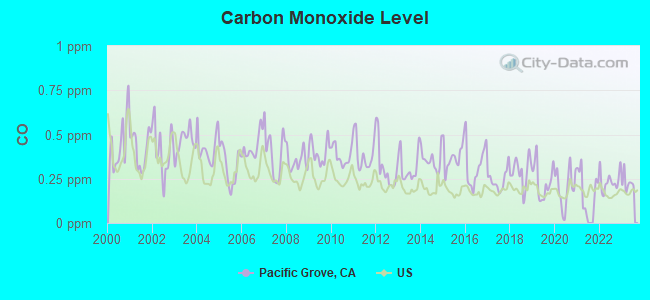
Carbon Monoxide (CO) [ppm] level in 2023 was 0.228. This is about average. Closest monitor was 1.9 miles away from the city center.
| City: | 0.228 |
| U.S.: | 0.251 |
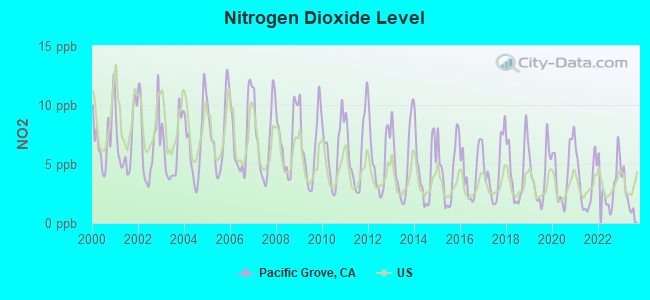
Nitrogen Dioxide (NO2) [ppb] level in 2023 was 2.40. This is significantly better than average. Closest monitor was 1.9 miles away from the city center.
| City: | 2.40 |
| U.S.: | 5.11 |
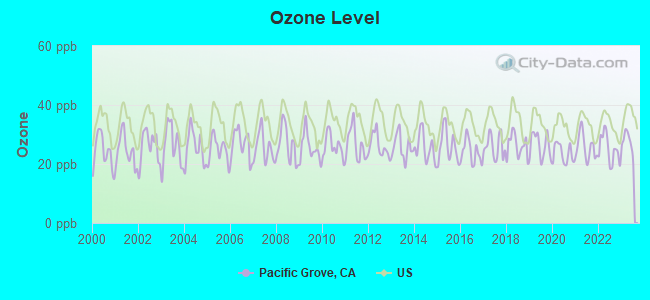
Ozone [ppb] level in 2023 was 27.4. This is better than average. Closest monitor was 1.9 miles away from the city center.
| City: | 27.4 |
| U.S.: | 33.3 |
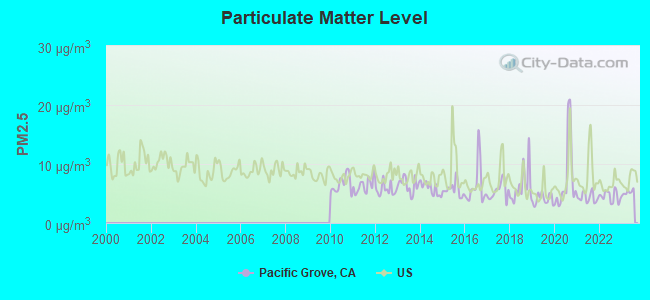
Particulate Matter (PM2.5) [µg/m3] level in 2023 was 5.19. This is significantly better than average. Closest monitor was 14.1 miles away from the city center.
| City: | 5.19 |
| U.S.: | 8.11 |
Earthquake activity:
Pacific Grove-area historical earthquake activity is significantly above California state average. It is 7301% greater than the overall U.S. average.On 4/18/1906 at 13:12:21, a magnitude 7.9 (7.9 UK, Class: Major, Intensity: VIII - XII) earthquake occurred 112.5 miles away from the city center, causing $524,000,000 total damage
On 11/4/1927 at 13:51:53, a magnitude 7.5 (7.5 UK) earthquake occurred 128.0 miles away from Pacific Grove center
On 10/18/1989 at 00:04:15, a magnitude 7.1 (6.5 MB, 7.1 MS, 6.9 MW, 7.0 ML) earthquake occurred 35.0 miles away from the city center, causing 62 deaths (62 shaking deaths) and 3757 injuries, causing $1,305,032,704 total damage
On 7/21/1952 at 11:52:14, a magnitude 7.7 (7.7 UK) earthquake occurred 198.4 miles away from Pacific Grove center, causing $50,000,000 total damage
On 5/2/1983 at 23:42:37, a magnitude 6.7 (6.2 MB, 6.5 MS, 6.5 MW, 6.7 ML, Class: Strong, Intensity: VII - IX) earthquake occurred 94.2 miles away from Pacific Grove center, causing $31,000,000 total damage
On 12/22/2003 at 19:15:56, a magnitude 6.6 (6.1 MB, 6.4 MS, 6.6 MW, 6.4 MW) earthquake occurred 83.9 miles away from the city center, causing 2 deaths (2 shaking deaths) and 40 injuries, causing $200,000,000 total damage
Magnitude types: body-wave magnitude (MB), local magnitude (ML), surface-wave magnitude (MS), moment magnitude (MW)
Natural disasters:
The number of natural disasters in Monterey County (23) is greater than the US average (15).Major Disasters (Presidential) Declared: 14
Emergencies Declared: 3
Causes of natural disasters: Floods: 12, Winter Storms: 7, Storms: 6, Fires: 4, Landslides: 4, Mudslides: 4, Freezes: 2, Drought: 1, Earthquake: 1, Hurricane: 1, Tornado: 1, Tsunami Wave: 1, Other: 1 (Note: some incidents may be assigned to more than one category).
Hospitals and medical centers in Pacific Grove:
Amtrak stations near Pacific Grove:
- 3 miles: MONTEREY TRANSIT PLAZA (MONTEREY, PEARL & TYLER STS.) - Bus Station . Services: fully wheelchair accessible, public payphones, paid short-term parking, paid long-term parking, taxi stand, public transit connection.
- 5 miles: SEASIDE (BLDG. T-1176, 4TH ST.) - Bus Station . Services: fully wheelchair accessible, public payphones, free short-term parking, call for taxi service, public transit connection.
- 6 miles: CARMEL (3665 RIO RD.) - Bus Station . Services: fully wheelchair accessible, public restrooms, public payphones, snack bar, call for car rental service, call for taxi service, public transit connection.
Colleges/universities with over 2000 students nearest to Pacific Grove:
- Monterey Peninsula College (about 3 miles; Monterey, CA; Full-time enrollment: 4,588)
- Naval Postgraduate School (about 4 miles; Monterey, CA; FT enrollment: 4,951)
- California State University-Monterey Bay (about 8 miles; Seaside, CA; FT enrollment: 5,125)
- Hartnell College (about 15 miles; Salinas, CA; FT enrollment: 5,506)
- Cabrillo College (about 26 miles; Aptos, CA; FT enrollment: 7,729)
- University of California-Santa Cruz (about 28 miles; Santa Cruz, CA; FT enrollment: 17,751)
- Gavilan College (about 32 miles; Gilroy, CA; FT enrollment: 3,327)
Public high schools in Pacific Grove:
- PACIFIC GROVE HIGH (Students: 393, Location: 615 SUNSET DR., Grades: 9-12)
- COMMUNITY HIGH (CONTINUATION) (Students: 9, Location: 1004 DAVID AVE., Grades: 9-12)
Public elementary/middle schools in Pacific Grove:
- PACIFIC GROVE MIDDLE (Students: 369, Location: 835 FOREST AVE., Grades: 6-8)
- ROBERT DOWN ELEMENTARY (Students: 213, Location: 485 PINE AVE., Grades: KG-5)
- FOREST GROVE ELEMENTARY (Students: 213, Location: 1065 CONGRESS AVE., Grades: KG-5)
- MONTEREY BAY CHARTER (Students: 137, Location: 1004 DAVID AVE., Grades: KG-8, Charter school)
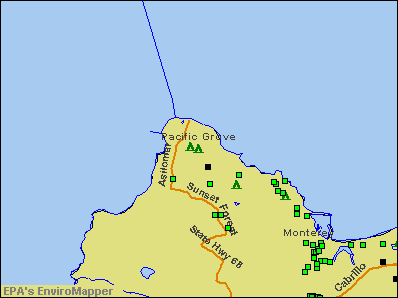
Points of interest:
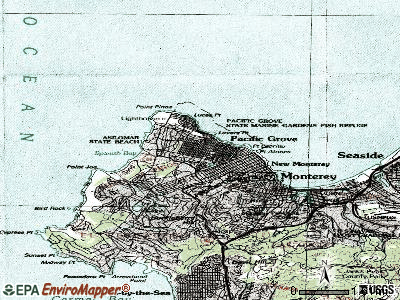
Notable locations in Pacific Grove: Southern Pacific Station (A), Pacific Grove Municipal Golf Links (B), Point Piños Light Station (C), Asilomar (D), Pacific Grove Museum of Natural History (E), Pacific Grove Art Center (F), Asilomar Conference Center (G), Steinbeck Museum (H), Pacific Grove Public Library (I), Pacific Grove City Hall (J), Pacific Grove Chamber of Commerce (K), Heritage Social Museum (L), Forest Lodge (M), Asilomar Conference Grounds (N), Seventeen Mile Drive Manor (O), Forest Hill Manor (P), Heritage Social Museum (Q), Westmed Ambulance Unit 22 (R), Pacific Grove Fire Department (S). Display/hide their locations on the map
Shopping Centers: Seventeen Mile Drive Village Shopping Center (1), American Tin Cannery Outlet Center Shopping Center (2), Forest Hill Shopping Center (3), Country Club Gate Shopping Center (4). Display/hide their locations on the map
Churches in Pacific Grove include: Coastlands-The Monterey Foursquare Church (A), First United Methodist Church (B), Holy Spirit Chapel (C), Peninsula Baptist Church (D), Peninsula Christian Center (E), Peninsula Presbyterian Church (F), Shoreline Community Church (G), Chapel In the Pines (H), Christian Church of Pacific Grove (I). Display/hide their locations on the map
Cemetery: El Carmeto Cemetery (1). Display/hide its location on the map
Lake: Crespi Pond (A). Display/hide its location on the map
Parks in Pacific Grove include: Asilomar State Beach (1), Arnett Park (2), Caledonia Park (3), Forest Hill Playground (4), Breaker Stadium (5), Chase Park (6), Esplanade Park (7), Higgins Park (8), Jewel Park (9). Display/hide their locations on the map
Tourist attraction: Bette L Phillips Health Insurana Agncy & Ntry STRE (Museums; 169 Fountain Avenue).
Hotels: Beachcomber Inn & Restaurant (1996 Sunset Drive), Anton Inn (1095 Lighthouse Ave), Best Western Lighthouse Lodge & Suites (1150 Lighthouse Avenue), Pacific Gardens Inns (701 Asilomar Blvd), Andril Fireplace Cottages (569 Asilomar Boulevard), Best Western Monarch Resort (1111 Lighthouse Avenue), Olympia Lodge (1140 Lighthouse Ave), Borg's Ocean Front Motel (635 Ocean View Boulevard), Bide A Wee Inn & Cottages (221 Asilomar Avenue).
Birthplace of: Benjamin Jealous - Chief executive.
| This city: | 2.1 people |
| California: | 2.9 people |
| This city: | 54.4% |
| Whole state: | 68.7% |
| This city: | 5.8% |
| Whole state: | 7.2% |
Likely homosexual households (counted as self-reported same-sex unmarried-partner households)
- Lesbian couples: 0.6% of all households
- Gay men: 0.3% of all households
People in group quarters in Pacific Grove in 2010:
- 215 people in nursing facilities/skilled-nursing facilities
- 81 people in group homes intended for adults
- 56 people in residential treatment centers for adults
- 3 people in other noninstitutional facilities
People in group quarters in Pacific Grove in 2000:
- 83 people in other noninstitutional group quarters
- 47 people in schools, hospitals, or wards for the intellectually disabled
- 43 people in nursing homes
- 2 people in religious group quarters
Banks with branches in Pacific Grove (2011 data):
- JPMorgan Chase Bank, National Association: 170 Country Club Gate Center Branch at 170 Country Club Gate Center, branch established on 1919/01/01; Pacific Grove Branch at 569 Lighthouse Avenue, branch established on 1966/02/15. Info updated 2011/11/10: Bank assets: $1,811,678.0 mil, Deposits: $1,190,738.0 mil, headquarters in Columbus, OH, positive income, International Specialization, 5577 total offices, Holding Company: Jpmorgan Chase & Co.
- Union Bank, National Association: Pacific Grove Branch at 580 Lighthouse Avenue, branch established on 2003/12/15. Info updated 2011/09/01: Bank assets: $88,967.5 mil, Deposits: $65,286.4 mil, headquarters in San Francisco, CA, positive income, Commercial Lending Specialization, 403 total offices, Holding Company: Mitsubishi Ufj Financial Group, Inc.
- Wells Fargo Bank, National Association: Pacific Grove Branch at 1160 Forest Avenue, branch established on 1962/11/26. Info updated 2011/04/05: Bank assets: $1,161,490.0 mil, Deposits: $905,653.0 mil, headquarters in Sioux Falls, SD, positive income, 6395 total offices, Holding Company: Wells Fargo & Company
- Monterey County Bank: Pacific Grove Branch at 542 Lighthouse Avenue, branch established on 1997/04/14. Info updated 2011/01/31: Bank assets: $249.3 mil, Deposits: $203.7 mil, headquarters in Monterey, CA, negative income in the last year, Commercial Lending Specialization, 5 total offices, Holding Company: Northern California Bancorp, Inc.
- Bank of America, National Association: Pacific Grove Branch at 601 Lighthouse Avenue, branch established on 1934/12/24. Info updated 2009/11/18: Bank assets: $1,451,969.3 mil, Deposits: $1,077,176.8 mil, headquarters in Charlotte, NC, positive income, 5782 total offices, Holding Company: Bank Of America Corporation
For population 15 years and over in Pacific Grove:
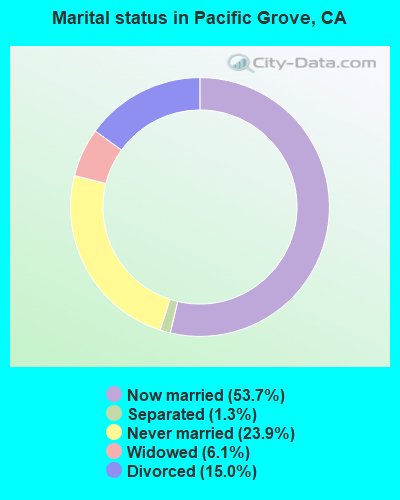
- Never married: 23.9%
- Now married: 53.7%
- Separated: 1.3%
- Widowed: 6.1%
- Divorced: 15.0%
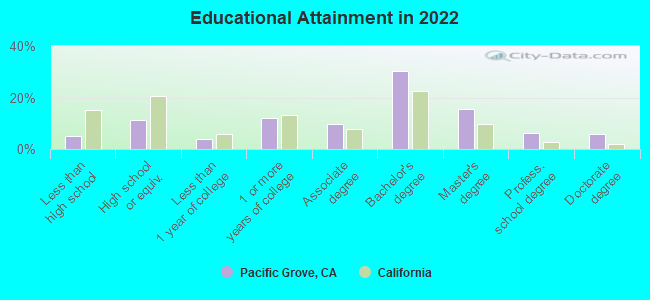
For population 25 years and over in Pacific Grove:
- High school or higher: 95.5%
- Bachelor's degree or higher: 57.2%
- Graduate or professional degree: 28.3%
- Unemployed: 3.1%
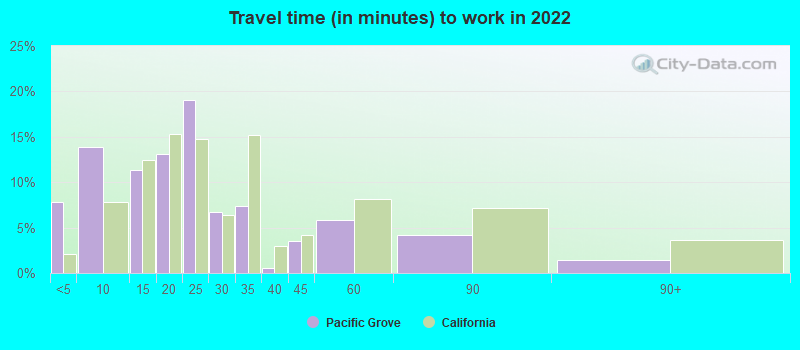
- Mean travel time to work (commute): 15.8 minutes
| Here: | 10.6 |
| California average: | 15.5 |
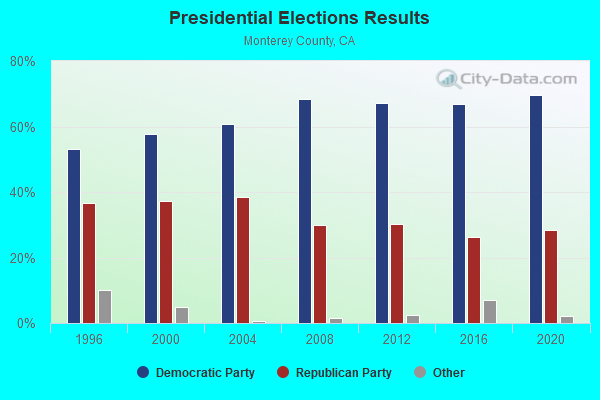
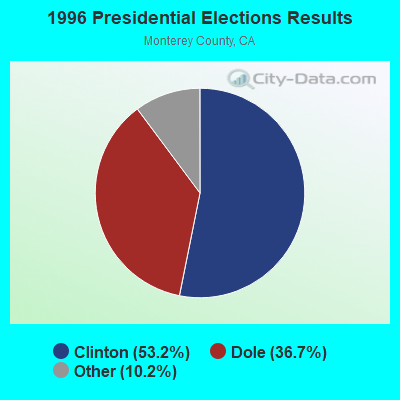
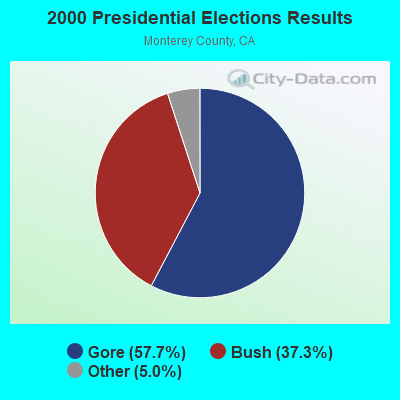
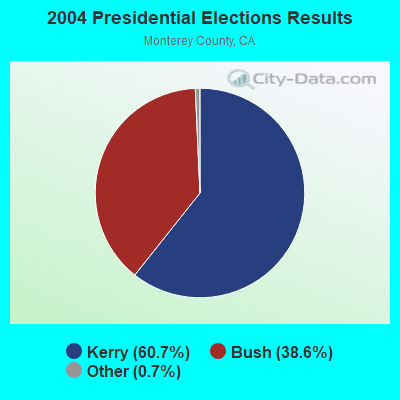
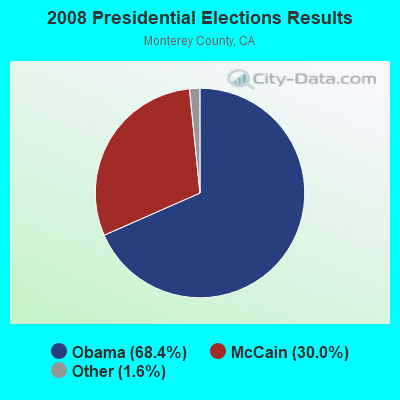
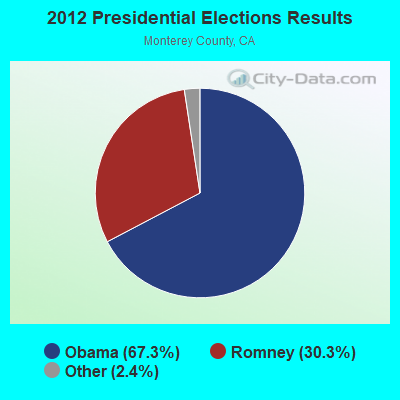
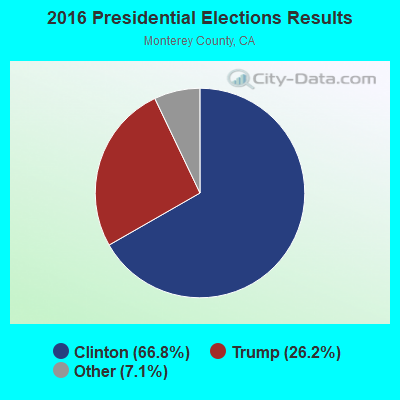
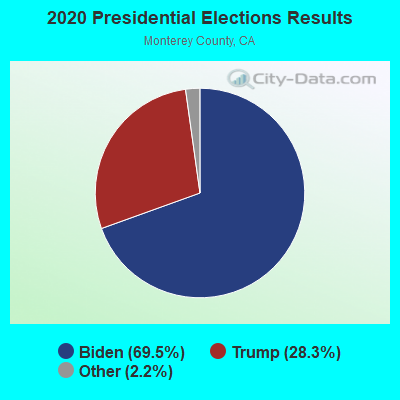
Graphs represent county-level data. Detailed 2008 Election Results
Religion statistics for Pacific Grove, CA (based on Monterey County data)
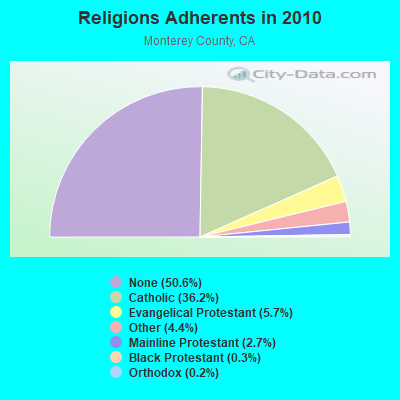
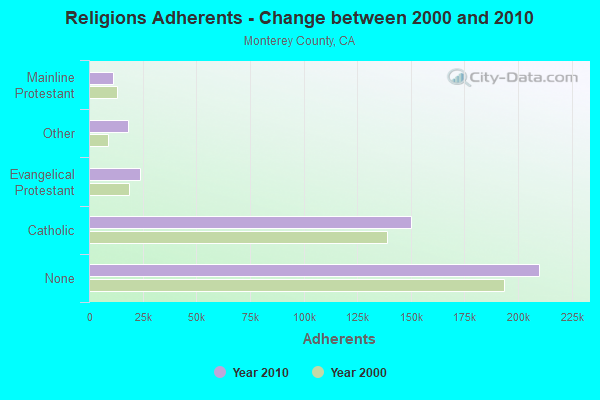
| Religion | Adherents | Congregations |
|---|---|---|
| Catholic | 150,050 | 26 |
| Evangelical Protestant | 23,624 | 154 |
| Other | 18,309 | 48 |
| Mainline Protestant | 11,244 | 48 |
| Black Protestant | 1,199 | 8 |
| Orthodox | 640 | 3 |
| None | 209,991 | - |
Food Environment Statistics:
| Monterey County: | 2.82 / 10,000 pop. |
| California: | 2.14 / 10,000 pop. |
| Here: | 0.05 / 10,000 pop. |
| California: | 0.04 / 10,000 pop. |
| This county: | 0.91 / 10,000 pop. |
| State: | 0.62 / 10,000 pop. |
| Monterey County: | 2.00 / 10,000 pop. |
| State: | 1.49 / 10,000 pop. |
| Monterey County: | 9.24 / 10,000 pop. |
| California: | 7.42 / 10,000 pop. |
| Monterey County: | 7.5% |
| California: | 7.3% |
| Monterey County: | 21.8% |
| California: | 21.3% |
| Monterey County: | 18.4% |
| California: | 17.9% |
Health and Nutrition:
| Pacific Grove: | 51.9% |
| California: | 49.4% |
| Here: | 49.1% |
| California: | 48.0% |
| Pacific Grove: | 28.4 |
| State: | 28.1 |
| This city: | 20.3% |
| California: | 20.2% |
| This city: | 10.4% |
| State: | 11.2% |
| Here: | 6.9 |
| California: | 6.8 |
| Pacific Grove: | 35.1% |
| California: | 31.5% |
| Here: | 56.9% |
| State: | 56.4% |
| This city: | 78.0% |
| State: | 80.9% |
More about Health and Nutrition of Pacific Grove, CA Residents
| Local government employment and payroll (March 2022) | |||||
| Function | Full-time employees | Monthly full-time payroll | Average yearly full-time wage | Part-time employees | Monthly part-time payroll |
|---|---|---|---|---|---|
| Police Protection - Officers | 23 | $269,701 | $140,714 | 0 | $0 |
| Parks and Recreation | 22 | $141,532 | $77,199 | 4 | $3,583 |
| Police - Other | 9 | $61,865 | $82,487 | 0 | $0 |
| Financial Administration | 8 | $66,407 | $99,611 | 3 | $7,562 |
| Local Libraries | 7 | $75,985 | $130,260 | 9 | $12,774 |
| Housing and Community Development (Local) | 5 | $44,063 | $105,751 | 2 | $4,586 |
| Other Government Administration | 4 | $23,453 | $70,359 | 7 | $3,291 |
| Streets and Highways | 3 | $22,229 | $88,916 | 0 | $0 |
| Sewerage | 2 | $29,414 | $176,484 | 0 | $0 |
| Other and Unallocable | 1 | $7,542 | $90,504 | 0 | $0 |
| Totals for Government | 84 | $742,190 | $106,027 | 25 | $31,796 |
Pacific Grove government finances - Expenditure in 2017 (per resident):
- Construction - Sewerage: $1,873,000 ($126.63)
Regular Highways: $574,000 ($38.81)
- Current Operations - Police Protection: $6,097,000 ($412.21)
Central Staff Services: $4,075,000 ($275.51)
Local Fire Protection: $2,999,000 ($202.76)
Regular Highways: $2,069,000 ($139.88)
Parks and Recreation: $1,480,000 ($100.06)
Sewerage: $1,389,000 ($93.91)
Protective Inspection and Regulation - Other: $1,225,000 ($82.82)
Financial Administration: $1,036,000 ($70.04)
Libraries: $976,000 ($65.99)
Housing and Community Development: $504,000 ($34.07)
Miscellaneous Commercial Activities - Other: $264,000 ($17.85)
- General - Interest on Debt: $1,080,000 ($73.02)
- Intergovernmental to Local - Other - Local Fire Protection: $1,998,000 ($135.08)
- Other Capital Outlay - Parks and Recreation: $524,000 ($35.43)
Sewerage: $132,000 ($8.92)
Central Staff Services: $31,000 ($2.10)
Police Protection: $31,000 ($2.10)
Pacific Grove government finances - Revenue in 2017 (per resident):
- Charges - Sewerage: $3,143,000 ($212.49)
Other: $1,154,000 ($78.02)
Miscellaneous Commercial Activities: $446,000 ($30.15)
Parks and Recreation: $418,000 ($28.26)
Housing and Community Development: $40,000 ($2.70)
- Federal Intergovernmental - Housing and Community Development: $84,000 ($5.68)
Other: $20,000 ($1.35)
- Miscellaneous - General Revenue - Other: $728,000 ($49.22)
Rents: $223,000 ($15.08)
Interest Earnings: $84,000 ($5.68)
Donations From Private Sources: $75,000 ($5.07)
Fines and Forfeits: $36,000 ($2.43)
- State Intergovernmental - Other: $3,716,000 ($251.23)
Highways: $289,000 ($19.54)
General Local Government Support: $26,000 ($1.76)
- Tax - Property: $6,532,000 ($441.62)
Other Selective Sales: $5,830,000 ($394.16)
General Sales and Gross Receipts: $4,159,000 ($281.18)
Public Utilities Sales: $2,711,000 ($183.29)
Other License: $776,000 ($52.46)
Occupation and Business License - Other: $403,000 ($27.25)
Documentary and Stock Transfer: $125,000 ($8.45)
Pacific Grove government finances - Debt in 2017 (per resident):
- Long Term Debt - Outstanding Unspecified Public Purpose: $18,347,000 ($1240.42)
Beginning Outstanding - Unspecified Public Purpose: $14,370,000 ($971.54)
Issue, Unspecified Public Purpose: $5,348,000 ($361.57)
Retired Unspecified Public Purpose: $1,371,000 ($92.69)
Pacific Grove government finances - Cash and Securities in 2017 (per resident):
- Bond Funds - Cash and Securities: $813,000 ($54.97)
- Other Funds - Cash and Securities: $24,251,000 ($1639.58)
- Sinking Funds - Cash and Securities: $110,000 ($7.44)
4.96% of this county's 2021 resident taxpayers lived in other counties in 2020 ($91,945 average adjusted gross income)
| Here: | 4.96% |
| California average: | 5.19% |
0.08% of residents moved from foreign countries ($1,276 average AGI)
Monterey County: 0.08% California average: 0.03%
Top counties from which taxpayers relocated into this county between 2020 and 2021:
| from Santa Cruz County, CA | |
| from Santa Clara County, CA | |
| from Los Angeles County, CA |
6.17% of this county's 2020 resident taxpayers moved to other counties in 2021 ($76,219 average adjusted gross income)
| Here: | 6.17% |
| California average: | 6.14% |
0.08% of residents moved to foreign countries ($1,055 average AGI)
Monterey County: 0.08% California average: 0.02%
Top counties to which taxpayers relocated from this county between 2020 and 2021:
| to Santa Cruz County, CA | |
| to Santa Clara County, CA | |
| to Los Angeles County, CA |
| Businesses in Pacific Grove, CA | ||||
| Name | Count | Name | Count | |
|---|---|---|---|---|
| Ace Hardware | 2 | MasterBrand Cabinets | 6 | |
| Blockbuster | 1 | McDonald's | 1 | |
| Curves | 1 | Nike | 1 | |
| Decora Cabinetry | 3 | Pier 1 Imports | 1 | |
| Domino's Pizza | 1 | Rite Aid | 1 | |
| FedEx | 1 | Safeway | 1 | |
| GNC | 1 | Subway | 1 | |
| H&R Block | 1 | Trader Joe's | 1 | |
| Howard Johnson | 1 | UPS | 2 | |
| IZOD | 1 | Vons | 1 | |
Strongest AM radio stations in Pacific Grove:
- KNRY (1240 AM; 1 kW; MONTEREY, CA; Owner: PEOPLE'S RADIO, INC.)
- KRML (1410 AM; 2 kW; CARMEL, CA; Owner: WISDOM BROADCASTING CO, INC.)
- KYAA (1200 AM; 25 kW; SOQUEL, CA; Owner: PEOPLE'S RADIO, INC.)
- KSRK (540 AM; 10 kW; CARMEL VALLEY, CA; Owner: PEOPLE'S RADIO, INC.)
- KDBV (980 AM; 10 kW; SALINAS, CA; Owner: WOLFHOUSE RADIO GROUP, INC.)
- KIDD (630 AM; 1 kW; MONTEREY, CA; Owner: BUCKLEY COMMUNICATIONS, INC.)
- KLOK (1170 AM; 50 kW; SAN JOSE, CA; Owner: ENTRAVISION HOLDINGS, LLC)
- KION (1460 AM; 10 kW; SALINAS, CA)
- KSCO (1080 AM; 10 kW; SANTA CRUZ, CA)
- KNBR (680 AM; 50 kW; SAN FRANCISCO, CA; Owner: KNBR LICO, INC.)
- KKMC (880 AM; 10 kW; GONZALES, CA; Owner: MONTEREY COUNTY BROADCASTERS, INC.)
- KGO (810 AM; 50 kW; SAN FRANCISCO, CA; Owner: KGO-AM RADIO, INC.)
- KTOM (1380 AM; 5 kW; SALINAS, CA; Owner: CLEAR CHANNEL BROADCASTING LICENSES, INC.)
Strongest FM radio stations in Pacific Grove:
- KMBY-FM (103.9 FM; SEASIDE, CA; Owner: MAPLETON COMMUNICATIONS, LLC)
- KSPB (91.9 FM; PEBBLE BEACH, CA; Owner: ROBERT LOUIS STEVENSON SCHOOL)
- KUSP (88.9 FM; SANTA CRUZ, CA; Owner: PATAPHYSICAL B/CING. FOUNDATION,INC.)
- K260AA (99.9 FM; CARMEL VALLEY, CA; Owner: ENTRAVISION HOLDINGS, LLC)
- KWAV (96.9 FM; MONTEREY, CA; Owner: BUCKLEY BROADCASTING OF MONTEREY)
- KTOM-FM (100.7 FM; SALINAS, CA; Owner: CLEAR CHANNEL BROADCASTING LICENSES, INC.)
- K291AE (106.1 FM; SEASIDE, CA; Owner: MAPELTON COMMUNICATIONS, LLC)
- KBOQ (95.5 FM; CARMEL, CA; Owner: J & M BROADCASTING, INC.)
- KMJO (92.7 FM; MARINA, CA; Owner: CLEAR CHANNEL BROADCASTING LICENSES, INC.)
- KSES-FM (107.1 FM; SEASIDE, CA; Owner: ENTRAVISION HOLDINGS, LLC)
- KDON-FM (102.5 FM; SALINAS, CA; Owner: CLEAR CHANNEL BROADCASTING LICENSES, INC.)
- K202DU (88.3 FM; SAN JUAN BAUTISTA, CA; Owner: CALVARY CHAPEL OF TWIN FALLS, INC.)
- KBTU (93.5 FM; HOLLISTER, CA; Owner: MAPLETON COMMUNICATIONS, L.L.C.)
- KAZU (90.3 FM; PACIFIC GROVE, CA; Owner: FOUNDATION OF CALIFORNIA STATE UNIVERSITY, MONTEREY BAY)
- KCDU (101.7 FM; CARMEL, CA; Owner: MAPLETON COMMUNICATIONS, L.L.C.)
- KLVM (89.7 FM; PRUNEDALE, CA; Owner: PRUNEDALE EDUCATIONAL ASSOCIATION)
- KOCN (105.1 FM; PACIFIC GROVE, CA; Owner: CLEAR CHANNEL BROADCASTING LICENSES, INC.)
- K265DG (100.9 FM; HOLLISTER, CA; Owner: CLEAR CHANNEL BROADCASTING LICENSES, INC.)
- K206BQ (89.1 FM; HOLLISTER, CA; Owner: PATAPHYSICAL BROADCASTING FOUNDATION, INC.)
- KSQL (99.1 FM; SANTA CRUZ, CA; Owner: TMS LICENSE CALIFORNIA, INC)
TV broadcast stations around Pacific Grove:
- K53DT (Channel 53; MONTEREY, CA; Owner: TRINITY BROADCASTING NETWORK)
- KSBW (Channel 8; SALINAS, CA; Owner: HEARST-ARGYLE STATIONS, INC.)
- KION-TV (Channel 46; MONTEREY, CA; Owner: ACKERLEY MEDIA GROUP, INC.)
FCC Registered Antenna Towers: 33 (See the full list of FCC Registered Antenna Towers)
FCC Registered Broadcast Land Mobile Towers: 9 (See the full list of FCC Registered Broadcast Land Mobile Towers in Pacific Grove, CA)
FCC Registered Microwave Towers: 9 (See the full list of FCC Registered Microwave Towers in this town)
FCC Registered Maritime Coast & Aviation Ground Towers: 1 (See the full list of FCC Registered Maritime Coast & Aviation Ground Towers)
FCC Registered Amateur Radio Licenses: 137 (See the full list of FCC Registered Amateur Radio Licenses in Pacific Grove)
FAA Registered Aircraft Manufacturers and Dealers: 1 (See the full list of FAA Registered Manufacturers and Dealers in Pacific Grove)
FAA Registered Aircraft: 16 (See the full list of FAA Registered Aircraft)
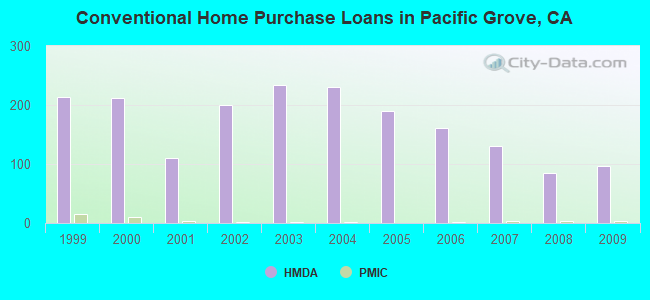
| Home Mortgage Disclosure Act Aggregated Statistics For Year 2009 (Based on 6 full tracts) | ||||||||||||
| A) FHA, FSA/RHS & VA Home Purchase Loans | B) Conventional Home Purchase Loans | C) Refinancings | D) Home Improvement Loans | E) Loans on Dwellings For 5+ Families | F) Non-occupant Loans on < 5 Family Dwellings (A B C & D) | |||||||
|---|---|---|---|---|---|---|---|---|---|---|---|---|
| Number | Average Value | Number | Average Value | Number | Average Value | Number | Average Value | Number | Average Value | Number | Average Value | |
| LOANS ORIGINATED | 15 | $492,218 | 96 | $440,201 | 475 | $334,033 | 21 | $289,000 | 0 | $0 | 135 | $382,989 |
| APPLICATIONS APPROVED, NOT ACCEPTED | 1 | $454,130 | 11 | $363,182 | 46 | $357,589 | 3 | $174,723 | 0 | $0 | 14 | $348,861 |
| APPLICATIONS DENIED | 0 | $0 | 20 | $390,573 | 136 | $415,285 | 8 | $239,638 | 0 | $0 | 36 | $379,923 |
| APPLICATIONS WITHDRAWN | 1 | $426,000 | 14 | $404,450 | 90 | $417,317 | 3 | $154,193 | 1 | $1,270,000 | 23 | $358,268 |
| FILES CLOSED FOR INCOMPLETENESS | 0 | $0 | 3 | $249,000 | 24 | $429,978 | 2 | $217,500 | 0 | $0 | 7 | $319,259 |
Detailed HMDA statistics for the following Tracts: 0120.00 , 0121.00, 0122.00, 0123.02, 0124.01, 0124.02
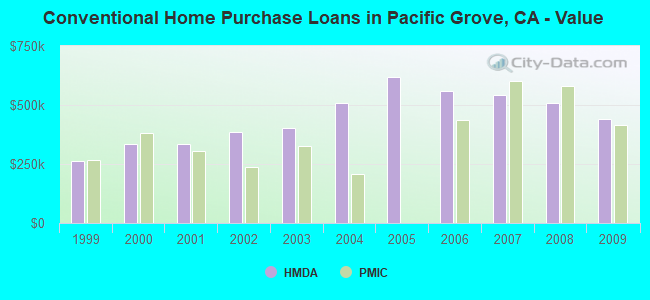
| Private Mortgage Insurance Companies Aggregated Statistics For Year 2009 (Based on 4 full tracts) | ||||
| A) Conventional Home Purchase Loans | B) Refinancings | |||
|---|---|---|---|---|
| Number | Average Value | Number | Average Value | |
| LOANS ORIGINATED | 3 | $415,263 | 1 | $410,000 |
| APPLICATIONS APPROVED, NOT ACCEPTED | 2 | $567,515 | 0 | $0 |
| APPLICATIONS DENIED | 0 | $0 | 1 | $720,880 |
| APPLICATIONS WITHDRAWN | 0 | $0 | 0 | $0 |
| FILES CLOSED FOR INCOMPLETENESS | 0 | $0 | 0 | $0 |
Detailed PMIC statistics for the following Tracts: 0120.00 , 0121.00, 0122.00, 0123.02, 0124.01, 0124.02
2002 - 2018 National Fire Incident Reporting System (NFIRS) incidents
- Fire incident types reported to NFIRS in Pacific Grove, CA
- 12450.8%Structure Fires
- 8836.1%Outside Fires
- 218.6%Mobile Property/Vehicle Fires
- 114.5%Other
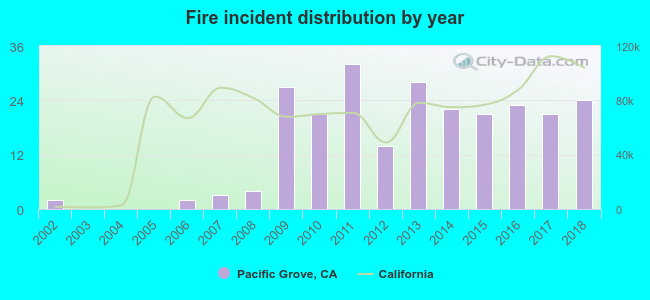 According to the data from the years 2002 - 2018 the average number of fires per year is 14. The highest number of reported fire incidents - 32 took place in 2011, and the least - 0 in 2003. The data has a rising trend.
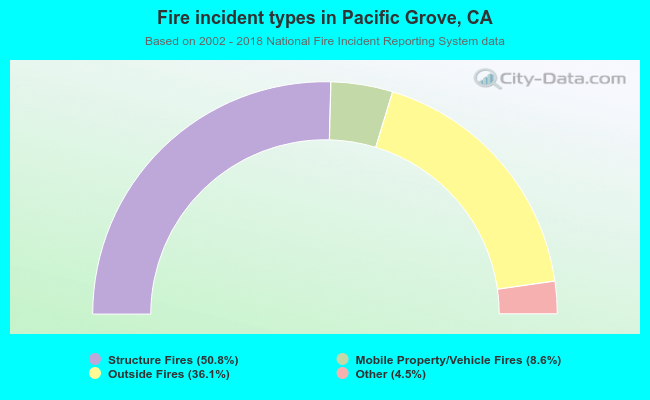 When looking into fire subcategories, the most incidents belonged to: Structure Fires (50.8%), and Outside Fires (36.1%).
Fire-safe hotels and motels in Pacific Grove, California:
- Best Western Inn, 1111 Lighthouse Ave, Pacific Grove, California 93950 , Phone: (831) 646-8885, Fax: (831) 646-9576
- Rosedale Inn, 775 Asilomar Blvd, Pacific Grove, California 93950 , Phone: (408) 655-1000
- Sea Breeze Lodge, 1101 Lighthouse Avenue/204 Grv Acre, Pacific Grove, California 93950 , Phone: (831) 372-3431, Fax: (831) 643-0235
- Sea Breeze Inn & Cottages, 1100 Lighthouse Ave, Pacific Grove, California 93950 , Phone: (831) 655-6325, Fax: (831) 643-0235
- Asilomar Lodge - Conference Grounds, 800 Asilomar Ave, Pacific Grove, California 93950 , Phone: (831) 372-8016, Fax: (831) 642-4261
- Best Western The Inn And Suites Pacific Grove, 660 Dennett St, Pacific Grove, California 93950 , Phone: (831) 373-8777, Fax: (831) 373-2698
- Clarion Collection Wilkies Inn, 1038 Lighthouse Ave, Pacific grove, California 93950 , Phone: (831) 372-5960, Fax: (831) 655-1681
| Most common first names in Pacific Grove, CA among deceased individuals | ||
| Name | Count | Lived (average) |
|---|---|---|
| John | 176 | 77.5 years |
| Mary | 166 | 79.3 years |
| William | 118 | 75.9 years |
| Robert | 96 | 73.9 years |
| James | 85 | 74.6 years |
| Helen | 84 | 84.6 years |
| George | 82 | 76.3 years |
| Dorothy | 75 | 81.9 years |
| Charles | 73 | 78.5 years |
| Margaret | 72 | 81.9 years |
| Most common last names in Pacific Grove, CA among deceased individuals | ||
| Last name | Count | Lived (average) |
|---|---|---|
| Smith | 53 | 78.2 years |
| Miller | 36 | 74.0 years |
| Johnson | 35 | 78.4 years |
| Moore | 27 | 74.5 years |
| Williams | 26 | 78.3 years |
| Wilson | 23 | 80.8 years |
| Jones | 22 | 79.4 years |
| Thompson | 22 | 82.4 years |
| Thomas | 22 | 76.4 years |
| Davis | 21 | 82.5 years |
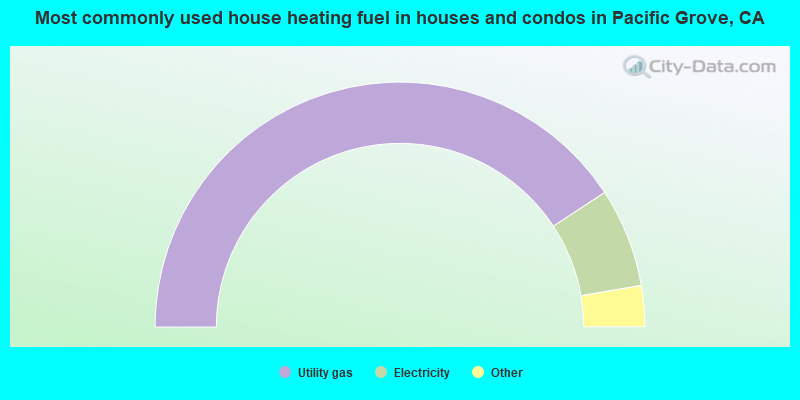
- 81.5%Utility gas
- 13.1%Electricity
- 2.2%Solar energy
- 2.1%Bottled, tank, or LP gas
- 0.6%Wood
- 0.3%No fuel used
- 0.2%Other fuel
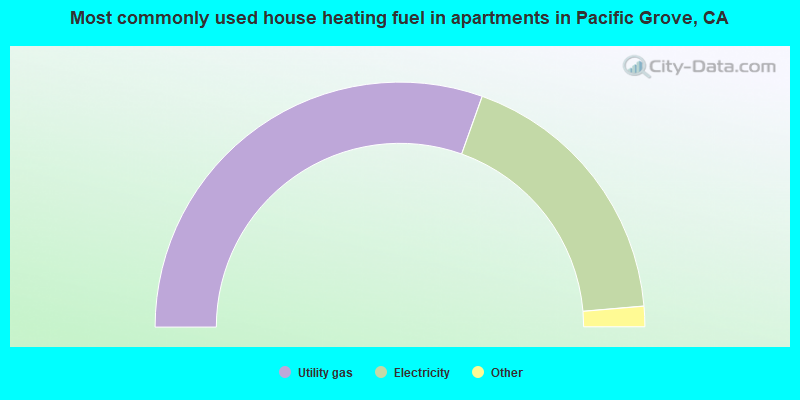
- 60.9%Utility gas
- 36.4%Electricity
- 1.3%No fuel used
- 1.0%Bottled, tank, or LP gas
- 0.3%Wood
Pacific Grove compared to California state average:
- Median house value above state average.
- Unemployed percentage significantly below state average.
- Black race population percentage significantly below state average.
- Hispanic race population percentage significantly below state average.
- Median age significantly above state average.
- Foreign-born population percentage below state average.
- Length of stay since moving in above state average.
- House age above state average.
- Percentage of population with a bachelor's degree or higher above state average.
Pacific Grove on our top lists:
- #41 on the list of "Top 101 cities with the most residents born in Egypt (population 500+)"
- #58 on the list of "Top 101 cities with the most residents born in Northern Africa (population 500+)"
- #71 on the list of "Top 100 cities with highest ratio of median house value to median household income (pop. 5,000+)"
- #15 on the list of "Top 101 counties with the highest Nitrogen Dioxide air pollution readings in 2012 (ppm)"
- #20 on the list of "Top 101 counties with the lowest surface withdrawal of fresh water for public supply (pop. 50,000+)"
- #33 on the list of "Top 101 counties with the highest number of births per 1000 residents 2007-2013"
- #44 on the list of "Top 101 counties with the lowest Particulate Matter (PM2.5) Annual air pollution readings in 2012 (µg/m3)"
- #54 on the list of "Top 101 counties with the highest Particulate Matter (PM10) Annual air pollution readings in 2012 (µg/m3)"

|
|
Total of 191 patent applications in 2008-2024.